






















United States Presidential election7 Nov 2028in 717 days Senate D 99% House D 58% Calendar Track record Research

All countries / United States

Election 2028 Forecast

Each election opens in its own mode: the forecast before the votes are counted, the live count while races are still too close to call, and the results once every race is decided.

Still counting2026 midterms: 3 races not yet called · MN-01, NC-05, TN-04The count →

The 2028 presidential election · 7 November 2028

Pick the candidates
Cory BookerCory Bookerno head-to-head polls yet
v
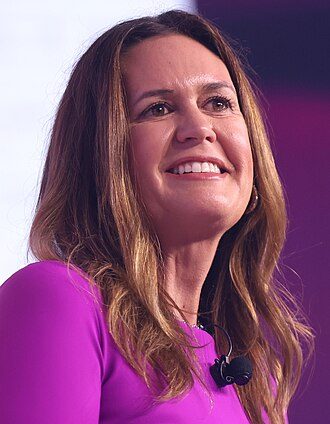
Elise StefanikElise Stefanikno head-to-head polls yet
Back to the generic contest

Cory Booker wins two in three of our simulated races against Elise Stefanik

Put Cory Booker against Elise Stefanik and our early projection gives Booker 293 of the 538 electoral votes on average, and D+3.3 in the national vote. The range is wide: in 80% of our simulations the Democrats win between 232 and 356 electoral votes. Few polls have tested this pairing yet; most of the estimate is the president's approval and how each candidate has run against the other side.

69%Democratic chance
D+3.3national vote

Democratic chance20 Nov: 66%

23 Jul23 Sep20 Nov

50%

On the ballot on 7 November 2028 · our early projections

Also on the ballot: 85 state legislative chambers, attorneys general and secretaries of state, judges, mayors and ballot measures; before then, Kentucky, Louisiana and Mississippi elect governors in 2027. Everything on the ballot →

United States
Explore the full map
If only voted How this works
If the polls miss like

Early projection, based on early and incomplete polling: Cory Booker against Elise Stefanik for president (the Senate, House and governors keep the generic national picture), not a result. Each county is its 2024 presidential margin moved by its state's projected swing; set a national vote and every state, district and county moves by the same amount from our projection. Colours run in 100 steps from a safe Republican to a safe Democratic margin. Boundaries: US Census Bureau.

On the full map: our early 2028 forecast for president, Senate, House and governors in every state, district and county; who would win if only one group voted (if only women voted, if only men voted, if only white voters voted, if only Black voters voted, if only Hispanic voters voted, if only Asian American voters voted, if only voters of color voted); the result if the polls miss like 2026, 2024, 2020, 2016, 2012, 2008, 2006, 2002; your own national vote and turnout; every election back to 1868, and the 2026 midterms as counted; and your own map to share. The 2028 election map →

Latest on 2028

Every article →
  1. United States20 Nov Three House races head to recounts as the count winds down Democrats lead North Carolina's 5th and Minnesota's 1st by about 300 votes each; a Republican leads North Carolina's 10th by more than 2,500.
  2. United States20 Nov How we read a partial count: one county can move the whole map A fifth of the vote counted in one Texas county says something about every race in the country. Here is how we work out how much.
  3. United States11 Nov Did the polls blow the midterms? They missed one way, by more than usual, but not by a record We checked every final poll in the Senate and governor races against the results. The polls underrated Democrats almost everywhere, and the firms that looked best in 2024 did worst this year.
  4. United States11 Nov A week on, Mississippi and Alaska are still counting, and the seats they decide last until 2033 Democrats already control the next Senate. The two races still out will not change that, but they decide how big a cushion the party carries into a 2028 map where it has to defend Arizona, Georgia, Nevada and Pennsylvania.
  5. United States9 Nov The polls got the midterms wrong again, but this time the Democrats were the ones they missed In 57 Senate and governor races the final polls understated the Democrats by three points, the first miss in that direction since 2012 and the largest in that direction on our record. Here is where they went wrong, which pollsters held up, what it did to our own forecast, and what it changes for 2028.
  6. United States6 Nov If everyone voted, would the Democrats win? Not any more Until 2016 the people who stayed home leaned Democratic, so higher turnout helped the party. In 2020 and 2024 they leaned Republican. On our figures, every citizen voting in 2024 would have moved the result about 2 points towards Trump.
  7. United States4 Nov We called Congress for the Democrats hours before the networks. Here is how the night went, and what we got wrong The Democrats won the Senate and the House on a national vote 11 points their way. Our night forecast called both chambers at 8:37 pm Eastern, about two hours before the networks called the House and three before the Senate. A look back at the result and at our live blog, misses included.
  8. United States4 Nov Democrats win the House and the Senate, our forecast says With counts in from Georgia to Michigan, our election-night forecast gives the Democrats more than a 99.9% chance of controlling both chambers of Congress: about 56 Senate seats and about 280 in the House.
2028 · The race for the nominations

Who wins the 2028 primaries?

Every candidate's chance of the nomination. The betting markets (Kalshi and Polymarket) count for 75%: with nobody declared, they price who will actually run. Our model of the national primary polls, run through the 2028 calendar 5,000 times, counts for the rest; this far out those polls mostly measure how well known a name is.

Democratic nomination

428 days to South Carolina
  1. Jon Ossoff Jon Ossoffmarkets 26% · poll model 10% · 8.1% in the polls 22% SC11% NV11% NH11% In the general →
  2. Alexandria Ocasio-Cortez Alexandria Ocasio-Cortezmarkets 15% · poll model 13% · 10.5% in the polls 15% SC13% NV14% NH13% In the general →
  3. Gavin Newsom Gavin Newsommarkets 11% · poll model 17% · 13.4% in the polls ▼ 2 in two months 12% SC16% NV16% NH16% In the general →
  4. Kamala Harris Kamala Harrismarkets 5% · poll model 31% · 22.8% in the polls ▼ 5 in two months 11% SC28% NV29% NH29% In the general →
  5. Pete Buttigieg Pete Buttigiegmarkets 6% · poll model 16% · 11.4% in the polls ▼ 2 in two months 8% SC15% NV15% NH15% In the general →
  6. Josh Shapiro Josh Shapiromarkets 6% · poll model 5% · 4.7% in the polls ▼ 1 in two months 6% SC6% NV6% NH5% In the general →
  7. Andy Beshear Andy Beshearmarkets 4% · poll model 2% · 2.3% in the polls 3% SC3% NV2% NH2% In the general →
  8. Mark Kelly Mark Kellymarkets 3% · poll model 5% · 4.3% in the polls 3% SC5% NV5% NH5% In the general →

Also in the polls: JB Pritzker 2%, Cory Booker 1% · their chances on the Democratic forecast

Who runs decides it: If Harris runs, Newsom stays out: Kamala Harris 35%. If Newsom runs, Harris stays out: Gavin Newsom 26%.

The national primary polls since February 2025
2026Alexandria Ocasio-CortezPete ButtigiegGavin NewsomKamala Harris20 Harris13 Newsom11 Ocasio-Cortez11 Buttigieg

The Democratic forecast →

Republican nomination

423 days to Iowa
  1. JD Vance JD Vancemarkets 30% · poll model 46% · 36.3% in the polls ▼ 3 in two months 34% IA40% NH42% NV42% In the general →
  2. Marco Rubio Marco Rubiomarkets 25% · poll model 32% · 26.2% in the polls ▲ 5 in two months 27% IA30% NH32% NV31% In the general →
  3. Ron DeSantis Ron DeSantismarkets 15% · poll model 10% · 8.8% in the polls ▲ 3 in two months 14% IA12% NH11% NV13% In the general →
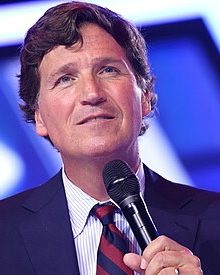
  4. Tucker Carlson Tucker Carlsonmarkets 4% · not in the polls yet 3%
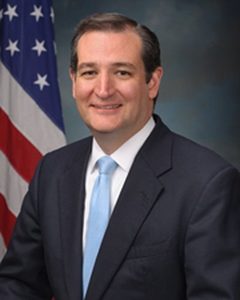
  5. Ted Cruz Ted Cruzmarkets 3% · poll model 2% · 2.2% in the polls 2% IA3% NH2% NV2% In the general →
  6. Donald Trump Jr. Donald Trump Jr.markets 1% · poll model 6% · 5.5% in the polls ▼ 2 in two months 2% IA8% NH8% NV8% In the general →
  7. John McEnteemarkets 3% · not in the polls yet 2%
  8. Glenn Youngkin Glenn Youngkinmarkets 2% · not in the polls yet 2%
  9. Thomas Massie Thomas Massiemarkets 2% · not in the polls yet 2%
  10. Brian Kemp Brian Kempmarkets 2% · not in the polls yet 1%

Also in the polls: Robert F. Kennedy Jr. 2%, Nikki Haley 2% · their chances on the Republican forecast

The national primary polls since February 2025
2026Donald Trump Jr.Ron DeSantisMarco RubioJD Vance33 Vance30 Rubio11 DeSantis6 Trump

The Republican forecast →

Who represents you, locally

7,190 members of 99 state legislative chambers; 675 are less than 70% likely to keep their seats.

Or your city's mayor · 2028 statewide offices

Next elections

Seats, now and projected

NowProjected
Democratic3,4173,391
Republican3,6443,912
Chambers, Democratic4546
Chambers, Republican4852

Added up across every body; each is projected at its own next election.

2028 / the polls are rarely right

If the polls miss like a past election

Each row moves every 2028 race by the average miss of that year's statewide polls, presidential years and midterms alike, the same misses we replay on every forecast on the site. Bars: the Democratic chance; a line marks 50%.

PresidentSenateHouseGovernors
Our projection 66%289 EV 56 Dcontrol 99% 224 Dmajority 58% 32 Dof 50 after 2028
If the polls miss like 2026every race D+3.1 85%319 EV 58 Dcontrol >99% 238 Dmajority 75% 33 Dof 50 after 2028
If the polls miss like 2024every race R+2.3 47%268 EV 55 Dcontrol 98% 215 Dmajority 44% 31 Dof 50 after 2028
If the polls miss like 2022every race R+1.1 57%279 EV 56 Dcontrol 99% 220 Dmajority 51% 31 Dof 50 after 2028
If the polls miss like 2020every race R+6.9 16%226 EV 54 Dcontrol 92% 195 Dmajority 20% 30 Dof 50 after 2028
If the polls miss like 2018every race D+0.1 64%288 EV 56 Dcontrol 99% 224 Dmajority 58% 32 Dof 50 after 2028
If the polls miss like 2016every race R+3.9 34%252 EV 55 Dcontrol 97% 208 Dmajority 36% 31 Dof 50 after 2028
If the polls miss like 2014every race R+3.3 41%261 EV 55 Dcontrol 98% 211 Dmajority 40% 31 Dof 50 after 2028
If the polls miss like 2012every race D+2.4 80%311 EV 57 Dcontrol >99% 234 Dmajority 70% 32 Dof 50 after 2028
If the polls miss like 2010every race D+1.7 76%303 EV 57 Dcontrol >99% 231 Dmajority 67% 32 Dof 50 after 2028
If the polls miss like 2008every race R+1.1 58%280 EV 56 Dcontrol 99% 219 Dmajority 52% 31 Dof 50 after 2028
If the polls miss like 2006every race D+0.8 71%298 EV 57 Dcontrol >99% 227 Dmajority 63% 32 Dof 50 after 2028
If the polls miss like 2004every race R+0.3 63%286 EV 56 Dcontrol 99% 223 Dmajority 57% 32 Dof 50 after 2028
If the polls miss like 2002every race R+3.5 38%257 EV 55 Dcontrol 96% 208 Dmajority 36% 31 Dof 50 after 2028

Early projection, based on early and incomplete polling Misses: the average error of the final statewide polls in each election year since 2002, positive where they overstated the Democrats.

2026 midtermsThe Democrats won the House and the Senate. The results, how our forecast did and our election-night blog are kept as the record.

The results →How we did →The election-night blog →

Only on Polling Forecast

What you won't find anywhere else

2028 · President · run your own match-up

Who wins 2028? Pick any two candidates

Early projection, based on early and incomplete polling · 717 days to go

Gavin NewsomDemocratGavin Newsom
Chance of winning
70%
Electoral votes
295
Popular vote
51.8%
RepublicanJD VanceJD Vance
Chance of winning
29%
Electoral votes
243
Popular vote
48.2%

80% range: 236–356 for the Democrat270 to win

Popular vote: share of the two-party vote.

From the president's approval and every head-to-head poll, with each named candidate's measured pull on top. The ranges are wide because the evidence is thin. The map and the tipping-point states follow your pick.

You picked a generic Democrat v Donald Trump*: Democratic chance 50%, national vote D+0.0. The figures above are the generic contest.

* The 22nd Amendment bars anyone elected president twice from being elected again. Included only because pollsters ask about him; this is not a view that he can run.

Safe D 177 Likely D 49 Leans D 60 Toss-up 33 Leans R 1 Likely R 112 Safe R 106

The states that decide it: where the 270th electoral vote falls

  1. Pennsylvania 19 EV · Leans D16%
  2. Georgia 16 EV · Leans D13%
  3. North Carolina 16 EV · Toss-up13%
  4. Michigan 15 EV · Leans D12%
  5. Wisconsin 10 EV · Leans D7%
  6. Arizona 11 EV · Toss-up7%
  7. Minnesota 10 EV · Likely D4%
  8. Ohio 17 EV · Likely R4%

Open this match-up, and add running mates → · The 2028 election map: every state and county →

Raw and adjusted

Every race poll shown as published and as we adjust it: 725 of 1402 move by 2 points or more

52%of race polls move 2 points or more once adjusted 561 are partisan or internal polls; every one carries its source grade and the reason for the change. See every poll →
If the polls miss again in 2028

Replay each past presidential year's polling miss and the House majority swings from 20% to 75%

Like 202675% Like 202444% Like 202251% Like 202020% Our early projection gives the Democrats a 58% chance of the House and 56 Senate seats; the Senate barely moves, the House and the White House do. See every miss →
Pollster openness

Marquette University tops our grades; 20 of 542 graded pollsters publish enough for 20 openness points

Marquette UniversityA · 84 Survey 160A · 82 High Point UniversityA · 80 Graded on their final polls at past elections and on what they publish: question wording, weighting, sample, tables. See every grade →
Backtests, misses included

Run blind on 2018, 2022, 2024, the model called 1204 of 1284 races; we list the 80 it got wrong

94%of races called right, run blind Each past cycle forecast without its result, with every race the model would have missed named on the page. See every race we called →
Analysis

What the polls are saying

Analysis · 4 Nov

We called Congress for the Democrats hours before the networks. Here is how the night went, and what we got wrong

The Democrats won the Senate and the House on a national vote 11 points their way. Our night forecast called both chambers at 8:37 pm Eastern, about two hours before the networks called the House and three before the Senate. A look back at the result and at our live blog, misses included.
Analysis · 20 Nov

Three House races head to recounts as the count winds down

Democrats lead North Carolina's 5th and Minnesota's 1st by about 300 votes each; a Republican leads North Carolina's 10th by more than 2,500.
Analysis · 20 Nov

How we read a partial count: one county can move the whole map

A fifth of the vote counted in one Texas county says something about every race in the country. Here is how we work out how much.
Analysis · 11 Nov

Did the polls blow the midterms? They missed one way, by more than usual, but not by a record

We checked every final poll in the Senate and governor races against the results. The polls underrated Democrats almost everywhere, and the firms that looked best in 2024 did worst this year.
Analysis · 11 Nov

A week on, Mississippi and Alaska are still counting, and the seats they decide last until 2033

Democrats already control the next Senate. The two races still out will not change that, but they decide how big a cushion the party carries into a 2028 map where it has to defend Arizona, Georgia, Nevada and Pennsylvania.
Analysis · 9 Nov

The polls got the midterms wrong again, but this time the Democrats were the ones they missed

In 57 Senate and governor races the final polls understated the Democrats by three points, the first miss in that direction since 2012 and the largest in that direction on our record. Here is where they went wrong, which pollsters held up, what it did to our own forecast, and what it changes for 2028.

Every article →

Dig deeper

The polls, the track record and the method