
How we read a partial count: one county can move the whole map
A fifth of the vote counted in one Texas county says something about every race in the country. Here is how we work out how much.
 Polling Forecast
2 min read
data as of 6 November
Written in house from our poll data and our forecast.
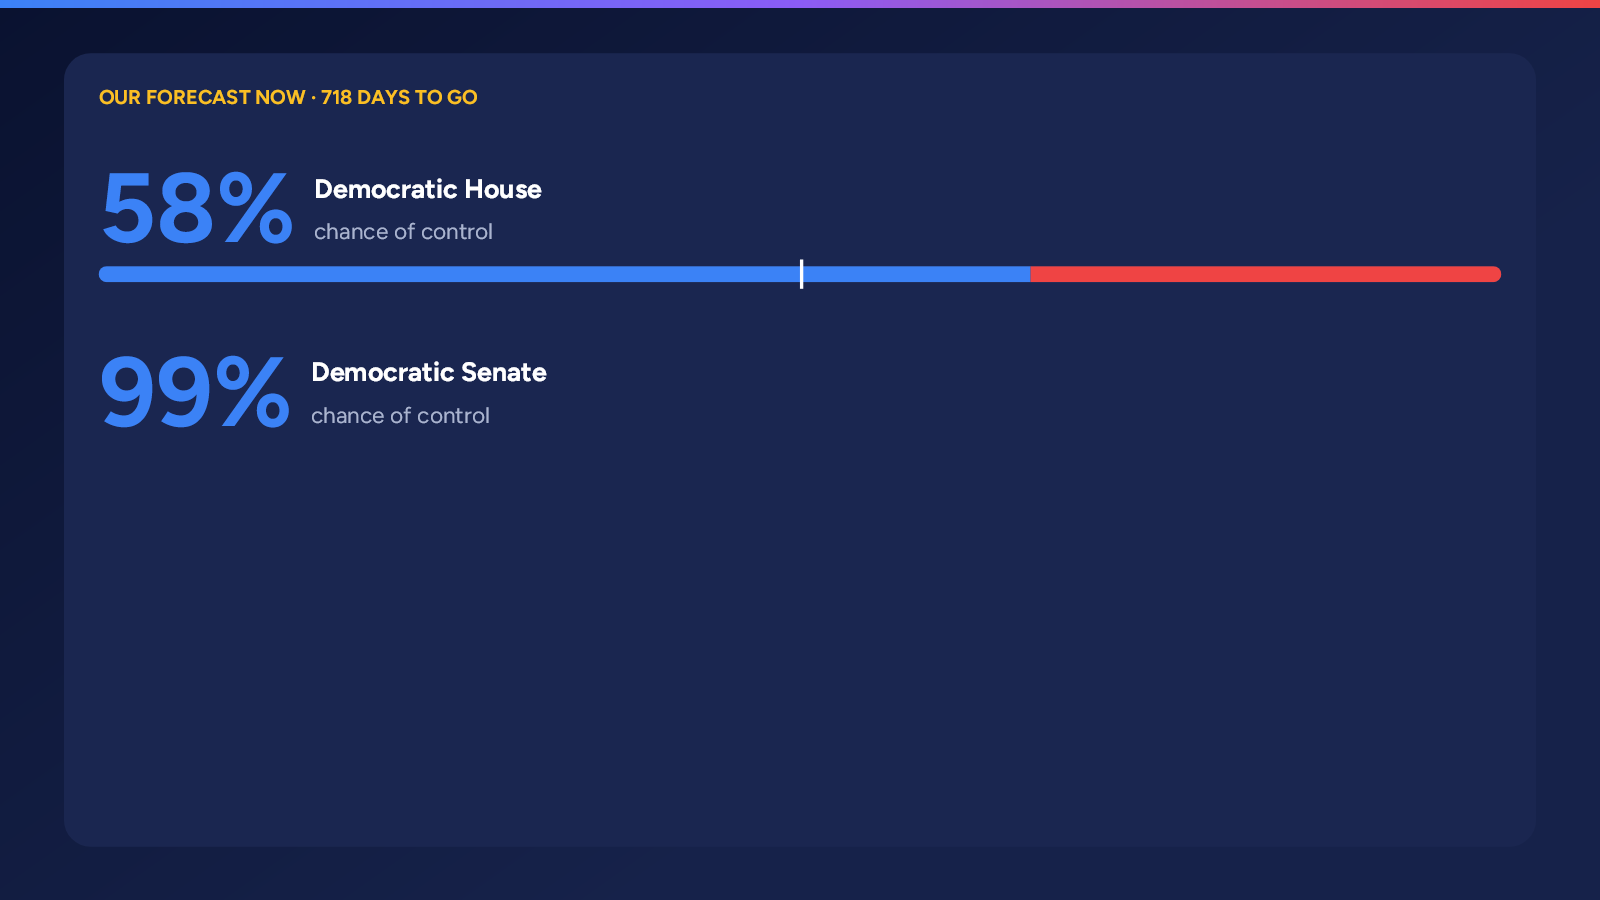
On election night the first numbers are never a fair sample. One county reports before its neighbours; mail ballots are counted before election-day votes; the cities often come last. Reading a partial count as if it were the result is how commentators talk themselves into wrong calls.
We read it differently. Every count is compared with what we expected in that place, and the gap is treated as a piece of evidence about how our forecast might be wrong.
What can be wrong
Our forecast already knows the ways it can miss. Its simulation draws, every run, a national polling miss, a miss for each of the nine census divisions, one for each state, and three that follow the make-up of the electorate: places with more white non-Hispanic voters, more graduates, or more Hispanic voters can all move together.
A county's count is a noisy reading of a mix of those misses. Harris County in Texas reads on the national miss, on the West South Central division, on Texas, and, because 44% of its people are Hispanic and a third have a degree, strongly on the Hispanic and graduate factors.
How much a reading counts
Three things make a partial count less reliable than it looks:
- the county's own quirks: a local candidate, a local issue;
- the order of the count: early and mail votes lean differently from election-day votes, and that skew fades as the count completes;
- a thin count: a few thousand votes say little.
We put a size on each and weight the reading accordingly. Where we know which kind of vote has been counted, we compare it with that kind of vote in 2024, which takes most of the count-order skew out.
What one county does
We then work out, from all the readings together, how big each kind of miss is likely to be. A county coming in 3 points worse for the Democrats than expected, at a fifth counted, moves Texas most, then the places most like Harris (Hispanic districts in Texas and Florida), and the rest of the country a little. House districts that take in part of the county also pick up some of the county's own swing, in proportion to how many of their people live there.
Several readings that agree add up. Readings that disagree cancel, and one far out of line with the rest is given less weight, so one mismatched count cannot swing the country.
Testing it
There are no archived night-time counts to test against, so we replay the 2024 presidential count: each county starts from its 2020 margin moved by a forecast that misses by a typical amount, counties report at their own pace, and where we hold the votes by method each county counts its mail first. At 30%, 50%, 70% and 90% counted we project every state's final margin and compare it with the real one.
Polling Forecast reads every poll in ten countries, corrects for how pollsters have missed before, and turns them into seats. Our forecasts, the polls and our methods are free to explore.
Elsewhere on Polling Forecast
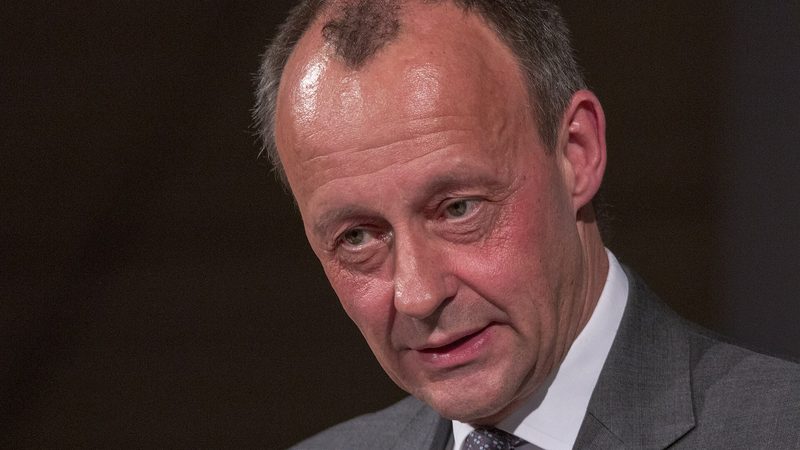 Merz and the SPD agree an electricity tax cut overnight
The cut is funded for 2027 only, with the budget vote due next week; our forecast leaves the Union and SPD 65 seats short of a majority.
 Abascal claims three big parties as Vox holds 67 seats
Vox is on 19.1% and 67 seats in our projection, double its 2023 total, and Feijóo would need its votes to govern.
 Jetten's cabinet survives four days of crisis talks with the VVD
D66, the VVD and the CDA will carry on together, but our forecast gives the three parties 43 seats, far short of the 76 needed.