The House in 2028
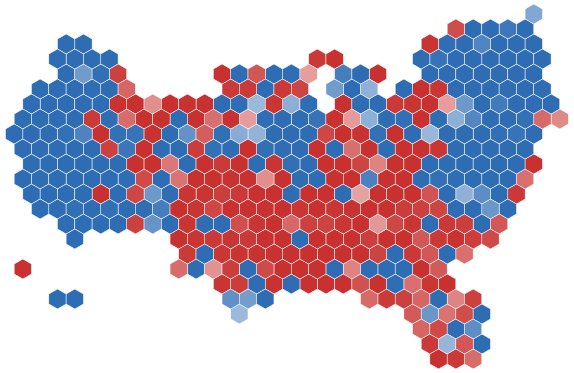
All 435 seats on the lines of 2026. Democratic majority in 58% of simulations; 224 Democratic seats on average, 80% range 190-260. National House vote, two-party: 51.2–48.8.
The district model now includes the 2026 House results: 410 contested districts alongside 2022 and 2024. 332 of them are still being counted, so their results are our projection of the final count, as is the national House vote. It is refitted as counts finish, and again once the states certify their results; we do not expect certification to change it much.
2028 / the polls are rarely right
If the polls miss like a past election
Each row moves every 2028 race by the average miss of that year's statewide polls, presidential years and midterms alike, the same misses we replay on every forecast on the site. Bars: the Democratic chance; a line marks 50%.
Early projection, based on early and incomplete polling Misses: the average error of the final statewide polls in each election year since 2002, positive where they overstated the Democrats.
Color: the Democratic chance in the early projection.
The 30 closest districts
Bar: the Democratic chance in the early projection. Colour: the favourite; purple where neither side is above 60%. Each district's 2026 winner runs as the incumbent where the result is settled.
Figures as of . Published by Polling Forecast.