Governors: 29 Democrats, 21 Republicans after the election in our projection
Changing hands in our projection: the Democrats would gain Alaska, Georgia, Iowa, Nevada, Ohio and Vermont.
36 states elect a governor on 3 November (New Hampshire and Vermont every two years). 6 Democratic and 8 Republican governors are not up. Governors win by more than their state's presidential lean suggests more often than senators do: our fundamentals give the lean less weight and the incumbent more, and the polls count for more.
29 Democrats 21 Republicans governors after the election, the middle of our simulated elections
- 25-32 Democratic governors, 80% range
- 30 if every race goes to whoever leads it
- 3 toss-ups
- 6 seats change party
- 536 polls in the averages
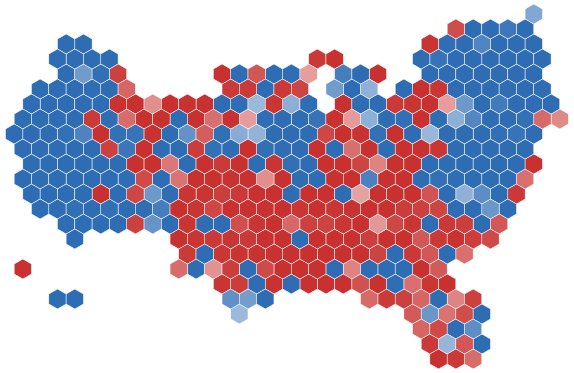
The governor races on the map
Each state shows the leader's chance of winning in our simulations; the deeper the colour, the safer the seat. Gray: no governor's race this year. Hover or tap a state for the candidates and our projected vote; click to open the race.
Every governor, from the safest Democratic to the safest Republican
The deciding seat now: Alaska governor (Leans D · D+2.8 · 69% Democrat).
How to read this
All 50 governors after the election: the 14 not up this year are pale; the 36 races are ordered by our projected margin. The outlined seat is the 26th from either end.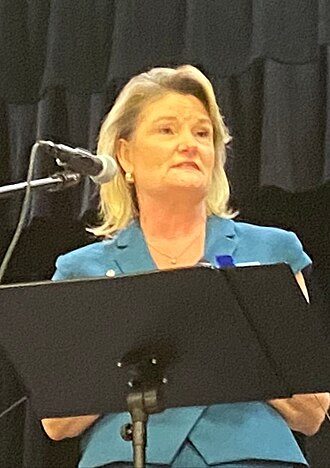 Cindy Holscher 49.6% of the vote · polls 49.4% 51%
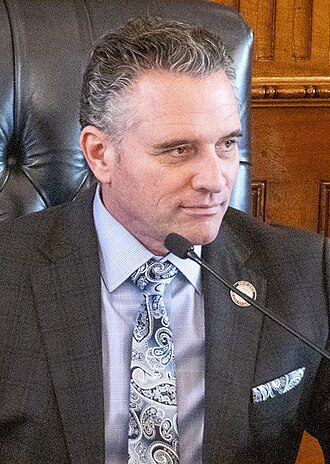 Ty Masterson 49.6% of the vote · polls 49.1% 49%
Projection Even · 14 polls · lean R+15.8
Nevada
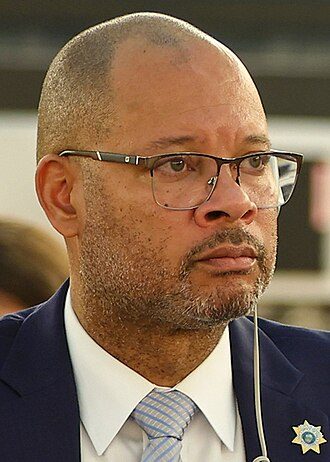 Aaron Ford 49.4% of the vote · polls 48.9% 57%
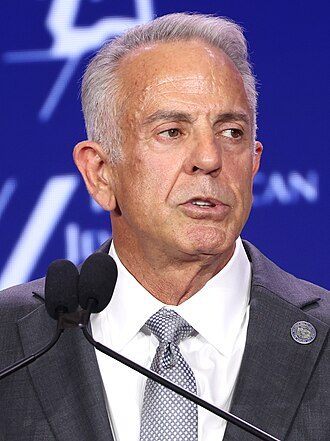 Joe Lombardo * 48.3% of the vote · polls 47.0% 43%
Projection D+1.1 · 13 polls · lean R+1.7
Vermont
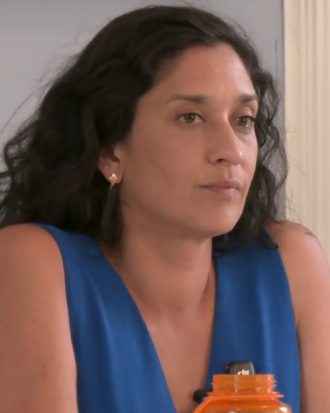 Amanda Janoo 50.0% of the vote · polls 48.5% 58%
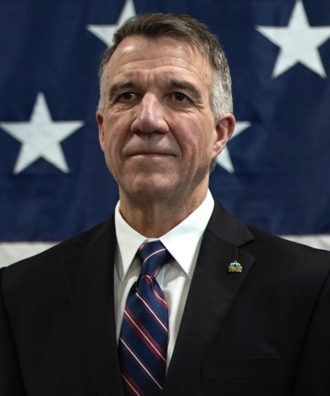 Phil Scott * 48.7% of the vote · polls 49.2% 42%
Projection D+1.4 · 7 polls · lean D+32.5
Georgia
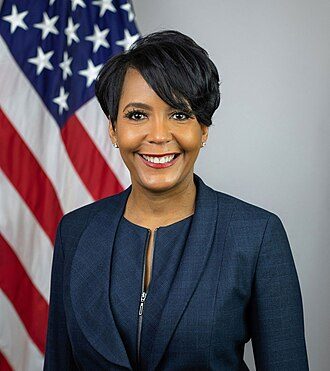 Keisha Lance Bottoms 50.8% of the vote · polls 49.7% 62%
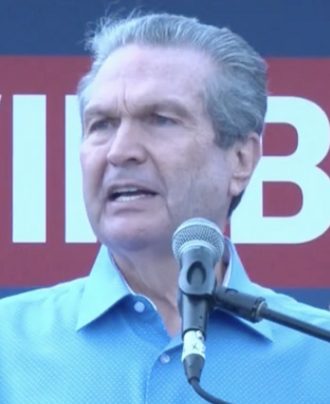 Rick Jackson 49.0% of the vote · polls 50.0% 38%
Projection D+1.8 · 21 polls · lean R+1.6
Texas
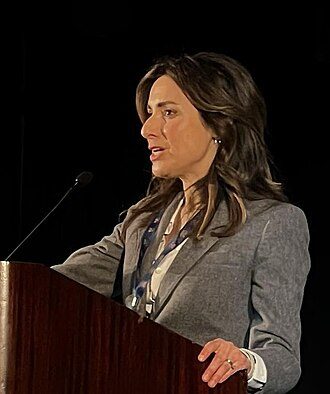 Gina Hinojosa 48.2% of the vote · polls 48.1% 35%
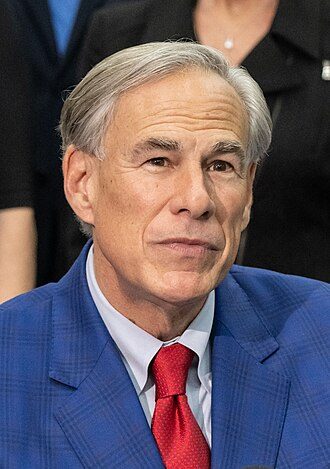 Greg Abbott * 50.8% of the vote · polls 50.2% 65%
Projection R+2.6 · 63 polls · lean R+11.7
Florida
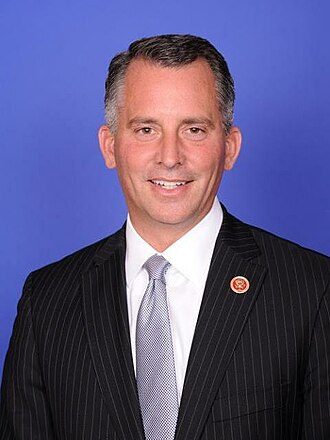 David Jolly 48.0% of the vote · polls 46.9% 32%
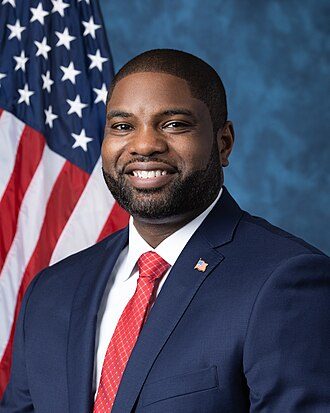 Byron Donalds 50.9% of the vote · polls 51.1% 68%
Projection R+2.9 · 39 polls · lean R+10.7
Alaska
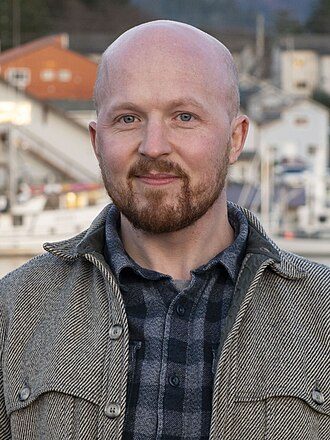 Jonathan Kreiss-Tomkins 51.2% of the vote · polls 50.8% 69%
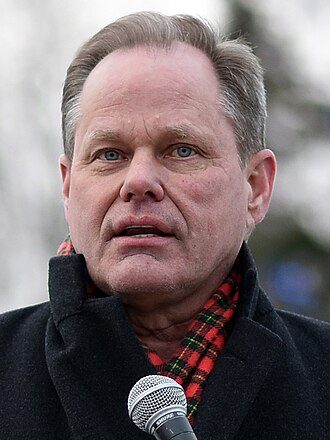 Dave Bronson 48.4% of the vote · polls 48.6% 31%
Projection D+2.8 · 10 polls · lean R+12.4
Ohio
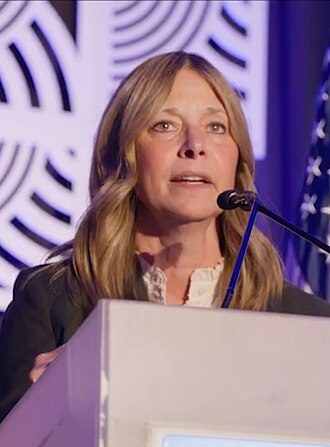 Amy Acton 51.2% of the vote · polls 50.5% 75%
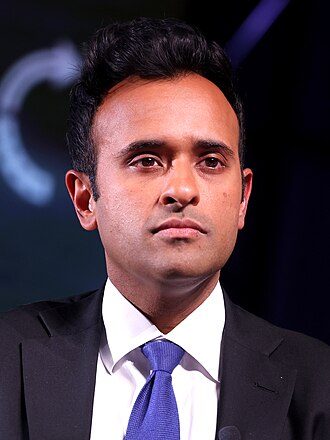 Vivek Ramaswamy 47.1% of the vote · polls 46.6% 25%
Projection D+4.1 · 36 polls · lean R+10.4
New Hampshire
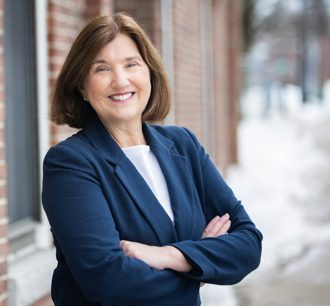 Cinde Warmington 46.5% of the vote · polls 45.0% 20%
 Kelly Ayotte * 52.1% of the vote · polls 52.5% 80%
Projection R+5.6 · 18 polls · lean D+3.9
Wyoming
Kenneth Casner 41.2% of the vote 15%
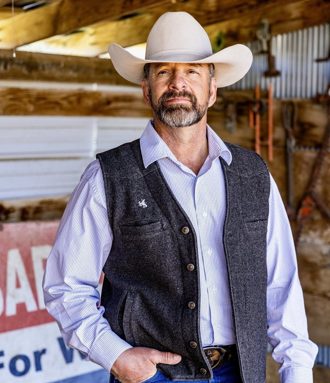 Eric Barlow 56.1% of the vote 85%
Projection R+14.9 · no polls · lean R+45.2
New Mexico
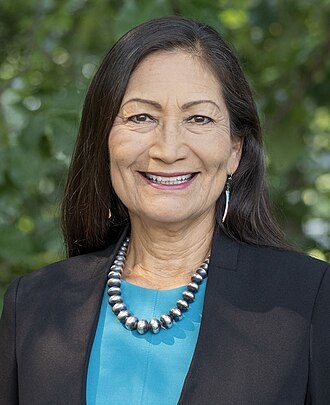 Deb Haaland 54.1% of the vote · polls 53.7% 85%
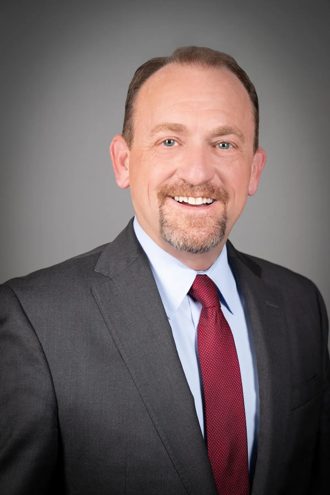 Gregg Hull 45.9% of the vote · polls 46.2% 15%
Projection D+8.2 · 6 polls · lean D+7.2
Wisconsin
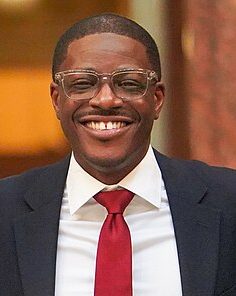 David Crowley 53.1% of the vote · polls 52.2% 85%
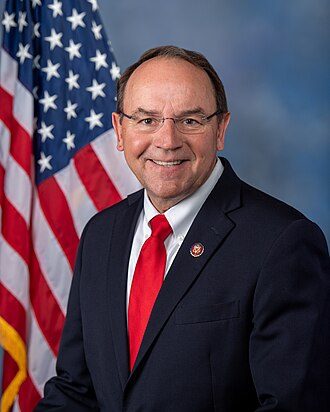 Tom Tiffany 46.8% of the vote · polls 47.7% 15%
Projection D+6.3 · 12 polls · lean R+0.5
Oklahoma
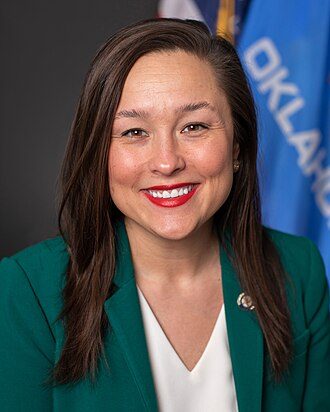 Cyndi Munson 45.8% of the vote · polls 45.4% 13%
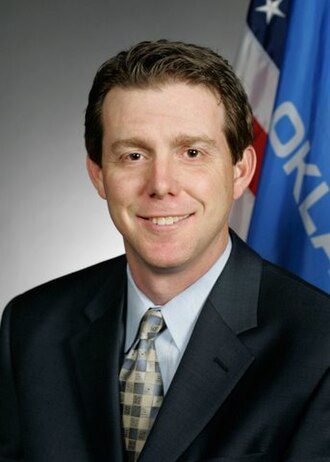 Mike Mazzei 52.2% of the vote · polls 51.2% 87%
Projection R+6.4 · 3 polls · lean R+34.0
Nebraska
Lynne Walz 44.8% of the vote · polls 44.1% 11%
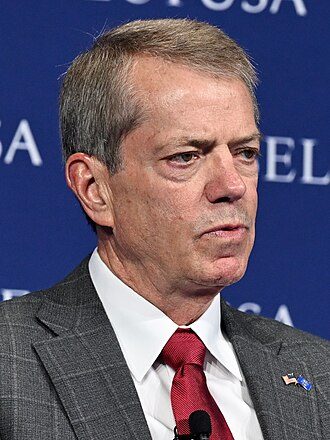 Jim Pillen * 51.7% of the vote · polls 49.8% 89%
Projection R+6.9 · 15 polls · lean R+20.1
Oregon
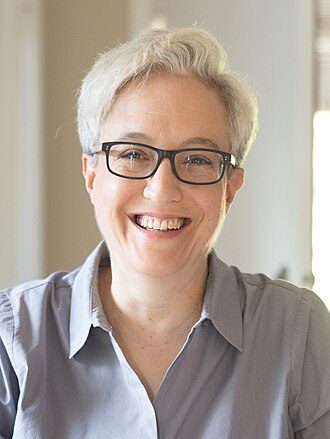 Tina Kotek * 52.2% of the vote · polls 48.6% 90%
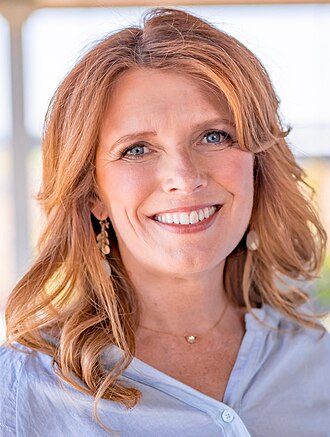 Christine Drazan 45.0% of the vote · polls 46.5% 10%
Projection D+7.3 · 6 polls · lean D+14.7
Iowa
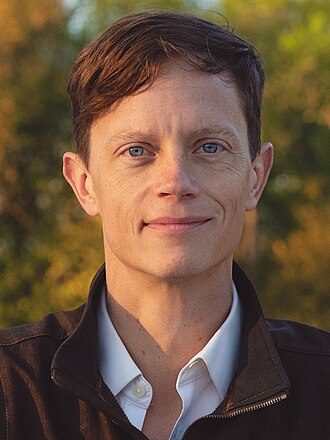 Rob Sand 53.9% of the vote · polls 53.4% 92%
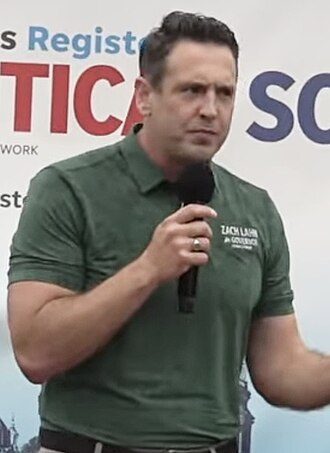 Zach Lahn 45.6% of the vote · polls 45.7% 8%
Projection D+8.3 · 26 polls · lean R+12.0
Alabama
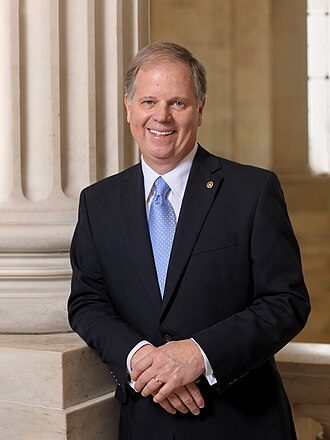 Doug Jones 45.6% of the vote · polls 44.9% 7%
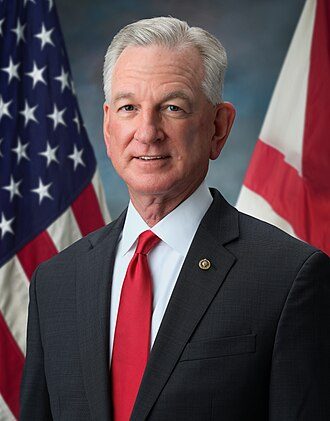 Tommy Tuberville 54.4% of the vote · polls 55.1% 93%
Projection R+8.8 · 5 polls · lean R+29.2
Michigan
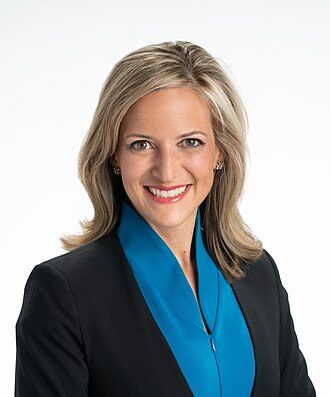 Jocelyn Benson 54.0% of the vote · polls 53.5% 94%
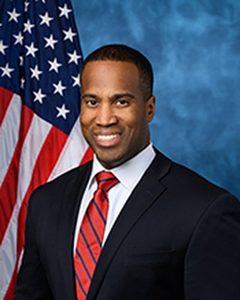 John James 44.8% of the vote · polls 44.5% 6%
Projection D+9.2 · 45 polls · lean R+0.4
South Carolina
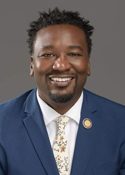 Jermaine Johnson 44.8% of the vote · polls 43.2% 5%
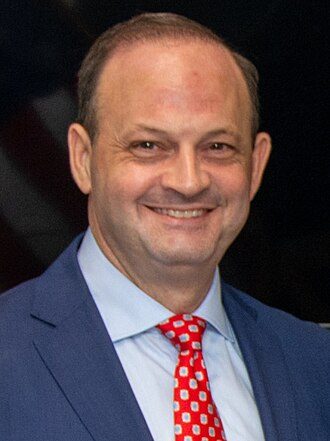 Alan Wilson 54.3% of the vote · polls 55.2% 95%
Projection R+9.5 · 9 polls · lean R+16.3
Arizona
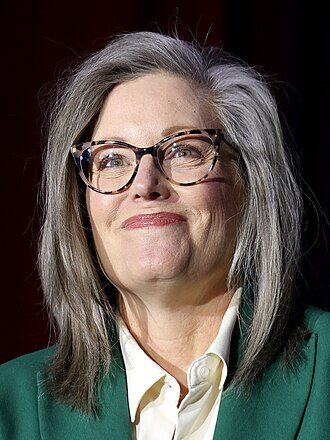 Katie Hobbs * 54.6% of the vote · polls 52.7% 95%
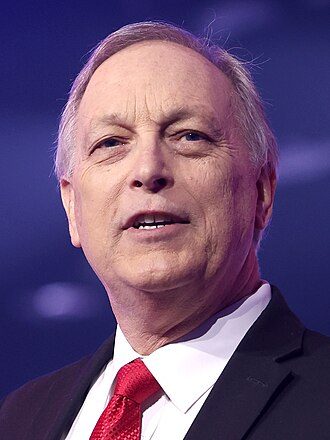 Andy Biggs 44.0% of the vote · polls 44.8% 5%
Projection D+10.6 · 25 polls · lean R+4.1
Maine
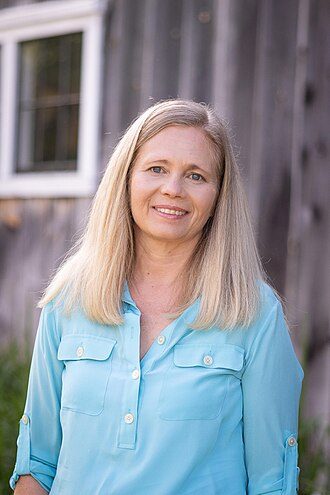 Hannah Pingree 53.6% of the vote · polls 51.9% 96%
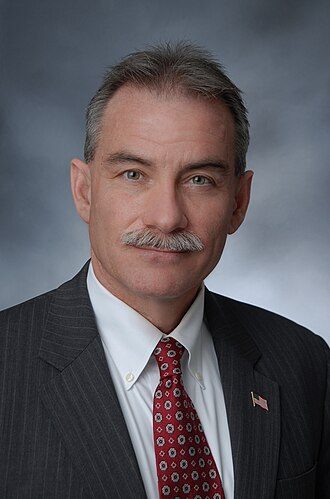 Robert B. Charles 42.6% of the vote · polls 41.5% 4%
Projection D+11.1 · 26 polls · lean D+7.5
Tennessee
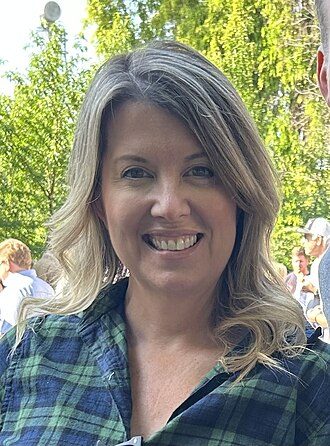 Jerri Green 38.9% of the vote · polls 34.2% 4%
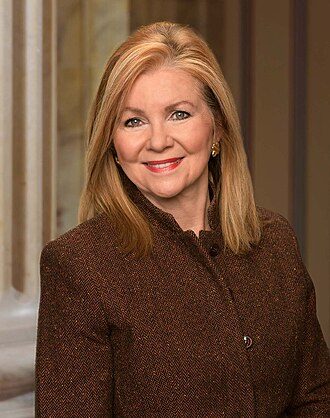 Marsha Blackburn 49.2% of the vote · polls 45.0% 96%
Projection R+10.2 · 6 polls · lean R+28.1
Hawaii
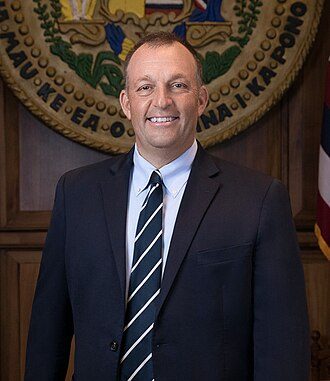 Josh Green * 62.2% of the vote 96%
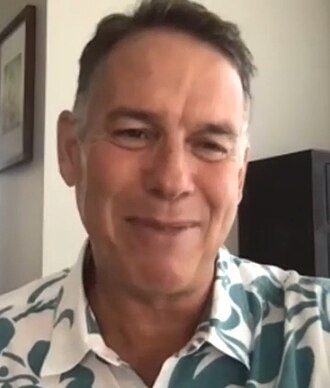 Gary Cordery 35.1% of the vote 4%
Projection D+27.1 · no polls · lean D+24.7
Minnesota
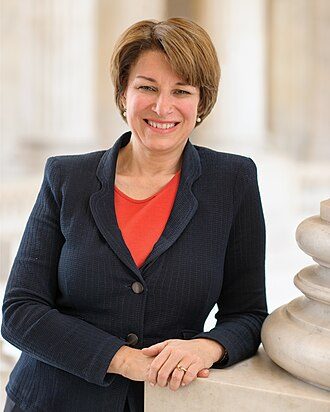 Amy Klobuchar 55.3% of the vote · polls 54.9% 98%
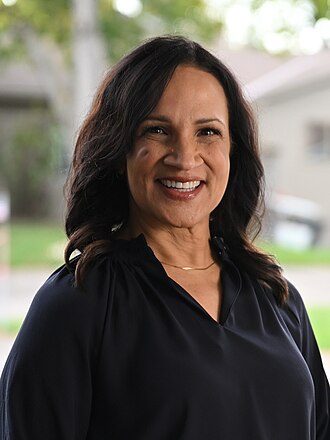 Lisa Demuth 43.6% of the vote · polls 43.2% 2%
Projection D+11.8 · 14 polls · lean D+4.9
New York
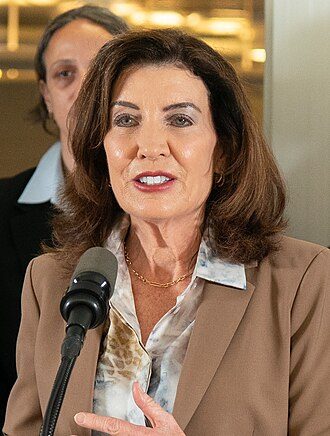 Kathy Hochul * 58.2% of the vote · polls 56.5% over 99%
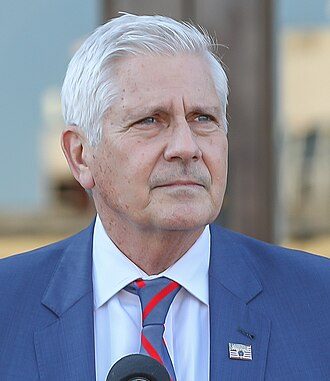 Bruce Blakeman 41.7% of the vote · polls 43.3% under 1%
Projection D+16.5 · 25 polls · lean D+15.2
Arkansas
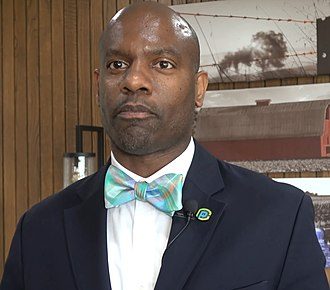 Fredrick Love 37.6% of the vote · polls 35.4% under 1%
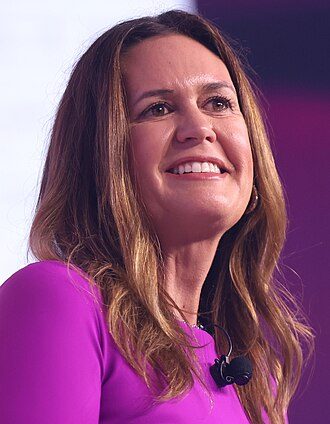 Sarah Huckabee Sanders * 56.0% of the vote · polls 53.5% over 99%
Projection R+18.4 · 2 polls · lean R+29.9
Colorado
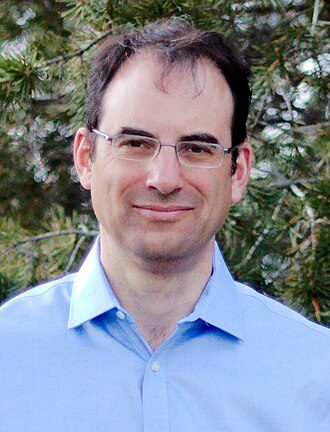 Phil Weiser 57.8% of the vote · polls 57.8% over 99%
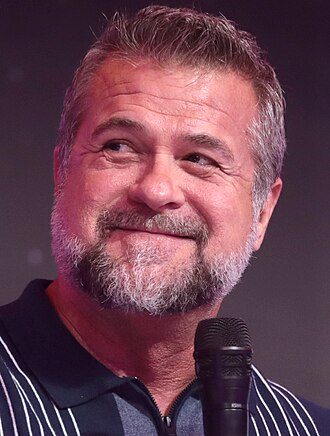 Victor Marx 39.9% of the vote · polls 38.0% under 1%
Projection D+17.9 · 4 polls · lean D+11.6
South Dakota
 Dan Ahlers 40.8% of the vote · polls 40.3% under 1%
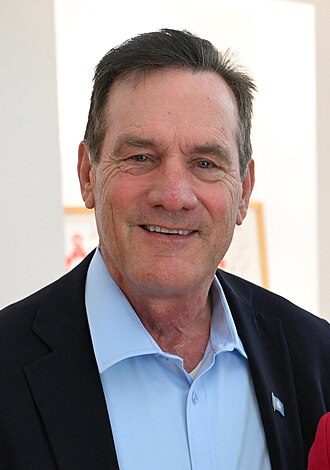 Larry Rhoden * 58.9% of the vote · polls 59.2% over 99%
Projection R+18.1 · 3 polls · lean R+28.4
California
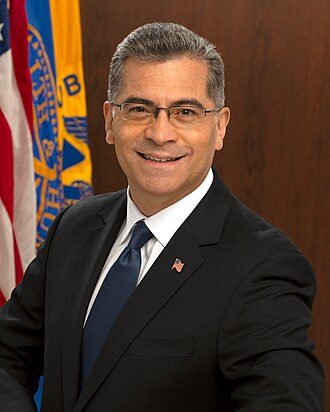 Xavier Becerra 62.4% of the vote · polls 61.6% over 99%
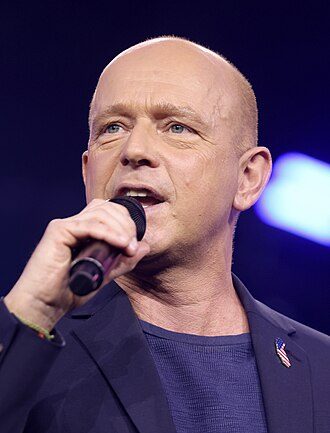 Steve Hilton 37.4% of the vote · polls 37.9% under 1%
Projection D+25.0 · 21 polls · lean D+22.4
Idaho
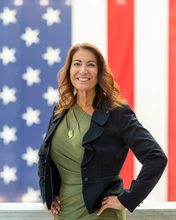 Terri Pickens 35.5% of the vote · polls 32.5% under 1%
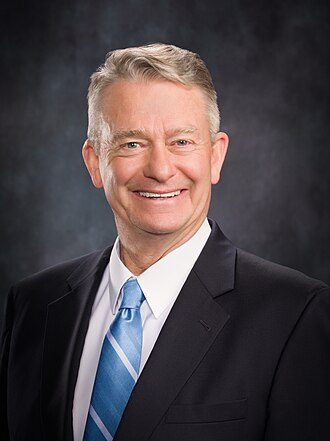 Brad Little * 55.4% of the vote · polls 51.7% over 99%
Projection R+19.9 · 3 polls · lean R+35.1
Illinois
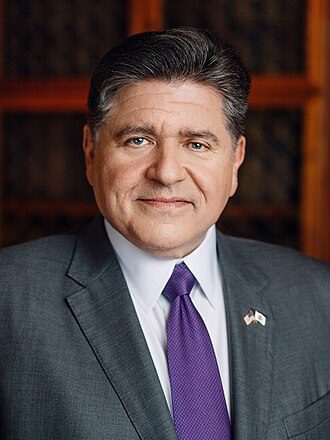 JB Pritzker * 60.1% of the vote · polls 59.5% over 99%
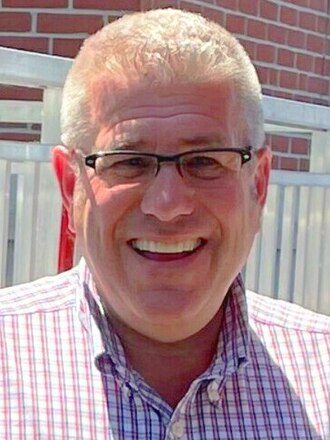 Darren Bailey 39.3% of the vote · polls 39.6% under 1%
Projection D+20.8 · 4 polls · lean D+12.4
Connecticut
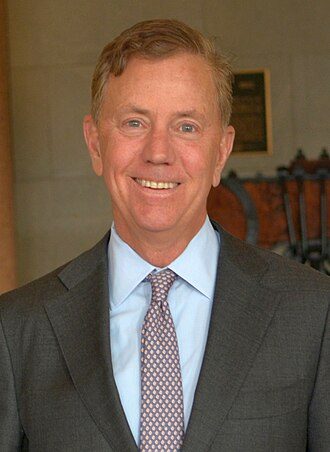 Ned Lamont * 60.6% of the vote · polls 59.0% over 99%
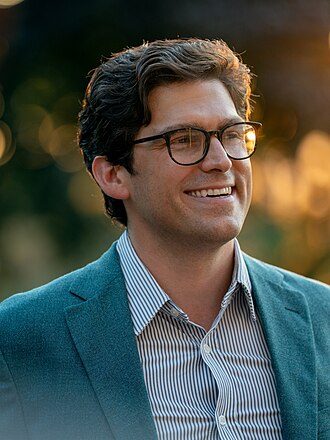 Ryan Fazio 39.0% of the vote · polls 40.4% 0%
Projection D+21.6 · 13 polls · lean D+15.9
Massachusetts
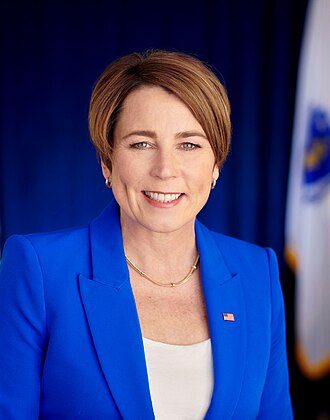 Maura Healey * 62.2% of the vote · polls 59.8% over 99%
 Mike Minogue 35.0% of the vote · polls 35.3% 0%
Projection D+27.2 · 12 polls · lean D+27.3
Maryland
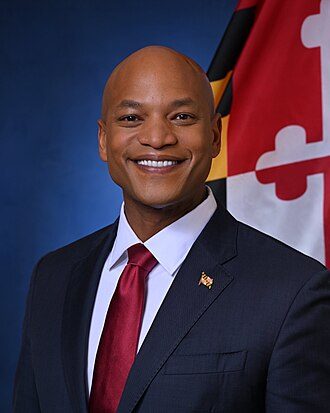 Wes Moore * 63.5% of the vote · polls 59.8% over 99%
 Dan Cox 30.0% of the vote · polls 28.7% 0%
Projection D+33.5 · 2 polls · lean D+29.7
Pennsylvania
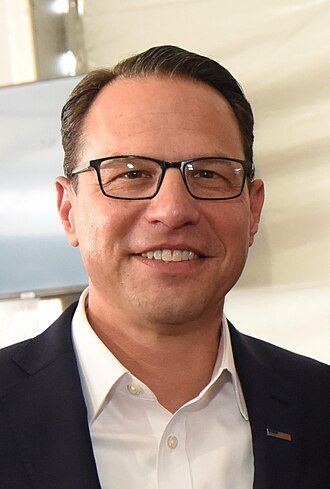 Josh Shapiro * 62.4% of the vote · polls 61.9% over 99%
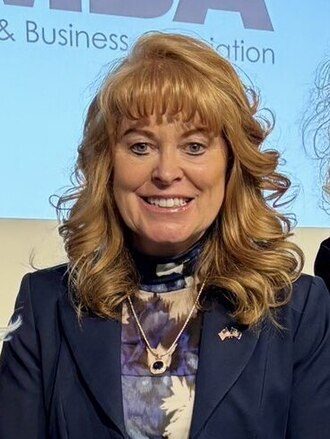 Stacy Garrity 36.8% of the vote · polls 36.7% 0%
Projection D+25.7 · 19 polls · lean R+1.0
Rhode Island
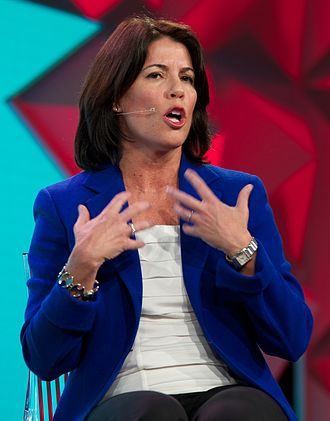 Helena Foulkes 56.7% of the vote · polls 50.0% over 99%
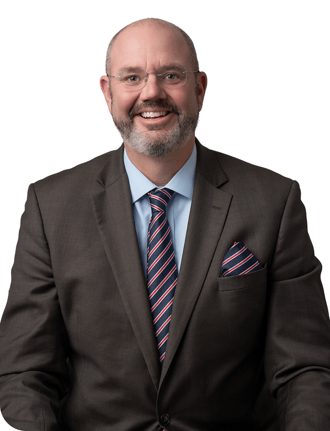 Aaron Guckian 23.3% of the vote · polls 14.9% 0%
Projection D+33.5 · 9 polls · lean D+15.5
* incumbent. Ordered from the closest race. The chance is the share of our simulations each candidate wins; "of the vote" is our forecast of each candidate's share of the vote; "polls" is the same polls as published, with undecided voters left out. Ours differs because we allow for each pollster's usual lean and for how far polls have missed before, blend in the fundamentals, and expect third parties to fall short of their polls, as they usually do.
States with no race this year are gray. Hover for detail, click for the race.
| State | Left | Republican | Held by | Lean | Fundamentals | Polls | On polls | Our bet | Vote: ours | Vote: polls | Chance |
|---|---|---|---|---|---|---|---|---|---|---|---|
| Alabama | Doug Jones (D) | Tommy Tuberville | R | R+29.2 | R+8.7 | R+8.8 5 | 87% | R+8.8 | 45.6–54.4 | 44.9–55.1 | 7% |
| Alaska | Jonathan Kreiss-Tomkins (D) | Dave Bronson | R | R+12.4 | R+2.2 | D+3.5 10 | 88% | D+2.8 | 51.2–48.4 | 50.8–48.6 | 69% |
| Arizona | Katie Hobbs (D) | Andy Biggs | D | R+4.1 | D+16.0 | D+9.9 25 | 90% | D+10.6 | 54.6–44.0 | 52.7–44.8 | 95% |
| Arkansas | Fredrick Love (D) | Sarah Huckabee Sanders | R | R+29.9 | R+24.1 | R+16.9 2 | 78% | R+18.4 | 37.6–56.0 | 35.4–53.5 | under 1% |
| California | Xavier Becerra (D) | Steve Hilton | D | D+22.4 | D+11.2 | D+26.6 21 | 90% | D+25.0 | 62.4–37.4 | 61.6–37.9 | over 99% |
| Colorado | Phil Weiser (D) | Victor Marx | D | D+11.6 | D+7.0 | D+19.5 4 | 87% | D+17.9 | 57.8–39.9 | 57.8–38.0 | over 99% |
| Connecticut | Ned Lamont (D) | Ryan Fazio | D | D+15.9 | D+23.7 | D+21.3 13 | 89% | D+21.6 | 60.6–39.0 | 59.0–40.4 | over 99% |
| Florida | David Jolly (D) | Byron Donalds | R | R+10.7 | R+1.6 | R+3.0 39 | 90% | R+2.9 | 48.0–50.9 | 46.9–51.1 | 32% |
| Georgia | Keisha Lance Bottoms (D) | Rick Jackson | R | R+1.6 | D+1.9 | D+1.8 21 | 90% | D+1.8 | 50.8–49.0 | 49.7–50.0 | 62% |
| Hawaii | Josh Green (D) | Gary Cordery | D | D+24.7 | D+27.1 | – 0 | 0% | D+27.1 | 62.2–35.1 | – | 96% |
| Idaho | Terri Pickens (D) | Brad Little | R | R+35.1 | R+26.1 | R+18.5 3 | 82% | R+19.9 | 35.5–55.4 | 32.5–51.7 | under 1% |
| Illinois | JB Pritzker (D) | Darren Bailey | D | D+12.4 | D+22.4 | D+20.6 4 | 86% | D+20.8 | 60.1–39.3 | 59.5–39.6 | over 99% |
| Iowa | Rob Sand (D) | Zach Lahn | R | R+12.0 | R+2.1 | D+9.5 26 | 90% | D+8.3 | 53.9–45.6 | 53.4–45.7 | 92% |
| Kansas | Cindy Holscher (D) | Ty Masterson | D | R+15.8 | R+3.5 | D+0.5 14 | 89% | Even | 49.6–49.6 | 49.4–49.1 | 51% |
| Maine | Hannah Pingree (D) | Robert B. Charles | D | D+7.5 | D+5.4 | D+11.7 26 | 90% | D+11.1 | 53.6–42.6 | 51.9–41.5 | 96% |
| Maryland | Wes Moore (D) | Dan Cox | D | D+29.7 | D+29.0 | D+34.6 2 | 79% | D+33.5 | 63.5–30.0 | 59.8–28.7 | over 99% |
| Massachusetts | Maura Healey (D) | Mike Minogue | D | D+27.3 | D+28.1 | D+27.1 12 | 87% | D+27.2 | 62.2–35.0 | 59.8–35.3 | over 99% |
| Michigan | Jocelyn Benson (D) | John James | D | R+0.4 | D+2.4 | D+10.0 45 | 90% | D+9.2 | 54.0–44.8 | 53.5–44.5 | 94% |
| Minnesota | Amy Klobuchar (D) | Lisa Demuth | D | D+4.9 | D+4.4 | D+12.7 14 | 89% | D+11.8 | 55.3–43.6 | 54.9–43.2 | 98% |
| Nebraska | Lynne Walz (D) | Jim Pillen | R | R+20.1 | R+20.3 | R+5.2 15 | 89% | R+6.9 | 44.8–51.7 | 44.1–49.8 | 11% |
| Nevada | Aaron Ford (D) | Joe Lombardo | R | R+1.7 | R+13.2 | D+3.1 13 | 88% | D+1.1 | 49.4–48.3 | 48.9–47.0 | 57% |
| New Hampshire | Cinde Warmington (D) | Kelly Ayotte | R | D+3.9 | R+11.0 | R+4.9 18 | 89% | R+5.6 | 46.5–52.1 | 45.0–52.5 | 20% |
| New Mexico | Deb Haaland (D) | Gregg Hull | D | D+7.2 | D+5.3 | D+8.7 6 | 86% | D+8.2 | 54.1–45.9 | 53.7–46.2 | 85% |
| New York | Kathy Hochul (D) | Bruce Blakeman | D | D+15.2 | D+23.5 | D+15.7 25 | 90% | D+16.5 | 58.2–41.7 | 56.5–43.3 | over 99% |
| Ohio | Amy Acton (D) | Vivek Ramaswamy | R | R+10.4 | R+1.5 | D+4.7 36 | 90% | D+4.1 | 51.2–47.1 | 50.5–46.6 | 75% |
| Oklahoma | Cyndi Munson (D) | Mike Mazzei | R | R+34.0 | R+10.6 | R+5.6 3 | 84% | R+6.4 | 45.8–52.2 | 45.4–51.2 | 13% |
| Oregon | Tina Kotek (D) | Christine Drazan | D | D+14.7 | D+23.3 | D+4.0 6 | 83% | D+7.3 | 52.2–45.0 | 48.6–46.5 | 90% |
| Pennsylvania | Josh Shapiro (D) | Stacy Garrity | D | R+1.0 | D+17.2 | D+26.7 19 | 89% | D+25.7 | 62.4–36.8 | 61.9–36.7 | over 99% |
| Rhode Island | Helena Foulkes (D) | Aaron Guckian | D | D+15.5 | D+8.5 | D+38.0 9 | 85% | D+33.5 | 56.7–23.3 | 50.0–14.9 | over 99% |
| South Carolina | Jermaine Johnson (D) | Alan Wilson | R | R+16.3 | R+3.8 | R+10.2 9 | 89% | R+9.5 | 44.8–54.3 | 43.2–55.2 | 5% |
| South Dakota | Dan Ahlers (D) | Larry Rhoden | R | R+28.4 | R+23.5 | R+17.2 3 | 85% | R+18.1 | 40.8–58.9 | 40.3–59.2 | under 1% |
| Tennessee | Jerri Green (D) | Marsha Blackburn | R | R+28.1 | R+8.3 | R+10.6 6 | 84% | R+10.2 | 38.9–49.2 | 34.2–45.0 | 4% |
| Texas | Gina Hinojosa (D) | Greg Abbott | R | R+11.7 | R+17.0 | R+1.1 63 | 91% | R+2.6 | 48.2–50.8 | 48.1–50.2 | 35% |
| Vermont | Amanda Janoo (D) | Phil Scott | R | D+32.5 | Even | D+1.7 7 | 82% | D+1.4 | 50.0–48.7 | 48.5–49.2 | 58% |
| Wisconsin | David Crowley (D) | Tom Tiffany | D | R+0.5 | D+2.3 | D+6.8 12 | 88% | D+6.3 | 53.1–46.8 | 52.2–47.7 | 85% |
| Wyoming | Kenneth Casner (D) | Eric Barlow | R | R+45.2 | R+14.9 | – 0 | 0% | R+14.9 | 41.2–56.1 | – | 15% |
Left: the Democratic nominee, or the independent who is the Republican's main opponent (Nebraska, Idaho, South Dakota). Lean: the state's presidential margin against the nation (three parts 2024, one part 2020). On polls: the weight the polls get against the fundamentals. Vote: each side's share of the vote, left first; ours, and the polls as published (undecided voters left out).
Photo credits
2 official portraits from the Biographical Directory of the United States Congress (US government work, public domain): John James, Kelly Ayotte.
- Aaron Ford: Photo: United States Mission to Geneva, United States Department of State, Public domain, via Wikimedia Commons (https://commons.wikimedia.org/wiki/File:Nevada_Attorney_General_Aaron_Ford_addresses_the_United_Nations_Human_Rights_Committee,_October_17-18,_2023_1_(cropped).jpg)
- Aaron Guckian: Photo: Aaron Guckian for Governor
- Alan Wilson: Photo: U.S. House of Representatives, Public domain, via Wikimedia Commons (https://commons.wikimedia.org/wiki/File:Alan_Wilson_in_August_2025.jpg)
- Amanda Janoo: Photo: Town Meeting TV, CC BY 4.0, via Wikimedia Commons (https://commons.wikimedia.org/wiki/File:Amanda_Janoo_at_candidate_forum_in_May_2026_(cropped).png)
- Amy Acton: Photo: Patricio101, CC0, via Wikimedia Commons (https://commons.wikimedia.org/wiki/File:Amy_Acton_2025.jpg)
- Amy Klobuchar: Photo: United States Senate, Public domain, via Wikimedia Commons (https://commons.wikimedia.org/wiki/File:Amy_Klobuchar,_official_portrait,_113th_Congress.jpg)
- Andy Biggs: Photo: Gage Skidmore, CC BY-SA 4.0, via Wikimedia Commons (https://commons.wikimedia.org/wiki/File:Andy_Biggs_2025.jpg)
- Brad Little: Photo: Phil White/Office of the Governor of Idaho., CC BY-SA 4.0, via Wikimedia Commons (https://commons.wikimedia.org/wiki/File:Brad_Little_official_photo.jpg)
- Bruce Blakeman: Photo: Arthur Raslich, CC BY-SA 4.0, via Wikimedia Commons (https://commons.wikimedia.org/wiki/File:Blakeman_Profile_Picture.jpg)
- Byron Donalds: Photo: United States Congress, Public domain, via Wikimedia Commons (https://commons.wikimedia.org/wiki/File:Rep._Byron_Donalds_official_photo,_117th_Congress.jpg)
- Christine Drazan: Photo: Oregon State University, CC BY-SA 2.0, via Wikimedia Commons (https://commons.wikimedia.org/wiki/File:Christine_Drazan_in_August_2022_(cropped).jpg)
- Cinde Warmington: Photo: Cinde Warmington for Governor
- Cindy Holscher: Photo: Mtcat101, CC BY 4.0, via Wikimedia Commons (https://commons.wikimedia.org/wiki/File:Cindy_Holscher_2026_in_Manhattan_(cropped).jpg)
- Cyndi Munson: Photo: Unknown authorUnknown author, Public domain, via Wikimedia Commons (https://commons.wikimedia.org/wiki/File:Cyndi_Munson.jpg)
- Dan Ahlers: Photo: Ahlers for Governor
- Dan Cox: Photo: MDGovpics, CC BY 2.0, via Wikimedia Commons (https://commons.wikimedia.org/wiki/File:Dan_Cox_Mar2020_(49617550556).jpg)
- Darren Bailey: Photo: Cobiblair, CC BY-SA 4.0, via Wikimedia Commons (https://commons.wikimedia.org/wiki/File:Darren_Bailey_at_a_2022_Campaign_Event_(cropped2).jpg)
- Dave Bronson: Photo: The Alaska Landmine from Anchorage, USA, CC BY 2.0, via Wikimedia Commons (https://commons.wikimedia.org/wiki/File:Dave_Bronson_March_2022.jpg)
- David Crowley: Photo: LaShawnda Jones, CC BY-SA 4.0, via Wikimedia Commons (https://commons.wikimedia.org/wiki/File:David_Crowley,_Milwaukee_County_Executive_and_WI_gubernatorial_candidate,_February_26,_2026.jpg)
- David Jolly: Photo: unknown author, Public domain, via Wikimedia Commons (https://commons.wikimedia.org/wiki/File:David_Jolly_(3x4).jpg)
- Deb Haaland: Photo: Department of the Interior, Public domain, via Wikimedia Commons (https://commons.wikimedia.org/wiki/File:Secretary_Deb_Haaland,_official_headshot.jpg)
- Doug Jones: Photo: U.S. Senate Photographic Studio-Renee Bouchard, Public domain, via Wikimedia Commons (https://commons.wikimedia.org/wiki/File:Senator_Doug_Jones_official_photo_(1).jpg)
- Eric Barlow: Photo: Barlow for Wyoming Governor
- Fredrick Love: Photo: Arkansas Farm Bureau, CC BY 3.0, via Wikimedia Commons (https://commons.wikimedia.org/wiki/File:Rep_Fredrick_J_Love.jpg)
- Gary Cordery: Photo: ThinkTech Hawaii, CC BY 3.0, via Wikimedia Commons (https://commons.wikimedia.org/wiki/File:Gary_Cordery_Hawaii.jpg)
- Gina Hinojosa: Photo: RRC1701, CC0, via Wikimedia Commons (https://commons.wikimedia.org/wiki/File:Gina_Hinojosa_at_the_AFL-CIO_COPE_convention_in_2024.jpg)
- Greg Abbott: Photo: NASA Johnson Space Center / NASA-JSC/ROBERT MARKOWITZ, Public domain, via Wikimedia Commons (https://commons.wikimedia.org/wiki/File:Greg_Abbott_at_NASA_2024_(cropped).jpg)
- Gregg Hull: Photo: Gregg Hull for Governor
- Hannah Pingree: Photo: Hannah Pingree for Governor, CC BY 4.0, via Wikimedia Commons (https://commons.wikimedia.org/wiki/File:Headshot_of_Hannah_Pingree_in_February_2026.jpg)
- Helena Foulkes: Photo: Digitas Photos, CC BY 2.0, via Wikimedia Commons (https://commons.wikimedia.org/wiki/File:HelenaFoulkes_CROP.jpg)
- JB Pritzker: Photo: Oscar Garza, CC BY-SA 4.0, via Wikimedia Commons (https://commons.wikimedia.org/wiki/File:JB_Pritzker_2026_(less_cropped).jpg)
- Jermaine Johnson: Photo: South Carolina House of Representatives
- Jerri Green: Photo: Zach Kinslow, CC BY 4.0, via Wikimedia Commons (https://commons.wikimedia.org/wiki/File:Jerri_Green_(cropped).3_(cropped).jpg)
- Jim Pillen: Photo: Maryland GovPics, CC BY 4.0, via Wikimedia Commons (https://commons.wikimedia.org/wiki/File:Jim_Pillen_SelectUSA_(55251574792).jpg)
- Jocelyn Benson: Photo: JFM Photo 73, CC BY 4.0, via Wikimedia Commons (https://commons.wikimedia.org/wiki/File:SOS_Jocelyn_Benson_web.jpg)
- Joe Lombardo: Photo: Gage Skidmore, CC BY-SA 4.0, via Wikimedia Commons (https://commons.wikimedia.org/wiki/File:Joe_Lombardo_(55512849370)(cropped).jpg)
- Jonathan Kreiss-Tomkins: Photo: Unknown authorUnknown author, CC BY-SA 4.0, via Wikimedia Commons (https://commons.wikimedia.org/wiki/File:JKTphoto_(cropped).jpg)
- Josh Green: Photo: Aloha102, CC BY-SA 4.0, via Wikimedia Commons (https://commons.wikimedia.org/wiki/File:Josh_Green_Official_Photo_2022_(cropped)_1cropped).jpg)
- Josh Shapiro: Photo: Maryland GovPics, CC BY 2.0, via Wikimedia Commons (https://commons.wikimedia.org/wiki/File:Gov._Shapiro.jpg)
- Kathy Hochul: Photo: Metropolitan Transportation Authority, CC BY 4.0, via Wikimedia Commons (https://commons.wikimedia.org/wiki/File:World_Cup_Transportation_and_Safety_(cropped).jpg)
- Katie Hobbs: Photo: Gage Skidmore from Surprise, AZ, United States of America, CC BY-SA 4.0, via Wikimedia Commons (https://commons.wikimedia.org/wiki/File:Katie_Hobbs_2026.jpg)
- Keisha Lance Bottoms: Photo: Executive Office of the President of the United States, Public domain, via Wikimedia Commons (https://commons.wikimedia.org/wiki/File:Keisha_Lance_Bottoms.jpg)
- Larry Rhoden: Photo: U.S. Embassy Jerusalem, CC BY 2.0, via Wikimedia Commons (https://commons.wikimedia.org/wiki/File:Larry_Rhoden_2025_(cropped).jpg)
- Lisa Demuth: Photo: Lisa Demuth for Governor, CC0, via Wikimedia Commons (https://commons.wikimedia.org/wiki/File:Lisa_Demuth,_2026_(cropped).jpg)
- Marsha Blackburn: Photo: United States Senate Photographic Studio, Public domain, via Wikimedia Commons (https://commons.wikimedia.org/wiki/File:Sen._Marsha_Blackburn_(R-TN)_official_headshot_-_116th_Congress.jpg)
- Maura Healey: Photo: Governors office, Public domain, via Wikimedia Commons (https://commons.wikimedia.org/wiki/File:Maura_Healey,_official_portrait,_governor.jpg)
- Mike Mazzei: Photo: Oklahoma State Senate, Public domain, via Wikimedia Commons (https://commons.wikimedia.org/wiki/File:Mike_Mazzei_OK_Senate_Headshot.jpg)
- Mike Minogue: Photo: Mike Minogue for Governor
- Ned Lamont: Photo: The Office of Governor Ned Lamont, CC BY-SA 4.0, via Wikimedia Commons (https://commons.wikimedia.org/wiki/File:Governor_Ned_Lamont_of_Connecticut,_official_portrait.jpg)
- Phil Scott: Photo: Master Sgt. Sarah Mattison, U.S. Air National Guard, Public domain, via Wikimedia Commons (https://commons.wikimedia.org/wiki/File:Phil_Scott_2019.png)
- Phil Weiser: Photo: Phil Photos, Public domain, via Wikimedia Commons (https://commons.wikimedia.org/wiki/File:AG_Phil_Weiser.jpg)
- Rick Jackson: Photo: Cherie Martin, CC BY 4.0, via Wikimedia Commons (https://commons.wikimedia.org/wiki/File:Rick_Jackson_(cropped)_(cropped).png)
- Rob Sand: Photo: Rob Sand for Governor, CC0, via Wikimedia Commons (https://commons.wikimedia.org/wiki/File:Rob_Sand_campaign_headshot_(cropped_1).jpg)
- Robert B. Charles: Photo: Hoveros, CC BY-SA 4.0, via Wikimedia Commons (https://commons.wikimedia.org/wiki/File:Robert_Charles.jpg)
- Ryan Fazio: Photo: James Naleski, CC BY-SA 4.0, via Wikimedia Commons (https://commons.wikimedia.org/wiki/File:Ryan_Fazio,_2026_(3x4_headshot).jpg)
- Sarah Huckabee Sanders: Photo: Gage Skidmore, CC BY-SA 4.0, via Wikimedia Commons (https://commons.wikimedia.org/wiki/File:Governor_Sarah_Huckabee_Sanders_2026.jpg)
- Stacy Garrity: Photo: David H. McCormick, Public domain, via Wikimedia Commons (https://commons.wikimedia.org/wiki/File:Stacy_Garrity,_2025_(cropped).jpg)
- Steve Hilton: Photo: Gage Skidmore, CC BY 2.0, via Wikimedia Commons (https://commons.wikimedia.org/wiki/File:Steve_Hilton_(54233445987_crop).jpg)
- Terri Pickens: Photo: Terri Pickens, CC BY 4.0, via Wikimedia Commons (https://commons.wikimedia.org/wiki/File:Terri_Pickens_for_Idaho_2026,_3.png)
- Tina Kotek: Photo: Tony Miller, Public domain, via Wikimedia Commons (https://commons.wikimedia.org/wiki/File:Tina_Kotek_official_portrait_2021(3x4_cropped).jpg)
- Tom Tiffany: Photo: US House of Representatives, Public domain, via Wikimedia Commons (https://commons.wikimedia.org/wiki/File:Tom_Tiffany.jpg)
- Tommy Tuberville: Photo: United States Senate, Public domain, via Wikimedia Commons (https://commons.wikimedia.org/wiki/File:Sen._Tommy_Tuberville_Official_Portrait,_118th_Congress_(cropped).jpg)
- Ty Masterson: Photo: NicholasGian25, CC BY-SA 4.0, via Wikimedia Commons (https://commons.wikimedia.org/wiki/File:TY_mASTERSON_(cropped).jpg)
- Victor Marx: Photo: Gage Skidmore from Surprise, AZ, United States of America, CC BY-SA 2.0, via Wikimedia Commons (https://commons.wikimedia.org/wiki/File:Victor_Marx_(52125665777)_(cropped).jpg)
- Vivek Ramaswamy: Photo: Gage Skidmore, CC BY-SA 4.0, via Wikimedia Commons (https://commons.wikimedia.org/wiki/File:Vivek_Ramaswamy_(55241367373)_(cropped).jpg)
- Wes Moore: Photo: Maryland State Government, CC BY-SA 4.0, via Wikimedia Commons (https://commons.wikimedia.org/wiki/File:Wes_Moore_Official_Governor_Portrait.jpg)
- Xavier Becerra: Photo: United States Department of Health and Human Services, Public domain, via Wikimedia Commons (https://commons.wikimedia.org/wiki/File:HHS_Xavier_Becerra.jpg)
- Zach Lahn: Photo: Aunger67, CC0, via Wikimedia Commons (https://commons.wikimedia.org/wiki/File:Zach_Lahn_IA_State_Fair_2026.jog.jpg)
Figures as of . Published by Polling Forecast.