United States Presidential election7 Nov 2028in 716 days Senate D 99% House D 58% Calendar Track record Research
United States · Governors · Kansas · 3 November 2026

Kansas governor

Called: Cindy Holscher (Democrat) wins

Called by the AP on 12 November 2026. Unofficial until the state certifies. Our forecast before the count gave Cindy Holscher 51%; it is kept below for the record. Every result and call →

Holscher overtakes Masterson and wins 51% of our simulations

Forecast updated 22 Nov, 2:19 pm EST · latest poll of this race 1 Nov

Open seat: Laura Kelly (D) is term-limited. Our projection: Cindy Holscher by 0 points, winning in 51% of our simulations. Cindy Holscher is running ahead of the top of the ticket: the state went to Trump by 16.1 points in 2024. That is up 39 points in a month. Rating: Toss-up.

Democrat Cindy Holscher 49.6% expected share of the vote 80% range 46–53%
51 of 100 simulated elections go to HolscherEach square is one election night
Republican Ty Masterson 49.6% expected share of the vote 80% range 46–53%

The band runs from 25% to 75% of the vote: the dot is our forecast, the shaded part holds 80% of our simulations, the tick marks 50%. Others: about 0.9%.

How we got here

From the state's 2024 vote for president to our forecast, one step at a time.

R+30EvenD+30
2024 presidentthe state's vote for president
R+16.1
Fundamentalslean, national mood, incumbency
R+3.5
Polls14 polls, weighted
D+0.5
Our forecastthe two blended, with past poll misses allowed for
Even

What moves the average today

The polls that count most in our average of this race, and their share of its weight.

  1. 1 Nov · 2,038 LV · D+4.0, counted as D+5.3
  2. 1 Nov · 1,267 LV · D+1.0, counted as D+0.3
  3. 29 Oct · 2,092 LV · R+1.0, counted as R+1.6
  4. 26 Oct · 838 LV · R+5.3
  5. 26 Oct · 801 LV · D+6.1, counted as D+4.7

Counted: after the pollster's usual lean and the national trend since the poll. Every other poll together: 32%.

County map

Kansas governor by county

Our forecast spread over the counties: each county's 2024 vote for president moved by the race's swing from that result (D+16.1 on 2024).

Hamilton: R+50.1 in our forecast (2024 president R+66.3) McPherson: R+24.9 in our forecast (2024 president R+41.1) Gray: R+52.9 in our forecast (2024 president R+69.0) Pratt: R+35.3 in our forecast (2024 president R+51.4) Reno: R+18.4 in our forecast (2024 president R+34.5) Rice: R+40.5 in our forecast (2024 president R+56.7) Edwards: R+49.2 in our forecast (2024 president R+65.3) Stanton: R+47.4 in our forecast (2024 president R+63.6) Mitchell: R+49.4 in our forecast (2024 president R+65.6) Lincoln: R+49.1 in our forecast (2024 president R+65.2) Cloud: R+44.4 in our forecast (2024 president R+60.6) Ford: R+22.2 in our forecast (2024 president R+38.4) Greenwood: R+44.8 in our forecast (2024 president R+61.0) Lyon: D+1.5 in our forecast (2024 president R+14.7) Wilson: R+46.2 in our forecast (2024 president R+62.4) Sedgwick: D+2.3 in our forecast (2024 president R+13.8) Labette: R+22.1 in our forecast (2024 president R+38.2) Harper: R+47.9 in our forecast (2024 president R+64.0) Kingman: R+43.8 in our forecast (2024 president R+59.9) Jewell: R+59.7 in our forecast (2024 president R+75.9) Trego: R+54.9 in our forecast (2024 president R+71.0) Pawnee: R+35.4 in our forecast (2024 president R+51.5) Jackson: R+26.5 in our forecast (2024 president R+42.6) Bourbon: R+38.0 in our forecast (2024 president R+54.2) Sheridan: R+64.2 in our forecast (2024 president R+80.3) Ottawa: R+50.4 in our forecast (2024 president R+66.6) Neosho: R+32.0 in our forecast (2024 president R+48.1) Chase: R+34.6 in our forecast (2024 president R+50.8) Coffey: R+39.5 in our forecast (2024 president R+55.7) Elk: R+53.5 in our forecast (2024 president R+69.7) Cheyenne: R+52.7 in our forecast (2024 president R+68.8) Scott: R+58.6 in our forecast (2024 president R+74.7) Russell: R+45.2 in our forecast (2024 president R+61.3) Sherman: R+52.6 in our forecast (2024 president R+68.7) Gove: R+61.0 in our forecast (2024 president R+77.1) Norton: R+51.5 in our forecast (2024 president R+67.7) Franklin: R+24.0 in our forecast (2024 president R+40.1) Crawford: R+9.1 in our forecast (2024 president R+25.3) Wichita: R+57.5 in our forecast (2024 president R+73.6) Republic: R+49.6 in our forecast (2024 president R+65.7) Lane: R+54.8 in our forecast (2024 president R+70.9) Harvey: R+4.9 in our forecast (2024 president R+21.1) Pottawatomie: R+31.5 in our forecast (2024 president R+47.6) Sumner: R+33.9 in our forecast (2024 president R+50.1) Kearny: R+52.3 in our forecast (2024 president R+68.4) Comanche: R+52.2 in our forecast (2024 president R+68.3) Clark: R+56.6 in our forecast (2024 president R+72.8) Seward: R+22.8 in our forecast (2024 president R+39.0) Marshall: R+33.0 in our forecast (2024 president R+49.1) Wallace: R+68.6 in our forecast (2024 president R+84.8) Doniphan: R+47.4 in our forecast (2024 president R+63.5) Kiowa: R+55.2 in our forecast (2024 president R+71.4) Barber: R+56.0 in our forecast (2024 president R+72.2) Phillips: R+57.6 in our forecast (2024 president R+73.7) Haskell: R+48.3 in our forecast (2024 president R+64.5) Anderson: R+43.6 in our forecast (2024 president R+59.8) Shawnee: D+16.6 in our forecast (2024 president D+0.5) Geary: R+1.5 in our forecast (2024 president R+17.6) Hodgeman: R+54.4 in our forecast (2024 president R+70.5) Clay: R+39.4 in our forecast (2024 president R+55.5) Finney: R+18.6 in our forecast (2024 president R+34.7) Stevens: R+59.3 in our forecast (2024 president R+75.5) Marion: R+33.0 in our forecast (2024 president R+49.1) Meade: R+53.5 in our forecast (2024 president R+69.6) Woodson: R+45.2 in our forecast (2024 president R+61.3) Ellis: R+30.0 in our forecast (2024 president R+46.1) Jefferson: R+20.8 in our forecast (2024 president R+36.9) Washington: R+53.0 in our forecast (2024 president R+69.1) Miami: R+23.4 in our forecast (2024 president R+39.5) Rawlins: R+56.4 in our forecast (2024 president R+72.6) Morris: R+30.4 in our forecast (2024 president R+46.6) Saline: R+15.4 in our forecast (2024 president R+31.6) Nemaha: R+50.9 in our forecast (2024 president R+67.0) Cowley: R+24.2 in our forecast (2024 president R+40.3) Wyandotte: D+40.0 in our forecast (2024 president D+23.9) Leavenworth: R+6.6 in our forecast (2024 president R+22.8) Rush: R+49.3 in our forecast (2024 president R+65.4) Riley: D+17.9 in our forecast (2024 president D+1.8) Ellsworth: R+36.1 in our forecast (2024 president R+52.3) Grant: R+46.8 in our forecast (2024 president R+63.0) Chautauqua: R+55.1 in our forecast (2024 president R+71.3) Osage: R+31.9 in our forecast (2024 president R+48.0) Brown: R+31.8 in our forecast (2024 president R+47.9) Morton: R+57.3 in our forecast (2024 president R+73.4) Butler: R+25.0 in our forecast (2024 president R+41.2) Greeley: R+57.2 in our forecast (2024 president R+73.4) Johnson: D+24.6 in our forecast (2024 president D+8.5) Dickinson: R+38.8 in our forecast (2024 president R+55.0) Logan: R+55.5 in our forecast (2024 president R+71.6) Cherokee: R+36.8 in our forecast (2024 president R+52.9) Ness: R+62.8 in our forecast (2024 president R+78.9) Atchison: R+21.2 in our forecast (2024 president R+37.4) Linn: R+48.4 in our forecast (2024 president R+64.6) Allen: R+30.0 in our forecast (2024 president R+46.1) Barton: R+40.6 in our forecast (2024 president R+56.7) Stafford: R+47.9 in our forecast (2024 president R+64.0) Montgomery: R+34.9 in our forecast (2024 president R+51.1) Osborne: R+52.4 in our forecast (2024 president R+68.5) Rooks: R+55.1 in our forecast (2024 president R+71.2) Smith: R+52.4 in our forecast (2024 president R+68.5) Wabaunsee: R+32.7 in our forecast (2024 president R+48.8) Thomas: R+49.6 in our forecast (2024 president R+65.8) Decatur: R+52.9 in our forecast (2024 president R+69.0) Graham: R+49.5 in our forecast (2024 president R+65.7) Douglas: D+54.1 in our forecast (2024 president D+38.0)
More Dem.More Rep.Lighter areas have fewer voters per square mile
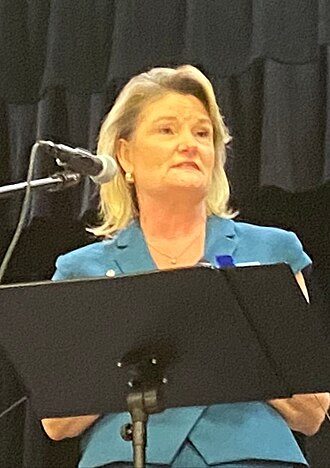
Cindy Holscher
Democrat
Cindy Holscher
51%
chance of winning
Republican
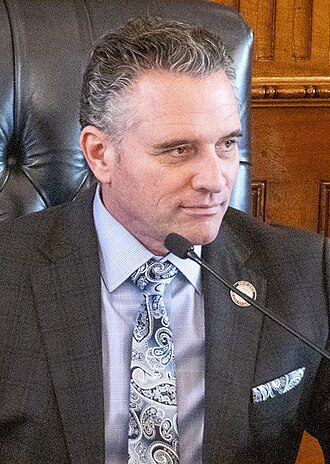
Ty Masterson
49%
chance of winning

Our projection Even; 80% of simulations between R+7.3 and D+7.3.

Share of the voteHolscherMastersonOthers
Our forecast49.6%49.6%0.9%
80% range46–5346–53
The polls49.4%49.1%1.5%

The polls, as published with undecided voters left out, have D+0.2. Allowing for each pollster's usual lean, the national trend since each poll and how far polls have missed before: D+0.5. Blended with the fundamentals (R+3.5, 11% of the weight): Even. Third parties tend to get less than they poll; we expect a little over half their polled share.

Cindy Holscher: Photo: Mtcat101, CC BY 4.0, via Wikimedia Commons (https://commons.wikimedia.org/wiki/File:Cindy_Holscher_2026_in_Manhattan_(cropped).jpg)

What if the polls are off?

This race is level in our projection: the smallest polling miss either way decides it.

Our projection: Cindy Holscher by 0.0 (Even).

If the polls miss like a past election

Each past election's average miss in the final Senate and governor polls, applied to this race. 8 of 12 would change the winner. The same rule moves every race at once on who wins Congress if the vote moves.

Our forecast over time

Our projection with the range holding 80% of simulations. A month ago: 13% for the Democrat (Likely R); now 51% (Toss-up). The shaded part is reconstructed from the polls published by then.

  • 2 Nov
    Leans R→Toss-up
    2 new polls in our average (Survey 160, AtlasIntel); poll average R+1.1 to D+0.5.
  • 30 Oct
    Likely R→Leans R
    2 new polls in our average (Emerson College, The Washington Post); poll average R+6.4 to R+2.9.
  • 19 Oct
    Leans R→Likely R
    poll average R+3.8 to R+5.8.
  • 15 Oct
    Likely R→Leans R
    poll average R+4.9 to R+4.2.
  • 13 Oct
    Leans R→Likely R
    poll average R+4.8 to R+5.5; national House vote D+7.0 to D+6.4.
  • 7 Oct
    Likely R→Leans R
    3 new polls in our average (YouGov, Siena College, Global Strategy Group); poll average R+5.6 to R+4.8; national House vote D+7.3 to D+7.0.

The polls over time

Each dot is one poll's margin on the decided vote as published (click for the poll); the line is a smoothed average (each day weighs the polls around it, and bigger polls more), with its 80% band; at the newest end it can only look back. Our average on the left adjusts each poll for its pollster's past lean; this chart does not.

Embed this race a small card for your own page
Feeds and embeds

How we get there

Presidential leanR+15.8 against the nation (2024: R+16.1; 2020: R+14.7)
National House voteD+7.5 (our reading of the generic ballot)
IncumbencyNo incumbent running
Fundamentals aloneR+3.5 ± 14.6
Poll averageD+0.5 ± 5.1 from 14 polls
Weight on the polls89%
Our projectionEven ± 4.8

Fundamentals: -1.3 + 0.39 × lean + 0.61 × national House margin + 14.5 for an incumbent, fitted on 355 governor races since 2000 (typical miss 14.0 points). The two are combined in inverse proportion to their measured errors. Method

The candidates

The governor now

  • Laura Kelly (Governor)
    Legislature: senate Republican 31–9, house Republican 88–37; trifecta: split

Who lives here

Total population (ACS estimate)2,947,197
White alone, not Hispanic or Latino72.7% (average of the states 65.5%)
Black or African American alone, not Hispanic5.2% (average of the states 10.0%)
Hispanic or Latino (any race)13.6% (average of the states 13.2%)
Asian alone, not Hispanic2.9% (average of the states 4.4%)
Bachelor's degree or higher, age 25+35.6% (average of the states 34.7%)
Median household income: published B19013 for unchanged districts, bracket estimate for new ones74,275
Population living in 2020 Census urban blocks72.3% (average of the states 72.4%)

US Census Bureau: American Community Survey 2020-2024 and the 2020 Census.

Money

Candidates for governor raise money under their state's law and report to the state, not to the Federal Election Commission, and the states publish it in different forms. We don't cover their fundraising yet. The state's election office: Kansas .

The polls in our average

  1. Sun 1 Nov 2026
  2. In our averageSiena CollegeHolscher +1

    736 LV · 1 Nov

    Cindy HolscherCindy HolscherDemocratic48
    Ty MastersonTy MastersonRepublican47
    +Otherothers0
    Cindy Holscher (D) 48 · Ty Masterson (R) 47 · Other (OTH) 0Holscher +1
    PublishedD+1.1AdjustedD+0.1 ↻National trendD+0.3Weight8%
  3. In our averageSurvey 160Holscher +1

    1,267 LV · 1 Nov

    Cindy HolscherCindy HolscherDemocratic49
    Ty MastersonTy MastersonRepublican48

    Others 2

    Cindy Holscher (D) 49 · Ty Masterson (R) 48 · Other (OTH) 2Holscher +1
    PublishedD+1.0AdjustedD+0.3 ↻National trendD+0.3Weight14%
  4. In our averageAtlasIntelHolscher +4

    2,038 LV · 1 Nov

    Cindy HolscherCindy HolscherDemocratic50
    Ty MastersonTy MastersonRepublican46

    Others 4

    Cindy Holscher (D) 50 · Ty Masterson (R) 46 · Other (OTH) 4Holscher +4
    PublishedD+4.0AdjustedD+5.3 ↻National trendD+0.3Weight23%
  5. Thu 29 Oct 2026
  6. In our averageYouGovMasterson +1

    2,092 LV · 29 Oct

    Ty MastersonTy MastersonRepublican50
    Cindy HolscherCindy HolscherDemocratic49
    +Otherothers0
    Ty Masterson (R) 50 · Cindy Holscher (D) 49 · Other (OTH) 0Masterson +1
    PublishedR+1.0AdjustedR+1.6 ↻National trendD+1.0Weight11%
  7. Wed 28 Oct 2026
  8. In our averageEmerson CollegeMasterson +4

    800 LV · 28 Oct

    Ty MastersonTy MastersonRepublican50
    Cindy HolscherCindy HolscherDemocratic46
    Ty Masterson (R) 50 · Cindy Holscher (D) 46Masterson +4
    PublishedR+4.2AdjustedR+2.7 ↻National trendD+1.2Weight9%
  9. Mon 26 Oct 2026
  10. In our averageCNN / SSRSMasterson +5

    838 LV · 26 Oct

    Ty MastersonTy MastersonRepublican50
    Cindy HolscherCindy HolscherDemocratic45
    Ty Masterson (R) 50 · Cindy Holscher (D) 45Masterson +5
    PublishedR+5.3AdjustedR+5.3 ↻National trendD+1.6Weight11%
  11. In our averageThe Washington PostHolscher +6

    801 LV · 26 Oct

    Cindy HolscherCindy HolscherDemocratic51
    Ty MastersonTy MastersonRepublican45

    Others 3

    Cindy Holscher (D) 51 · Ty Masterson (R) 45 · Other (OTH) 3Holscher +6
    PublishedD+6.1AdjustedD+4.7 ↻National trendD+1.6Weight10%
  12. Wed 21 Oct 2026
  13. In our averageGlobal Strategy GroupTied

    (D sponsor) · 600 LV · 21 Oct

    Cindy HolscherCindy HolscherDemocratic47
    Ty MastersonTy MastersonRepublican47
    Cindy Holscher (D) 47 · Ty Masterson (R) 47Tied
    PublishedEvenAdjustedR+2.8 ↻National trendD+2.2Weight2%
  14. Sun 4 Oct 2026
  15. In our averageYouGovMasterson +3

    2,255 LV · 4 Oct

    Ty MastersonTy MastersonRepublican47
    Cindy HolscherCindy HolscherDemocratic44
    Ty Masterson (R) 47 · Cindy Holscher (D) 44Masterson +3
    PublishedR+3.3AdjustedR+1.9 ↻National trendD+3.1Weight5%
  16. Wed 30 Sep 2026
  17. In our averageSiena CollegeMasterson +5

    605 LV · 30 Sep

    Ty MastersonTy MastersonRepublican49
    Cindy HolscherCindy HolscherDemocratic44
    Ty Masterson (R) 49 · Cindy Holscher (D) 44Masterson +5
    PublishedR+5.4AdjustedR+3.5 ↻National trendD+3.0Weight3%
  18. Wed 16 Sep 2026
  19. In our averageEmerson CollegeMasterson +7

    750 LV · 16 Sep

    Ty MastersonTy MastersonRepublican51
    Cindy HolscherCindy HolscherDemocratic44
    Ty Masterson (R) 51 · Cindy Holscher (D) 44Masterson +7
    PublishedR+7.4AdjustedR+4.2 ↻National trendD+2.9Weight2%
  20. In our averageGlobal Strategy GroupHolscher +3

    800 LV · 16 Sep

    Cindy HolscherCindy HolscherDemocratic49
    Ty MastersonTy MastersonRepublican46
    Cindy Holscher (D) 49 · Ty Masterson (R) 46Holscher +3
    PublishedD+3.2AdjustedD+3.6 ↻National trendD+2.9Weight2%
  21. Thu 10 Sep 2026
  22. In our averageco/efficientMasterson +8

    (R sponsor) · 915 LV · 10 Sep

    Ty MastersonTy MastersonRepublican51
    Cindy HolscherCindy HolscherDemocratic43
    Ty Masterson (R) 51 · Cindy Holscher (D) 43Masterson +8
    PublishedR+8.5AdjustedR+1.6 ↻National trendD+3.0Weight1%
  23. Sun 16 Aug 2026
  24. In our averageGlobal Strategy GroupHolscher +1

    (D sponsor) · 600 LV · 16 Aug

    Cindy HolscherCindy HolscherDemocratic47
    Ty MastersonTy MastersonRepublican46
    Cindy Holscher (D) 47 · Ty Masterson (R) 46Holscher +1
    PublishedD+1.1AdjustedR+0.1 ↻National trendD+3.8Weight0%

Margins on the decided vote. Adjusted: less the pollster's house effect at past final polls and, for a poll paid for by a campaign or party or from a pollster that mainly works for one, less the 2.5 points such polls have leaned to their side. ↻ Moved with the national trend: each poll is moved by how far the national generic ballot has moved since its fieldwork (our trend line through every generic-ballot poll, trackers included, now D+11.5); the "National trend" tag on each card shows its move. Weight: recency (30-day scale), sample, the pollster's record, halved for partisan polls, and a pollster's several polls sharing one pollster's weight.

Other polls of this race

  1. Mon 15 Jun 2026
  2. primary DChange Researchprimary DHolscher +27

    (D sponsor) · 1,022 LV · 15 Jun

    Cindy HolscherCindy HolscherDemocratic37
    Ethan CorsonDemocratic10
    Curt SkoogDemocratic7

    Others 2

    Cindy Holscher (D) 37 · Ethan Corson (D) 10 · Curt Skoog (D) 7 · Other (OTH) 2Holscher +27
  3. Fri 9 Jan 2026
  4. primary DPublic Policy Pollingprimary DHolscher +24

    (D sponsor) · 699 V · 9 Jan

    Cindy HolscherCindy HolscherDemocratic33
    Ethan CorsonDemocratic9
    Cindy Holscher (D) 33 · Ethan Corson (D) 9Holscher +24

Primaries, hypothetical matchups and earlier candidates.

Past results

YearWinnerRunner-upMargin
2022Laura Kelly (D) 49.5 Derek Schmidt (R) 47.3D+2.2
2018Laura Kelly (D) 48.0 Kris W. Kobach (R) 43.0D+5.1
2014Samuel Dale Brownback (R) 49.8 Paul Davis (D) 46.1R+3.7
2010Samuel Dale Brownback (R) 63.3 G. Thomas, Holland II (D) 32.2R+31.1
2006Kathleen Gilligan Sebelius (D) 57.9 James A. Barnett (R) 40.4D+17.5
2002Kathleen Sebelius (D) 52.9 Tim Shallenburger (R) 45.1D+7.8

‡ decided in a runoff. Sources: FEC and the Clerk of the House (House), MIT Election Data and Science Lab (Senate), J. Cha (governors).

Photo credits

Figures as of . Published by Polling Forecast.

You may also like