Who wins Congress if the vote moves?
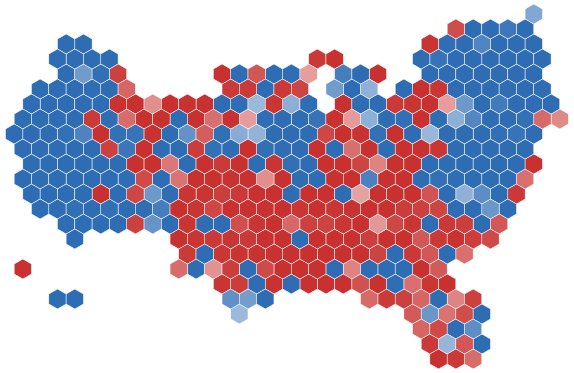
Our projection, based on 5,000 simulations, has the Democrats on 53.3% of the national House vote and the Republicans on 45.8%. Drag the sliders and every House seat and Senate race on the maps changes with them.
House
Senate
Governors
Loading…
Point at a district (tap on a phone) to see it; click to open it.
Loading…
Grey: no race this year.
Democrat Republican Independent · paler = closer race · outlined = changes hands against our projection
Seats that change hands
Against our projection.
The closest races on these numbers
Set a Senate or governor race yourself
Each race's lead: D+ means the Democrat (or independent) is ahead, R+ the Republican. A race you set stays put when the national sliders move; × puts it back.
How it works: our projection puts each district and state where the polls, its 2024 and 2020 presidential vote and its incumbent put it (method). A change in the national vote moves every contested race by the same number of points, so a seat flips when the swing passes its margin. A past miss moves every race by that cycle's average error in the final Senate and governor polls. Uncontested seats don't move. Build your own map race by race on make your map.
If we're wrong
Every race moved by the average statewide polling miss of a past election since 2000 (Senate, governor and presidential races together). Red notes: the polls overstated the Democrats that year; blue: the Republicans.
Democratic seats under each reading: blue the Democrats control the chamber, red the Republicans. 218 for the House, 51 for the Senate.
| Reading | House | Senate | Gov. |
|---|---|---|---|
| Our projectionthe forecast | 242 | 53 | 29 |
| Polls as they standraw, +1.4 | 249 | 54 | 30 |
| Like 2002overstated D by 3.5 | 226 | 51 | 25 |
| Like 2004polls about right | 241 | 53 | 28 |
| Like 2006overstated R by 0.8 | 246 | 53 | 29 |
| Like 2008overstated D by 1.1 | 237 | 52 | 27 |
| Like 2010overstated R by 1.7 | 251 | 54 | 30 |
| Like 2012overstated R by 2.4 | 256 | 55 | 31 |
| Like 2014overstated D by 3.3 | 227 | 51 | 26 |
| Like 2016overstated D by 3.9 | 224 | 50flips | 25 |
| Like 2018polls about right | 244 | 53 | 29 |
| Like 2020overstated D by 6.9 | 212flips | 48flips | 22 |
| Like 2022overstated D by 1.1 | 237 | 52 | 28 |
| Like 2024overstated D by 2.3 | 231 | 51 | 27 |
House control changes hands under 1 of 12 past misses; Senate control under 2.
Figures as of . Published by Polling Forecast.