How our 2028 presidential forecast works
We forecast a contest between a generic Democrat and a generic Republican, then put each named candidate on top as a small, shrinking adjustment. The national level comes from the governing party's record and from the polls, weighted by how well each has done at the same distance from past elections. It never starts from the last result.
Track record
Every presidential election from 2000 to 2024 forecast again without its own result, using only the polls and figures that existed at the time, at 24, 18, 12, 6 and 3 months out.
Every test in full is under Full test results at the bottom of the page.
1. The party baseline from fundamentals
We tried every input the published models use: the president's approval in June of the election year, whether the seat is open, how many terms the governing party has held, real disposable income, GDP growth, inflation, the change in unemployment and the midterm House result. An input was kept only if it cut the error on elections left out of the fit by at least 5%. Only approval survived, in both the 2000+ and the 1948+ fits. Low approval already explains why governing parties lose ground in open seats (the governing party has lost two-party share in 13 of 19 elections since 1948).
| 2000+ (our standing rule) | governing party's margin = +1.36 + 0.338 × (June approval − 50); error on left-out elections 3.5 points; 7 elections |
|---|---|
| 1948+ (comparison) | +4.58 + 0.657 × (June approval − 50); error 6.5 points; 20 elections |
June 2028 approval is not known yet, so we project it from today's: over the past, approval about two years out has drifted back toward the middle, with a spread of about 7 points by June (2000+ fit: June = 16.0 + 0.59 × today). That spread is the largest part of the fundamentals' uncertainty today. Gallup, whose series the model is fitted on, stopped publishing presidential approval after December 2025; today's figure is the average of other pollsters' latest polls, moved onto Gallup's scale by the gap between them in 2025 (-3.8 points).
Which fit we use. The 2000+ fit did better on the 2000-2024 elections at every horizon but one, and its slope (0.17 points of vote share per point of approval) suits an electorate where landslides no longer happen. The 1948+ fit assumes swings about twice as large. We use 2000+ and show 1948+ beside it.
2. The polls
Every national head-to-head poll of the last 240 days, and any generic-party question, goes into one regression: margin = party baseline + Democratic candidate's effect + Republican candidate's effect + the pollster's house effect + noise. Candidate effects start from zero and are shrunk hard: their spread across past candidates is 4.2 points, and a candidate with more "unsure" answers than the median is shrunk more, because early deficits of little-known candidates were mostly recognition that later came back. Only 59% of an effect survives each six months, so by November 2028 about 13% of today's is left. A candidate with fewer than 3 matchups or a single pollster is shown as "no evidence: level with party".
Each poll is weighted by recency, by the firm's accuracy and openness from our pollster audit, and at one half if a party, campaign, PAC or advocacy group paid for it, whichever party. Each firm's own past lean against results is corrected, the same rule in both directions. Generic presidential questions count far less: the few on record missed by 4 to 11 points.
3. Blending polls and fundamentals
The two are blended by weights measured on the elections of 2000-2024 at each distance from polling day: each part's weight is set by the other's measured error. We use the nearest measured distance, not a fitted curve.
| Months out | Weight on polls | Fundamentals error | Polls error | sd used |
|---|---|---|---|---|
| 24 months | 21% | 4.5 | 8.8 | 4.5 |
| 18 months | 15% | 4.1 | 9.7 | 4.2 |
| 12 months | 24% | 4.2 | 7.4 | 4.0 |
| 6 months | 32% | 3.7 | 5.4 | 3.3 |
| 3 months | 39% | 3.8 | 4.7 | 3.2 |
Errors are root mean squared errors on the two-party margin, each election forecast without its own data. The sd used for the ranges is the blend's measured error, never smaller than two independent errors would give, widened for the small number of elections.
4. States, Maine and Nebraska
A state's margin is the national margin plus its lean: its 2024 margin against the nation's, times 0.99, which is how much lean has carried from one election to the next since 2000 (2020 adds nothing once 2024 is known). Leans move by about 5.7 points a cycle; about 3.4 of that is shared by neighboring states (census divisions) and the rest, 4.6, is each state's own. The simulation draws all of these together with the national error, so states miss together as they do in real elections. Maine's and Nebraska's districts start from their own 2024 margins. A state poll moves the state's lean by its value measured against our national reading of the same pairing.
5. Your scenario
The approval slider replaces the projected June approval with yours and removes its uncertainty from the fundamentals; everything else stays. The sitting-vice-president switch uses a line fitted on the five elections a sitting vice president ran in (1960, 1968, 1988, 2000, 2024). Those five followed approval much less than other elections, which is the opposite of what one might expect; five cases cannot settle it. A scenario is always shown beside the forecast, never in its place.
5a. Donald Trump*: his approval in place of polls
No pollster has asked about Trump against a Democrat in 2028, so a pairing with him has no polls of its own. His own approval stands in for him. Gallup's record from Truman to Trump (1945-2025; 2026 from other pollsters put on Gallup's scale) gives two relations with June approval of the election year, each fitted on elections left out one at a time:
- Presidents who ran again (12 elections, 1948-2020): margin = 5.33 + 0.822 × (June approval − 50), error 7.5 points on elections left out. At 50% approval an incumbent wins by about 5 points.
- Open seats (8 elections): the party's nominee moves about 0.31 points of margin per point of the outgoing president's approval, a third as much, and starts level at 50%.
With his approval transposed, a pairing with Trump* uses the first relation on his projected June approval in place of the party baseline and of his group appeal. Today: approval 37.5% (33.7% on Gallup's scale), June 2028 projected 35.8% (sd 7.2); his margin D+6.4 (sd 9.5) against D+3.4 (sd 4.2) for a generic Republican. After the poll blend that moves the pairing 2.3 points toward the Democrats and widens its spread.
A caution the backtest makes plain: approval two years out told us almost nothing about an incumbent's result. Projected forward and put through either relation, it missed by about 6.3 points of share on the 12 who ran again, no better than the incumbents' average. Its value now is the direction and the width: an incumbent's fate rides on his approval far more than a successor's does.
5b. The approval predictor
The card on the 2028 page with a slider is history only: Trump's approval on election day (today's, moved by the reader) put through what past elections say, with no polls of the pairing and no candidate effects. Gallup approval about two weeks before election day is set against the governing party's share of the two-party vote, in three groups: a president running again (12 elections, 1948-2020; about 0.41 points of share per point of approval, R² 0.73), a sitting vice president (5: 1960, 1968, 1988, 2000, 2024; almost flat), and every open seat (8, 1952-2024; about 0.17). Each reading's range adds the line's own uncertainty at that approval and is widened for the few elections behind it. The Electoral College is drawn from that national vote and each state's lean, as in the forecast.
6. 2028 House, Senate and governors
The 2028 House vote is read from the presidential party baseline: since 2000 the House margin in a presidential year has been -1.35 + 1.23 × the presidential margin, with an error of 3.4 points on elections left out. Adding the midterm result (which today's generic ballot measures) did not help, so the midterm generic ballot gets no weight. Senate class III and the governors use that national vote and each state's lean. They are withdrawn with the presidential forecast.
7. Candidates by voter group
Each candidate is rated by their appeal to five groups of voters, so that a matchup nobody has polled still reflects who each candidate reaches. Appeal is a shift in the group's two-party margin, in points, toward the candidate (+) or away (−), against the party's average candidate. A pairing adds the two candidates' appeal in each group, weights each group by its share of each state's voters, and runs through the same simulation as the generic contest. With every appeal at zero the groups add up exactly to the generic forecast.
Check, run live: with every candidate's appeal at zero, the groups of each state add up to the generic forecast's margin in that state to within 4.3e-14 points (56 states and districts); the national margin is the generic one exactly.
Who is in each group
| Group | Rule | Share of 2024 voters | Voted Democratic, 2024 |
|---|---|---|---|
| Trump-aligned Republicans | Republicans (leaners included) likely to vote for Donald Trump against another named Republican in a contested presidential primary. | 31% | 0.5% |
| Other Republicans | Republicans (leaners included) likely to vote for another named Republican against Donald Trump in a contested presidential primary. | 12% | 7.4% |
| Independents | Voters who lean to neither party, or are not sure. | 11% | 38.1% |
| Moderate Democrats | Democrats (leaners included) likely to vote for Joe Biden, Michael Bloomberg, Pete Buttigieg or Amy Klobuchar against Bernie Sanders or Elizabeth Warren in a contested presidential primary. | 26% | 96.6% |
| Progressive Democrats | Democrats (leaners included) likely to vote for Bernie Sanders or Elizabeth Warren against Joe Biden, Michael Bloomberg, Pete Buttigieg or Amy Klobuchar in a contested presidential primary. | 19% | 97.3% |
The groups are named by how their members vote in contested primaries, nothing else. Party is the voter's own identification, leaners included. Group shares, turnout and 2020/2024 votes by state come from the Cooperative Election Study (Harvard Dataverse, CC0), calibrated so that every state reproduces its official result. The Republican split is the least certain part: reasonable choices put 26% to 34% of voters in the Trump-aligned group (we use 31%). Each group has a mirror in the other party: Trump-aligned Republicans and progressive Democrats (each party's larger primary wing in the elections measured), other Republicans and moderate Democrats; independents mirror themselves.
Three kinds of evidence
- Polls. Favorability by group from the pollsters' own crosstab files (Echelon Insights, which alone splits Republicans into Trump-first and party-first; Emerson College; Harvard CAPS/Harris; Quinnipiac), relative to the party's average candidate in the same poll, plus each candidate's head-to-head effect. "Haven't heard" is not counted as dislike: we use net favorability among those who rate the candidate, projected to a group that knows them as well as a nominee is known (90%), so an unknown gets little evidence rather than a penalty. How favorability turns into votes was measured on the 2008, 2016 and 2024 cycles, where the same polls asked both: 0.26 points of a group's margin per point of net favorability among the candidate's own party, 0.11 among the other party, 0.31 among independents. Like every early poll effect, only about 13% is expected to last to November.
- Own races. How far each candidate ran ahead of a generic candidate in their statewide races, after the state, the year, incumbency and the opponent (717 Senate and governor races, 2000-2024; shrunk). Within statewide politics about 0.38 of it carries into the next race. On the presidential ticket no carry-over could be detected (correlation 0.06 over 22 nominees). We carry a fixed share of it into the national margin, capped, and spread it across the groups half by the county and precinct pattern where that pattern is rated High or Medium, otherwise in proportion to how evenly each group splits.
- Start. A candidate with no evidence starts where similar candidates end up. The only attribute that predicted performance out of sample was the candidate's own earlier result (ideology scores, military service, gender, age and time in office did not), so the start is the own-races figure where there is one, and zero otherwise.
How they combine: a candidate's appeal in November is 13% their appeal in today's polls and 87% their lasting appeal, the rate at which early poll effects have faded since 2008. The lasting appeal starts from (3), give or take 1.5 points of national margin; today's poll effects scatter widely around it (3.9 points), so polls move it only a little; 0.5 points of movement between now and November are left to chance. The polls pin down today's appeal; the record and the start carry most of the lasting part.
Judgment calls
These are choices, not measurements. We set the first two by judgment; the rest are fixed in the model and listed here so that they can be argued with.
| Revealed-evidence factor | 0.2 of a candidate's statewide effect carried into the national margin (the research suggested 0.2 and could not tell 0 from 0.4) |
|---|---|
| Cap | ±2.5 points of national margin |
| prior sd | 1.5: judgement: sd of a candidate's national effect in November before any evidence (research: 1-2 points survive) |
| group dev sd | 1.0: judgement: sd of a group's own deviation from the candidate's common shift, in units of the group profile |
| today sd | 3.9: judgement from the research: spread of today's poll effects around a candidate's lasting appeal (4.2 early, about 1.5 lasting) |
| today group sd | 2.0: judgement: the same for a group's own deviation, in units of the group profile |
| innov sd | 0.5: judgement: sd of movement between now and November that neither the polls nor the record can see |
| rec ref | 0.9: judgement: recognition assumed for a nominee in November |
| precinct weight | 0.5: judgement: weight on the county/VTD pattern when spreading a revealed effect (the rest proportional) |
What the factor does
The same matchups with the revealed-evidence factor at 0, 0.2 and 0.4 (margins two-party, Democrat minus Republican; chance = Democratic Electoral College chance). We use 0.2.
| Matchup | Factor 0 | 0.2 | 0.4 |
|---|---|---|---|
| Generic Democrat v generic Republican | D+3.0, 66% | D+3.0, 66% | D+3.0, 66% |
  Mark Kelly v JD Vance |
D+3.0, 65% | D+3.7, 70% | D+4.3, 75% |
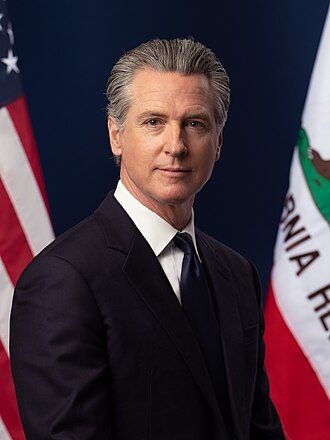 Gavin Newsom v JD Vance |
D+3.0, 67% | D+3.6, 70% | D+4.1, 74% |
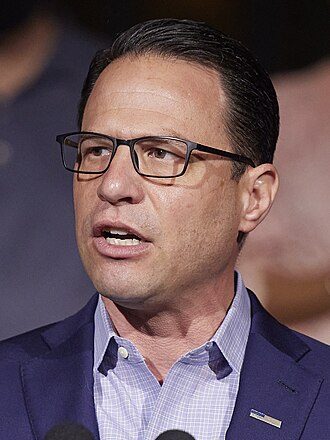 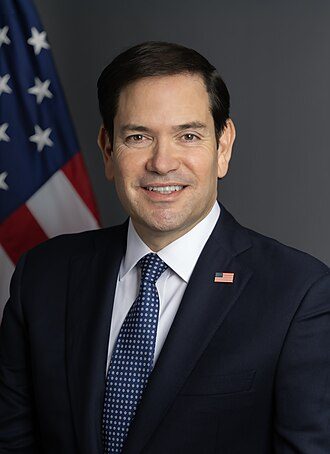 Josh Shapiro v Marco Rubio |
D+3.0, 66% | D+3.7, 71% | D+4.0, 73% |
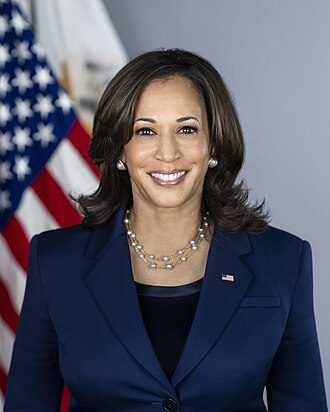 Kamala Harris v JD Vance |
D+3.0, 66% | D+3.1, 67% | D+3.2, 66% |
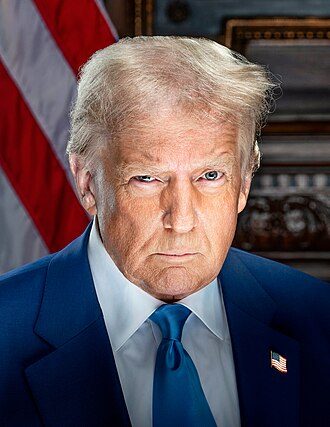 Gavin Newsom v Donald Trump* |
D+5.3, 69% | D+5.8, 72% | D+6.3, 73% |
* The 22nd Amendment bars anyone elected president twice from being elected again. Included only because pollsters ask about him; this is not a view that he can run.
| Candidate | National effect at 0 | 0.2 | 0.4 |
|---|---|---|---|
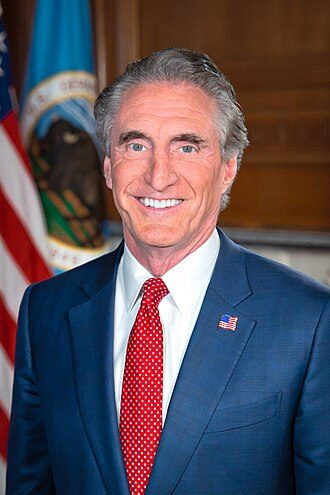 Doug Burgum (R) | 0.0 | +1.9 | +2.5 |
| Josh Shapiro (D) | +0.1 | +1.4 | +2.1 |
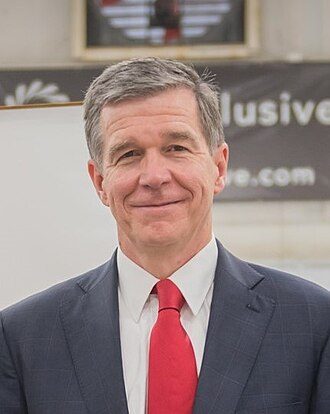 Roy Cooper (D) | 0.0 | +1.3 | +2.5 |
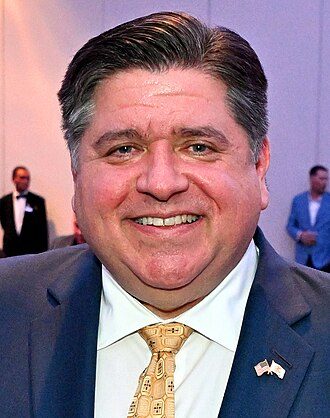 JB Pritzker (D) | 0.0 | +1.2 | +2.4 |
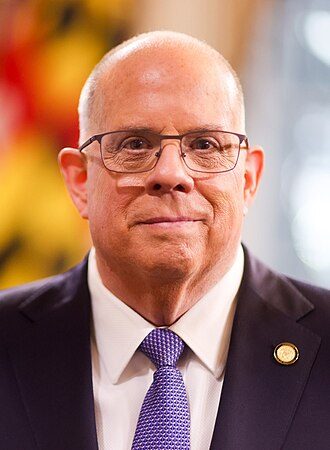 Larry Hogan (R) | 0.0 | +1.2 | +2.4 |
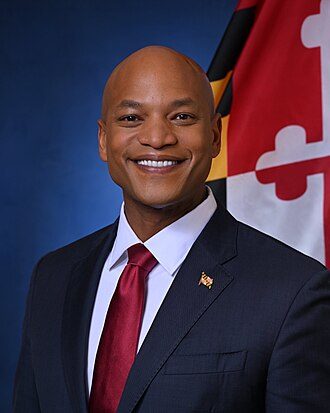 Wes Moore (D) | 0.0 | +1.1 | +2.1 |
 Kristi Noem (R) | -0.3 | -1.0 | -1.8 |
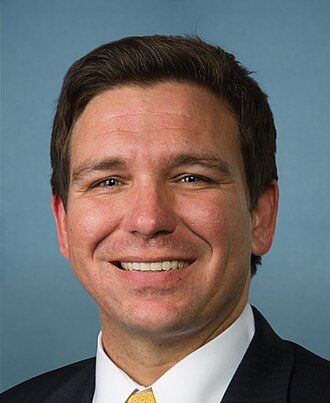 Ron DeSantis (R) | 0.0 | +1.0 | +1.9 |
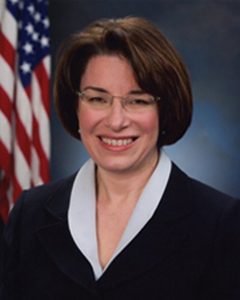 Amy Klobuchar (D) | 0.0 | +1.0 | +1.9 |
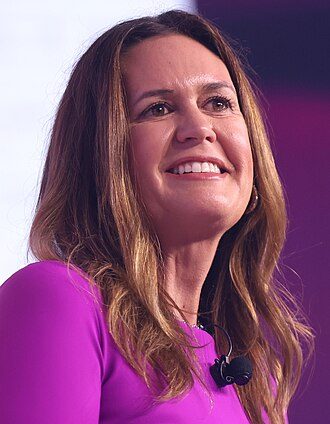 Sarah Huckabee Sanders (R) | 0.0 | +0.9 | +1.9 |
Tests of the voter-group layer (gates G6 and G7)
Backtests (gate G6)
2016, 2020 and 2024 forecast at five distances from polling day with only what existed then: the crosstabs fielded before the forecast date (none survive for the 2020 cycle), the favorability-to-vote slopes measured without that cycle, and each nominee's statewide record before that year. "Pair" is the model with the nominees' head-to-head effects (before this layer); "layer" replaces them with the group layer.
| Factor | National error: party model | Pair | Layer | State error: pair | Layer | States right: pair | Layer |
|---|---|---|---|---|---|---|---|
| 0 | 1.57 | 1.54 | 1.66 | 5.52 | 5.51 | 715/765 | 717 |
| 0.2 | 1.57 | 1.54 | 1.94 | 5.52 | 5.56 | 715/765 | 718 |
| 0.4 | 1.57 | 1.54 | 2.26 | 5.52 | 5.65 | 715/765 | 714 |
In plain terms: in the three elections we can test, the layer did not measurably help, and at the default factor it did slightly worse than the head-to-head effects alone on the national vote. All three had the same Republican nominee, who had never run statewide, so the test is thin. We keep the layer because it lets a matchup nobody has polled reflect who each candidate reaches, and because its default effects are small; every part of it is shown, and "your scenario" lets anyone set a candidate's appeal themselves.
Symmetry (gate G7), checked live
Every candidate's evidence mirrored (party swapped, each group swapped with its mirror) in a mirrored electorate: largest difference from the mirror image 4.4e-15 points in a group, 6.7e-16 nationally, over 58 candidates. Group names and definitions scanned for loaded words: none found.
Full test results
Every test the model has been put through, with the backtest tables
Quality gates
The hardest benchmark is a forecast of a dead heat every time, because every election since 2000 finished within 7.4 points. The model beats it at 24 months, 12 months, 6 months and 3 months; at 18 months it does not (4.8 against 3.9 points).
Before we publish, the model has to pass these tests, and the result of each is shown here whether it passed or not.
| Gate | Test | Result |
|---|---|---|
| G1 | Beats repeating the last result, a dead-heat forecast and the raw polls, leaving each election out, at 24, 18, 12, 6 and 3 months, nationally and on state winners | not met. Beats repeating the last result at every distance and roughly halves the error of the raw polls. Beats a dead-heat forecast at 24 months, 12 months, 6 months and 3 months, not at 18 months. When the model's settings are chosen again without the left-out election (a stricter test), its errors are larger: both are in the tables below. With the voter-group layer: Rerun with the layer: the generic forecast is unchanged (the layer is exactly zero for generic candidates), so the G1 tables stand; named pairs are tested in G6. |
| G2 | 80% ranges contain the result about 80% of the time | passed. 80% ranges held the result 30 times out of 35 nationally (86%) and 1516 of 1785 state results (85%) across the backtests (2000+ model, 5 horizons x 7 elections). Slightly wide, not narrow. With the voter-group layer: Rerun with the layer: named pairs now add each candidate's group uncertainty; their 80% ranges held the result in 13 of 15 G6 backtests (existing pair version: 15). Fifteen backtests of three elections are thin evidence of calibration. |
| G3 | Swapping the parties gives the mirror result; pollster weights neutral by client party | passed. Swapping the parties' inputs mirrors every output: national margin +3.60 / -3.60, poll baseline +0.12 / -0.12, largest candidate-effect mismatch 1.6e-15, Electoral College chance 0.6537 / 0.6537. Pollster weights by client party: R client base 0.891, D client base 0.889. With the voter-group layer: Rerun with the layer: the generic mirror is unchanged; the layer's own mirror test is G7. |
| G4 | Compared with the published fundamentals models | done. Compared with Abramowitz, Fair, Hibbs, Lewis-Beck/Tien and Wlezien/Erikson; differences explained. With the voter-group layer: No published model rates candidates by voter group; nothing to compare. The favourability-to-vote slopes are our own measurement. |
| G5 | Every input sourced and graded; this page and its changelog | done. Every input listed with its source and grade; the method page (/us/2028/method) and its changelog are written. With the voter-group layer: New inputs: CES group sizes (Harvard Dataverse, CC0, A); Echelon, Emerson, Harvard CAPS/Harris and Quinnipiac crosstab files (A); statewide results from MIT Election Lab and state election offices (A), a few down-ballot races from Wikipedia (C). |
| G6 | The voter-group layer must not make the backtests worse where it can be tested (2016, 2020, 2024, with only what existed at the time) | not met. Backtests of 2016, 2020 and 2024 at five horizons (15), with only the crosstabs and statewide records that existed at the time: national error 1.94 with the group layer against 1.54 for the existing candidate effects (party model alone 1.57); worse at 730 days, 548 days, 365 days, 183 days, 91 days. With the revealed-evidence factor at 0 the layer scores 1.66, at 0.4 2.26. States called right barely move. The layer adds nothing measurable in three elections that all had the same Republican nominee; it is kept as a transparent scenario tool with small default effects. |
| G7 | Mirror candidates across the parties give mirror results; no group name or definition is loaded | passed. Mirror test: every candidate's evidence mirrored (party swapped, each group swapped with its mirror) in a mirrored electorate gives the mirror result (largest difference 3.6e-15 in a group effect over 55 candidates). Group names describe primary behaviour; the site scans the labels and definitions for loaded words on the method page. |
In plain terms: two years out the model already calls more than nine states in ten and misses the national margin by about three points, well ahead of repeating the last result or reading the raw polls. What it cannot do that early is know much more than "close, leaning to the side the president's unpopularity favors", and in an era of close elections a plain dead-heat forecast is hard to beat on the margin. We show every test, including the ones it does not pass, rather than tune the model until it passes them all.
Backtests in full
Each election 2000-2024 forecast without its own data, using only polls available at that distance. Root mean squared error on the national margin (lower is better), states called right out of 51 per election (higher is better), and how often the 80% range held the result.
2000+, inputs fixed (what the site uses)
| Out | Model | Same as last | Dead heat | Model v raw polls | States: model | Same as last | Dead heat | 80% held |
|---|---|---|---|---|---|---|---|---|
| 24 months | 3.0 | 5.9 | 3.9 | 3.7 v 8.2 (4) | 331/357 | 315 | 327 | 6/7 |
| 18 months | 4.8 | 5.9 | 3.9 * | 5.1 v 9.1 (5) | 320/357 | 315 | 327 * | 5/7 |
| 12 months | 3.0 | 5.9 | 3.9 | 3.0 v 7.1 (7) | 333/357 | 315 | 327 | 6/7 |
| 6 months | 1.6 | 5.9 | 3.9 | 1.7 v 4.6 (5) | 335/357 | 315 | 327 | 7/7 |
| 3 months | 1.9 | 5.9 | 3.9 | 1.4 v 4.0 (6) | 336/357 | 315 | 327 | 6/7 |
2000+, inputs chosen again without the left-out election
| Out | Model | Same as last | Dead heat | Model v raw polls | States: model | Same as last | Dead heat | 80% held |
|---|---|---|---|---|---|---|---|---|
| 24 months | 6.4 | 5.9 * | 3.9 * | 8.2 v 8.2 (4) | 320/357 | 315 | 327 * | 5/7 |
| 18 months | 8.2 | 5.9 * | 3.9 * | 9.5 v 9.1 (5) * | 318/357 | 315 | 327 * | 5/7 |
| 12 months | 6.6 | 5.9 * | 3.9 * | 6.6 v 7.1 (7) | 325/357 | 315 | 327 * | 5/7 |
| 6 months | 4.8 | 5.9 | 3.9 * | 5.3 v 4.6 (5) * | 328/357 | 315 | 327 | 5/7 |
| 3 months | 4.0 | 5.9 | 3.9 * | 4.4 v 4.0 (6) * | 330/357 | 315 | 327 | 6/7 |
1948+, inputs fixed
| Out | Model | Same as last | Dead heat | Model v raw polls | States: model | Same as last | Dead heat | 80% held |
|---|---|---|---|---|---|---|---|---|
| 24 months | 6.4 | 5.9 * | 3.9 * | 3.5 v 8.2 (4) | 315/357 | 315 * | 327 * | 5/7 |
| 18 months | 4.4 | 5.9 | 3.9 * | 3.9 v 9.1 (5) | 324/357 | 315 | 327 * | 6/7 |
| 12 months | 1.7 | 5.9 | 3.9 | 1.7 v 7.1 (7) | 328/357 | 315 | 327 | 7/7 |
| 6 months | 3.3 | 5.9 | 3.9 | 3.4 v 4.6 (5) | 325/357 | 315 | 327 * | 5/7 |
| 3 months | 3.8 | 5.9 | 3.9 | 2.5 v 4.0 (6) | 328/357 | 315 | 327 | 6/7 |
*: the model did not beat that benchmark there. Dead heat: a forecast of a tied national vote every time, with each state at its usual lean. Raw polls: the average of the matchup that happened, where it was polled at that distance (number of elections in brackets).
Sources
- Results: FEC summaries 1996-2024, MIT Election Data and Science Lab 1976-2024, the Clerk of the House 1948-1972.
- Approval: Gallup's own trend pages 1945-2025; today's from the pollsters' own releases.
- Economy (tried, not kept): BEA and BLS figures from the Philadelphia Fed's Real-Time Data Set, checked against BEA and BLS.
- Early national polls 2000-2024 for the backtests: the pollsters' and outlets' releases.
- 2028 polls: the pollsters' releases. Pollster weights: our pollster audit (FEC bulk files, AAPOR Transparency Initiative and Roper lists, final polls 2000-2025).
- Published models compared: Abramowitz, Fair, Hibbs, Lewis-Beck and Tien, Wlezien and Erikson, from their own papers and pages.
- Voter groups: Cooperative Election Study 2016-2025 (Harvard Dataverse, CC0), calibrated to the official results (MIT Election Data and Science Lab). Crosstabs: the pollsters' own files (Echelon Insights, Emerson College, Harvard CAPS/Harris, Quinnipiac). Statewide records: MIT Election Lab and state election offices.
Changelog
- 2 October 2026 (later). The approval predictor (section 5b): a slider for Trump's approval on election day and the Republican running (Trump*, the sitting vice president, another Republican), from election-eve approval in every presidential election since 1948.
- 2 October 2026. A pairing with Donald Trump* can now be scored from his own approval through the record of presidents who ran again (1948-2020), in place of a generic Republican (section 5a). Gallup approval for every president from Truman, with midterm and successor effects, recorded in the research files.
- 29 September 2026 (later). Candidates rated by appeal to five voter groups: favorability crosstabs, own statewide records (carried at a factor of 0.2) and a shrunk start, combined by group size and turnout in each state, with group-level uncertainty in the simulation. Candidate pages, the groups that decide each swing state, and "your scenario" for a candidate's appeal. Gates G6 and G7 added (see Full test results). Donald Trump added to the picker with an asterisk and a fixed note on the 22nd Amendment. Still withdrawn.
- 29 September 2026. The old early projection (two thirds on the 2024 result, Vance 59-40 over Newsom) withdrawn. Rebuilt as a party contest: fundamentals fitted by leaving each election out (only June approval kept), polls read jointly with candidate and pollster effects, weights measured at each horizon, states from the 2024 lean with measured persistence and drift. Backtests and gates run (see Full test results). Kept withdrawn pending an independent review.
Photo credits
2 official portraits from the Biographical Directory of the United States Congress (US government work, public domain): Amy Klobuchar, Mark Kelly.
- Donald Trump: Photo: The White House, Public domain, via Wikimedia Commons (https://commons.wikimedia.org/wiki/File:January_2025_Official_Presidential_Portrait_of_Donald_J._Trump.jpg)
- Doug Burgum: Photo: United States Department of the Interior, Public domain, via Wikimedia Commons (https://commons.wikimedia.org/wiki/File:Doug_Burgum_2025_DOI_portrait.jpg)
- Gavin Newsom: Photo: Charles Ommanney – Office of the Governor of California, CC BY-SA 4.0, via Wikimedia Commons (https://commons.wikimedia.org/wiki/File:Governor_of_California_Gavin_Newsom_(cropped_3x4).jpg)
- JB Pritzker: Photo: Maryland GovPics, CC BY 2.0, via Wikimedia Commons (https://commons.wikimedia.org/wiki/File:J.B._Pritzker_April_2023.jpg)
- JD Vance: Photo: Emily J. Higgins, Public domain, via Wikimedia Commons (https://commons.wikimedia.org/wiki/File:March_2026_Official_Vice_Presidential_Portrait_of_JD_Vance.jpg)
- Josh Shapiro: Photo: Governor Tom Wolf, CC BY 2.0, via Wikimedia Commons (https://commons.wikimedia.org/wiki/File:Josh_Shapiro_2022_(cropped).jpg)
- Kamala Harris: Photo: The White House, Public domain, via Wikimedia Commons (https://commons.wikimedia.org/wiki/File:Kamala_Harris_Vice_Presidential_Portrait.jpg)
- Kristi Noem: Photo: U.S. Department of Homeland Security, Public domain, via Wikimedia Commons (https://commons.wikimedia.org/wiki/File:Official_Portrait_of_Secretary_Kristi_Noem.jpg)
- Larry Hogan: Photo: Maryland GovPics, CC BY 2.0, via Wikimedia Commons (https://commons.wikimedia.org/wiki/File:Larry_Hogan_(2021)_(cropped).jpg)
- Marco Rubio: Photo: U.S. Department of State, Public domain, via Wikimedia Commons (https://commons.wikimedia.org/wiki/File:Official_portrait_of_Secretary_Marco_Rubio.jpg)
- Ron DeSantis: Photo: United States Congress, Public domain, via Wikimedia Commons (https://commons.wikimedia.org/wiki/File:Ron_DeSantis_113th_Congress.jpg)
- Roy Cooper: Photo: NCDOTcommunications, CC BY 2.0, via Wikimedia Commons (https://commons.wikimedia.org/wiki/File:Gov._Cooper_Cropped.jpg)
- Sarah Huckabee Sanders: Photo: Gage Skidmore, CC BY-SA 4.0, via Wikimedia Commons (https://commons.wikimedia.org/wiki/File:Governor_Sarah_Huckabee_Sanders_2026.jpg)
- Wes Moore: Photo: Maryland State Government, CC BY-SA 4.0, via Wikimedia Commons (https://commons.wikimedia.org/wiki/File:Wes_Moore_Official_Governor_Portrait.jpg)
Figures as of . Published by Polling Forecast.