
The polls got the midterms wrong again, but this time the Democrats were the ones they missed
In 57 Senate and governor races the final polls understated the Democrats by three points, the first miss in that direction since 2012 and the largest in that direction on our record. Here is where they went wrong, which pollsters held up, what it did to our own forecast, and what it changes for 2028.
 Polling Forecast
8 min read
Written in house from our poll data and our forecast.
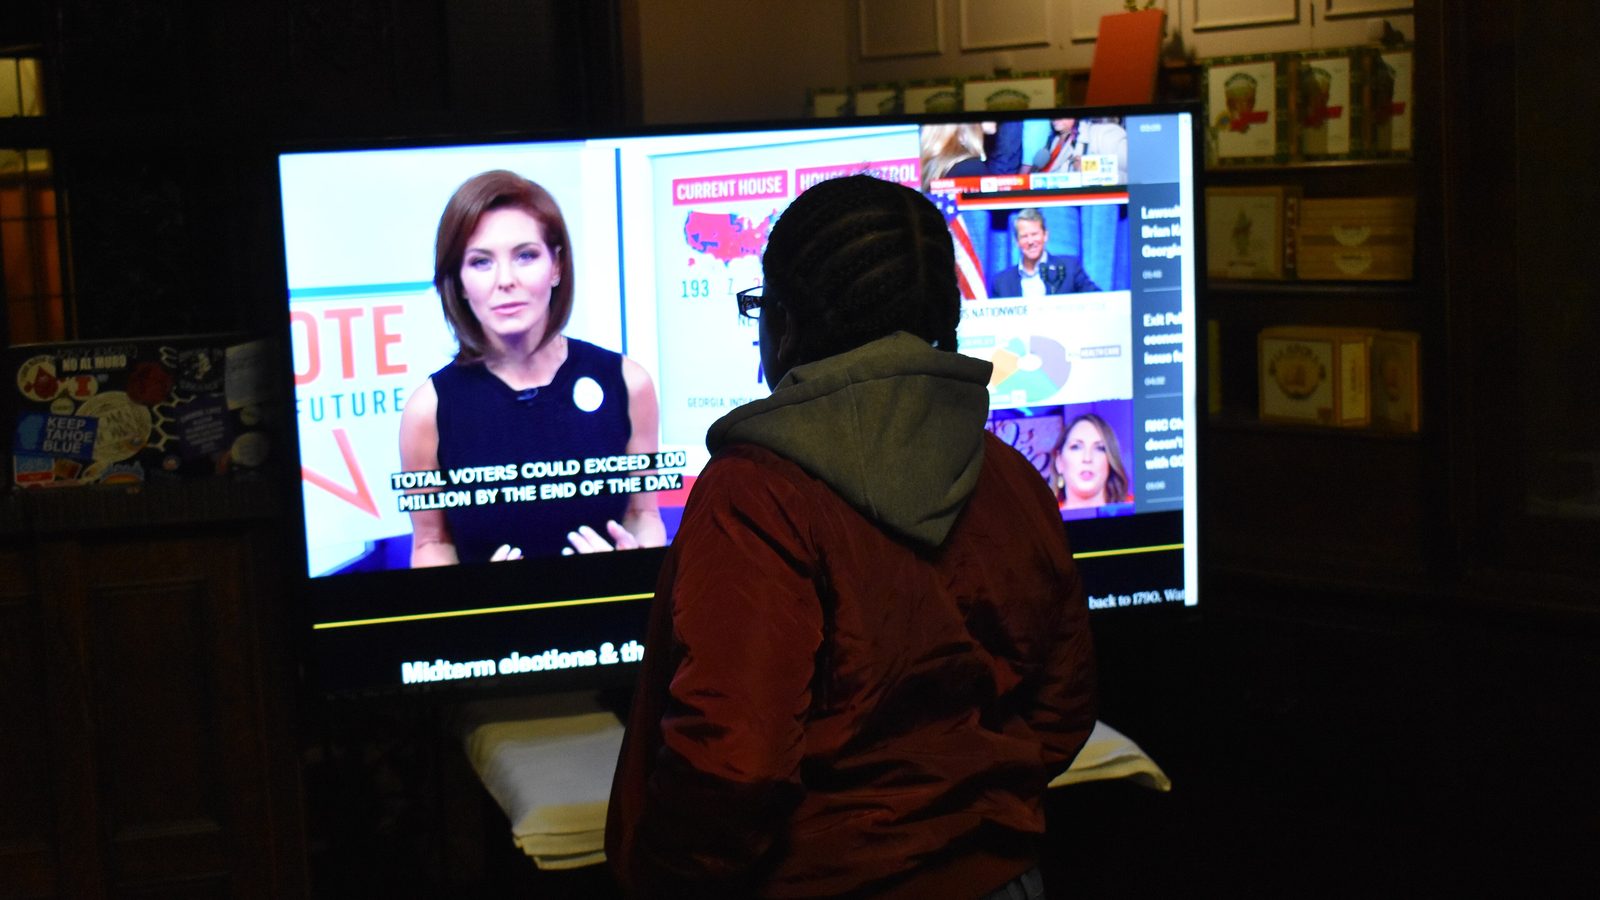

The Democrats won the House and the Senate on 3 November, as the polls said they would. But they won by more than almost anyone had them winning, and in some states by a lot more. In Texas the final polls had the Senate race at about D+3; the count is heading for D+12. In Georgia the governor's race looked tied in the polls and is going to the Democrat by almost nine points.
For a decade the story of American polling has been the same: the polls underestimate the Republicans. They did it in 2014, in 2016, badly in 2020, and again in 2022 and 2024. Pollsters spent those years changing how they weight their samples to catch the voters they kept missing. In 2026 the miss went the other way.
These figures are a first reading. About a third of the races are still being counted, and for those we use our own projection of the final count. The shares barely move with the votes still to come, so we do not expect the picture to change, but we will redo it when the states certify.
How big was the miss?
We take each pollster's last poll of a race in the final month and average them, which is the number most readers would have seen. Then we compare that average with the result, on the margin between the two leading candidates.
Across the 57 Senate and governor races with final polls, the average was 3.0 points too good for the Republicans. A race's polls missed by 5.2 points either way, against 4.6 in a typical year since 2000.
The national House vote tells the same story. The final generic-ballot polls, which ask which party you will vote for in your district, had the Democrats ahead by 9.6 points. The national House vote is heading for D+13.3, a miss of about four points.
To put the size in context, here is the average miss in each election year on our record, measured the same way. A positive number means the polls were too good for the Democrats:
2016 +3.9 · 2018 −0.1 · 2020 +6.9 · 2022 +1.1 · 2024 +2.3 · 2026 −3.0
2020 was a bigger miss. But it had been ten years since the polls last leaned towards the Republicans (2012, −2.4), and 2026 is the biggest miss in that direction since 2000.
Where the polls went wrong
The miss was not spread evenly. It was largest in the South and the border states:
Texas: Senate polls D+3.1, result D+12.1; governor polls R+1.7, result D+7.1.
Georgia: governor polls tied, result D+8.6; Senate polls D+9.4, result D+18.0.
North Carolina Senate: polls D+11.5, result D+19.6.
South Carolina, Alabama and Tennessee: the governor's and Senate races all ran five to nine points better for the Democrats than their polls.
In the Midwest and the North East the polls were much closer. Michigan's Senate race missed by 2.2 points, Maine's by 2.0, Minnesota's governor's race by 1.3 and Kansas's by 0.4. Those are states that were heavily polled and closely watched, and the pollsters were roughly right.
The House shows the same pattern. We compared every contested House race where at least 95% of the vote has been counted with our own forecast. The more Republican the district, the more it swung towards the Democrats.
Who got it right
Pollsters are not all alike, and a single average hides a wide spread. Among firms that polled several races:
Close: Siena College (21 races, an average miss of 3.4 points), CNN/SSRS (12 races, 3.1), Suffolk University (8, 2.6) and AtlasIntel (17, 3.8). All still leaned slightly Republican, but not by much.
Further out: YouGov (22 races, 4.7), Emerson College (19, 6.2) and Marist (11, 6.0) all missed in the Republican direction by more than the average.
Furthest out: Trafalgar (10 races, 7.9), InsiderAdvantage (12, 6.3), Rasmussen Reports (11, 5.6) and Quantus Insights (8, 10.2), firms that have leaned Republican before, overstated the Republicans by the most.
It matters that the miss was not confined to the Republican-leaning firms. University and media pollsters with no partisan history missed the same way, just by less. That points to something common to how most polls were built this year, not only a few firms' assumptions.
Why did it happen?
Nobody knows yet, and anyone who tells you with certainty is guessing. The industry's own reviews of 2016 and 2020 took months. But four explanations stand out, and they are not mutually exclusive.
First, who turned out. Midterms have lower turnout than presidential years, and the party that does not hold the White House usually turns out better. In 2026 that was the Democrats. A poll has to guess who will actually vote, and a model built on 2024's electorate would include too many occasional Republican voters who came out for Donald Trump but not for a midterm.
Second, the fixes for past misses. After 2016 and 2020 many pollsters started weighting their samples by how people said they voted last time, or by education, to make sure Republican-leaning voters were properly represented. Those fixes were tuned on elections where Trump was on the ballot. With him off it, they may have over-corrected.
Third, where the miss was biggest. The largest misses came in states where the Democrats had not won statewide in years and where the polling was thinner. If the Democrats' new voters were concentrated in places pollsters sample least, the averages would miss them.
Fourth, late movement. Some of the miss could be voters deciding late. We have not yet tested whether the polls taken in the last week missed by less than those taken earlier in the month; if they did, part of this was a late swing rather than a polling error.
What it did to our forecast
Our approach is to correct the polls only where the history shows that correcting them helps. Before 2026, the history said the polls had overstated the Democrats in the generic ballot at 11 of the last 13 House elections. So our national House vote was D+6.6 when the polls said D+8.7: we had moved it the wrong way.
That cost us most in the House. House races ran 4.7 points more Democratic on the margin than our forecast. Senate races ran 1.9 points more Democratic than we had them, and governor races 1.1, closer than the raw polls, because our statewide correction was small and the races' own fundamentals helped.
We called both chambers right. But we were too cautious about the size of the Democratic win, and the reason is clear: we had learned from a decade of misses in one direction, and this year the miss went the other way.
What we have changed
All of 2026 is now part of the history the model learns from. Here is what that means in practice:
Every poll is marked against the result. Each pollster's 2026 finals count in its rating (marked provisional until the counts are certified), and in the correction we apply to that firm's polls from now on.
The corrections learn from 2026. The size of the typical miss, how much of it races share, each pollster's lean, and the test that decides whether to correct at all are all fitted again with 2026 included. A run of misses in one direction no longer stands unchallenged.
The House model is refitted. We added the 411 contested districts with a count to the 2022 and 2024 races the model learns from. 336 of them are still provisional and 158 are on lines drawn new for 2026. Once you allow for the national vote, the 2026 districts ran 1.6 points more Democratic than the old model expected, and more so the more Republican the seat: about a point for every ten points of Republican lean. We tested whether, in a midterm, a seat's result should follow its lean less closely. It failed: predicting each of 2022, 2024 and 2026 from the other two, it made the model worse, badly so for 2024. So it is out. The refit counts for slightly less for incumbents than before (1.4 points of margin, down from 2.3) and is otherwise almost unchanged. Seats on new lines behaved like the rest, within a third of a point. We will refit once the states certify, though we do not expect that to change much.
"If the polls miss like 2026" is a reading on our 2028 map. Alongside our forecast, you can see what happens if 2028's polls miss the way 2026's did.
Has it moved the needle for 2028?
Barely. With 2026 folded in, our 2028 forecast gives the Democrats a 65.0% chance of winning the White House and 288.5 electoral votes on average. Without it, the same forecast gives them 64.5% and 288.1.
It moves so little for two reasons. First, the correction was small to start with. Before 2026, the misses of 2016, 2020 and 2024 led us to move the 2028 polls 0.4 points towards the Republicans. With 2026 in the record that falls to about 0.1 points. Second, this far from the election the polls carry only part of the forecast's weight.
The House is where it matters more. Our early 2028 House forecast gives the Democrats a 59% chance of keeping the chamber, with 224 seats on average.
A word of caution about reading too much into one midterm. Midterm and presidential electorates are different, and the polls' record in one does not carry over cleanly to the other. In 2018 the midterm polls were almost exactly right, and two years later, with Trump on the ballot, they understated the Republicans by seven points. 2026 tells us the industry can now miss in both directions. It does not tell us which way 2028 will go.
That is why our 2028 forecast does not simply flip its corrections. It weighs 2026 as one more election in a record that goes back to 2000, and it keeps its ranges wide.
The short version
The polls called the right winners in 2026 but understated how well the Democrats would do, especially in the South. The firms that are usually most favourable to the Republicans missed by the most, but almost everyone missed in the same direction. Our own forecast, which had learned to lean against the Democrats, missed too. All of that is now built into how we read the polls for 2028.
You can see every race and every pollster's record on our 2026 accuracy page, the 2028 forecast on the 2028 election map, and how the House model works in our research.
Polling Forecast reads every poll in ten countries, corrects for how pollsters have missed before, and turns them into seats. Our forecasts, the polls and our methods are free to explore.
Elsewhere on Polling Forecast
 Victoria votes in 23 days, and the Coalition is close to a majority
Victoria's state election is on 28 November. Our projection gives the Coalition 48 of the 88 seats, three more than a majority; One Nation's vote decides how many it really wins.
 Is the NDP on 8 per cent or 14? It depends which pollster you ask
Liaison and Nanos have the NDP on 13.6 to 14 per cent; Abacus and Léger on 8 to 9. At 8 the party would hold a handful of seats; at 14 it starts to win back some it lost in 2025.
 Only a repeat of 2023's polling miss would cost the right its majority
PiS and the two Konfederacjas have 240 seats in our projection. If the polls miss like 2023, they fall to 226 and the governing coalition, with the PSL back in the Sejm, reaches 234.