When the polls agree too much: herding, and how our forecast guards against it
Polls of a close race should scatter by chance. In 2024 they barely did. Here is why that matters, and the four things our model does so a pack of look-alike polls cannot make it overconfident.
 Polling Forecast
4 min read
data as of 2 November
Written in house from our poll data and our forecast.

A poll of 800 likely voters has a margin of error of about three and a half points on each candidate's share, and more on the gap between them. So if a race really is tied, honest polls of it should spread out. Some will show one candidate up four, others the other candidate up three. That scatter is not a flaw. It is what random sampling looks like.
Herding is when the scatter goes missing. A pollster gets a result that looks out of line with everyone else, and instead of publishing it, it reweights the sample, changes its turnout model or quietly leaves the poll in a drawer. Each decision can be defended on its own. Added together, they pull every poll toward the average, and the average toward whatever the first few polls said.
The 2024 evidence
Two days before the 2024 election, Silver Bulletin counted the polls of the seven battleground states. Of 249, 193 showed the race within 2.5 points, 78%. Given the sample sizes, about 55% should have, even if every race was exactly tied. The chance of that many landing so close by luck alone came to about 1 in 9.5 trillion. In Wisconsin it was 33 polls of 36; in Pennsylvania, 42 of 47. Some firms almost never strayed: Emerson had 12 of 12 within 2.5 points, InsiderAdvantage 10 of 10 and Redfield & Wilton 42 of 44.
Then Trump won all seven states. The polls were not far off in most of them, but they missed in the same direction, which is exactly the risk herding creates: when polls copy each other, their errors stop canceling out.
The pollster who did not herd took the opposite kind of hit. Ann Selzer's final Iowa Poll had Kamala Harris ahead by three. Trump won the state by more than 13. It was a bad miss, but a published outlier is how the system is supposed to work: an average needs polls that are allowed to be wrong in different ways.
Britain had its own version in 2015. The final polls had the Conservatives and Labour level; the Conservatives won by six and a half points. The industry inquiry found the final polls were closer to each other than chance would allow, "evidence consistent with herding," though it put the miss itself down to unrepresentative samples.
Why it fools a forecast
A model that reads tight agreement as certainty gets it backwards. Forty polls that all say "tied" look like overwhelming evidence. If they are forty versions of the same assumptions, they are much weaker evidence than that, and the true uncertainty is about where it would be with a handful of independent polls.
What our forecast does about it
The error never shrinks below history. For each race, our uncertainty is the larger of two numbers: how much final polls have missed by in past elections, and how much this race's pollsters actually disagree. When pollsters agree unusually closely, the first number takes over. Agreement can make the average steadier; it cannot make our odds more confident than past misses justify.
We count pollsters, not polls. A firm's polls share its methods and its house effect, so a race polled 44 times by one firm and three times by another is treated as resting on about two sources, not 47. That stops one prolific firm from setting a race, and it limits what a herd of similar polls can do.
Every simulation draws a shared miss. Each of our simulated elections starts with a national polling error that moves every race together, plus regional errors for states that vote alike. That shared miss is what herding produces in practice, and it is why our Senate odds stay well short of what the individual races would suggest.
We measure every pollster against the others. House effects are estimated against other firms' polls of the same races in the same weeks, and each pollster's record on past final polls decides how far we trust it.
In the eight other countries we cover, the pollster pages also run an explicit herding check. For each firm we compare the scatter of its polls around the field, after taking out its usual lean, with the scatter its sample sizes imply. About 1 is normal. Below 0.5 with eight or more polls is flagged. Germany's and Canada's are good places to start.
The check is display only, and we do not drop or down-weight a flagged firm. A heavily weighted online panel can be steadier than its sample size suggests without copying anyone, and a herded poll still carries some information. What we will not do is let a pack of similar polls narrow the range of outcomes. Our what-if page shows what each past polling miss would do to the House and Senate if it happened again on Tuesday.
Polling Forecast reads every poll in ten countries, corrects for how pollsters have missed before, and turns them into seats. Our forecasts, the polls and our methods are free to explore.
Elsewhere on Polling Forecast
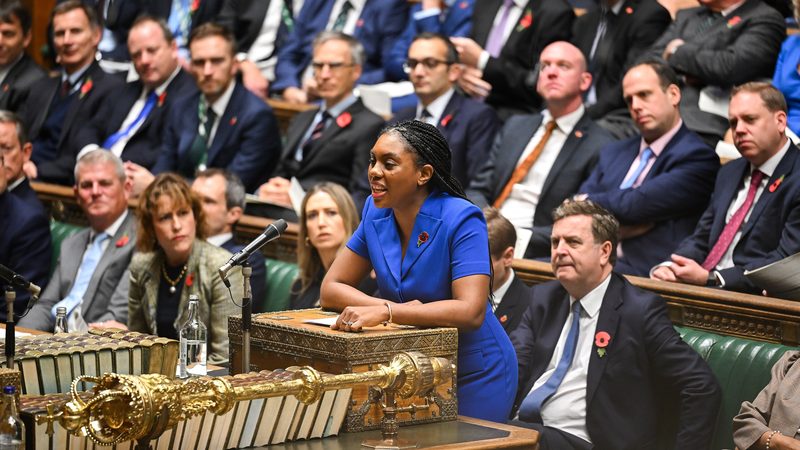 353 seats? The mega-poll's Labour majority comes from a split right, not tactical voting
Run the mega-poll's own vote shares through our model and Labour still gets 358 seats. The difference from our 316 is a weaker Conservative Party and a stronger Restore Britain, not the tactical voting the coverage focused on.
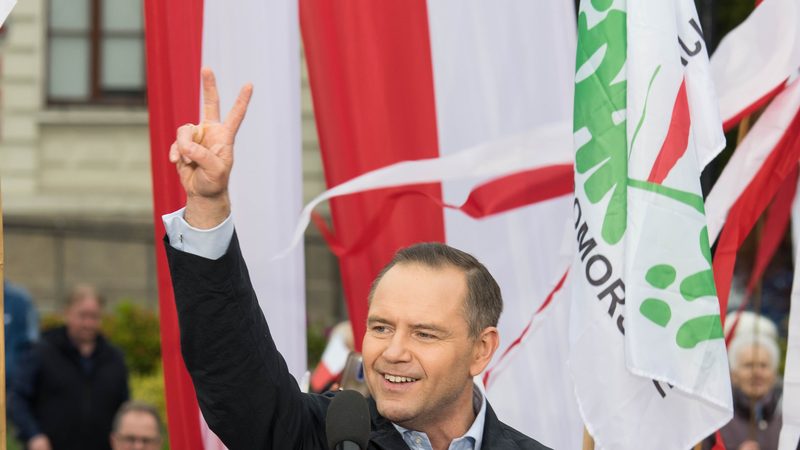 Polls understated PiS in 31 of 32 final surveys since 2024
At four national votes since Tusk took office, final polls put PiS or its candidate too low. Our forecast makes no allowance for it.
 Private polls understated Spain's PSOE at six of eight elections
104 of 142 private final polls since 2004 had the PSOE too low, but even a repeat of 2023 would probably leave the PP and Vox a majority.