
Did the polls blow the midterms? They missed one way, by more than usual, but not by a record
We checked every final poll in the Senate and governor races against the results. The polls underrated Democrats almost everywhere, and the firms that looked best in 2024 did worst this year.
 Polling Forecast
5 min read
data as of 11 November
Written in house from our poll data and our forecast.

A week after the midterms, the story that the polls got it badly wrong is everywhere. Democrats won Senate races in states nobody had on their list, and Mississippi is still too close to call. So we checked. We took every pollster's last poll in each Senate and governor race, from polls finishing between 4 October and polling day, and put them against the results. That is 57 races. Where a count is not finished we used our live model's estimate of the final count.
The short answer: the polls did miss, and all in one direction. It was a bad year, but not a record one, and some of the firms that looked like geniuses in 2024 had the worst of it.
How big was the miss?
On average the final polls had the Republican candidate 3.4 points better off on the margin than the result. In 47 of the 57 races the polls underrated the Democrat, or the independent the polls tested against the Republican.
That is a large miss by recent standards, but not an outlier. We hold the statewide polls for every cycle since 2000. Measured by how far the polls leaned to one side on average, 2026 comes fourth of the 14, behind 2020, when they underrated Republicans by 5.8 points, 2016 (4.0) and 2002 (3.5). By how far a typical race was off either way, 5.5 points, only 2020 was worse. Since 2000 the polls have missed a statewide race by about 4.7 points either way, so that part is a bad year rather than a broken one.
What is new is the direction. In 2016, 2020 and 2024 the polls underrated Republicans. The last time the statewide polls leaned this far the other way was never, in our data: the largest Democratic miss before this year was 2.2 points, in 2012. If you had got used to adding a few points to the Republican in your head, this was the year it cost you.
The national picture says the same thing. The seven pollsters with a final generic ballot had Democrats ahead by 9.6 points on average. The national House vote is heading for a Democratic lead of about 14.
Where it went wrong
The biggest misses were not in the swing states. They were in states the polls, and most forecasters, had written off for Democrats or treated as safe.
- Texas. No Senate race was polled more: 26 final polls, which averaged a 3-point Democratic lead. The count has James Talarico about 12 points ahead. In the governor's race 21 polls had the Republican narrowly ahead; the Democrat is winning by about 7.
- Georgia. The governor's race was a dead heat in the polls. The Democrat is ahead by more than 8. The Senate race, a 9-point lead in the polls, is closer to 18.
- North Carolina. The Senate polls had the Democrat 11 points up. The result is nearer 20.
- Mississippi. One public poll in the final three weeks, with Cindy Hyde-Smith about 3 points ahead of Scott Colom. With nearly every vote counted Colom leads by a few thousand votes. A 3-point miss is ordinary. What made it a shock is that almost nobody, forecasters included, thought the race worth polling, so one poll was all anyone had.
It was not one-way everywhere. In ten races the polls overrated the Democrat. Montana's Senate race was the largest, by more than 13 points, and the polls were too kind to the Democrats in both South Dakota races, the Vermont governor's race and Pennsylvania, where Josh Shapiro won comfortably but by less than his polls said.
Which pollsters missed most
Here the pattern is sharper. We marked every firm with a final poll in at least one race. Among the firms that polled six races or more, those that leaned furthest towards the Republicans were:
| Pollster | Races | Average miss | Leaned | |---|---|---|---| | Trafalgar Group | 10 | 7.9 | R 7.9 | | Targoz Market Research | 6 | 7.7 | R 7.7 | | co/efficient | 6 | 7.2 | R 7.2 | | Data for Progress | 7 | 7.2 | R 7.2 | | InsiderAdvantage | 12 | 6.3 | R 6.3 | | ActiVote | 14 | 6.3 | R 6.0 | | Marist College | 11 | 5.9 | R 5.9 | | Rasmussen Reports | 11 | 5.6 | R 5.6 |
Average miss is how far a firm's final polls were from the result on the margin, either way. Leaned is which side those misses favoured.
Trafalgar, InsiderAdvantage, co/efficient and Rasmussen are the names Republican campaigns and conservative media quote most. All four missed every race they polled in the same direction. But the list is not only right-leaning firms. Data for Progress works mostly with Democrats and missed just as badly, and Marist, one of the most established university polls, was nearly six points out. Most of the field missed the same way. The firms on this list simply missed further.
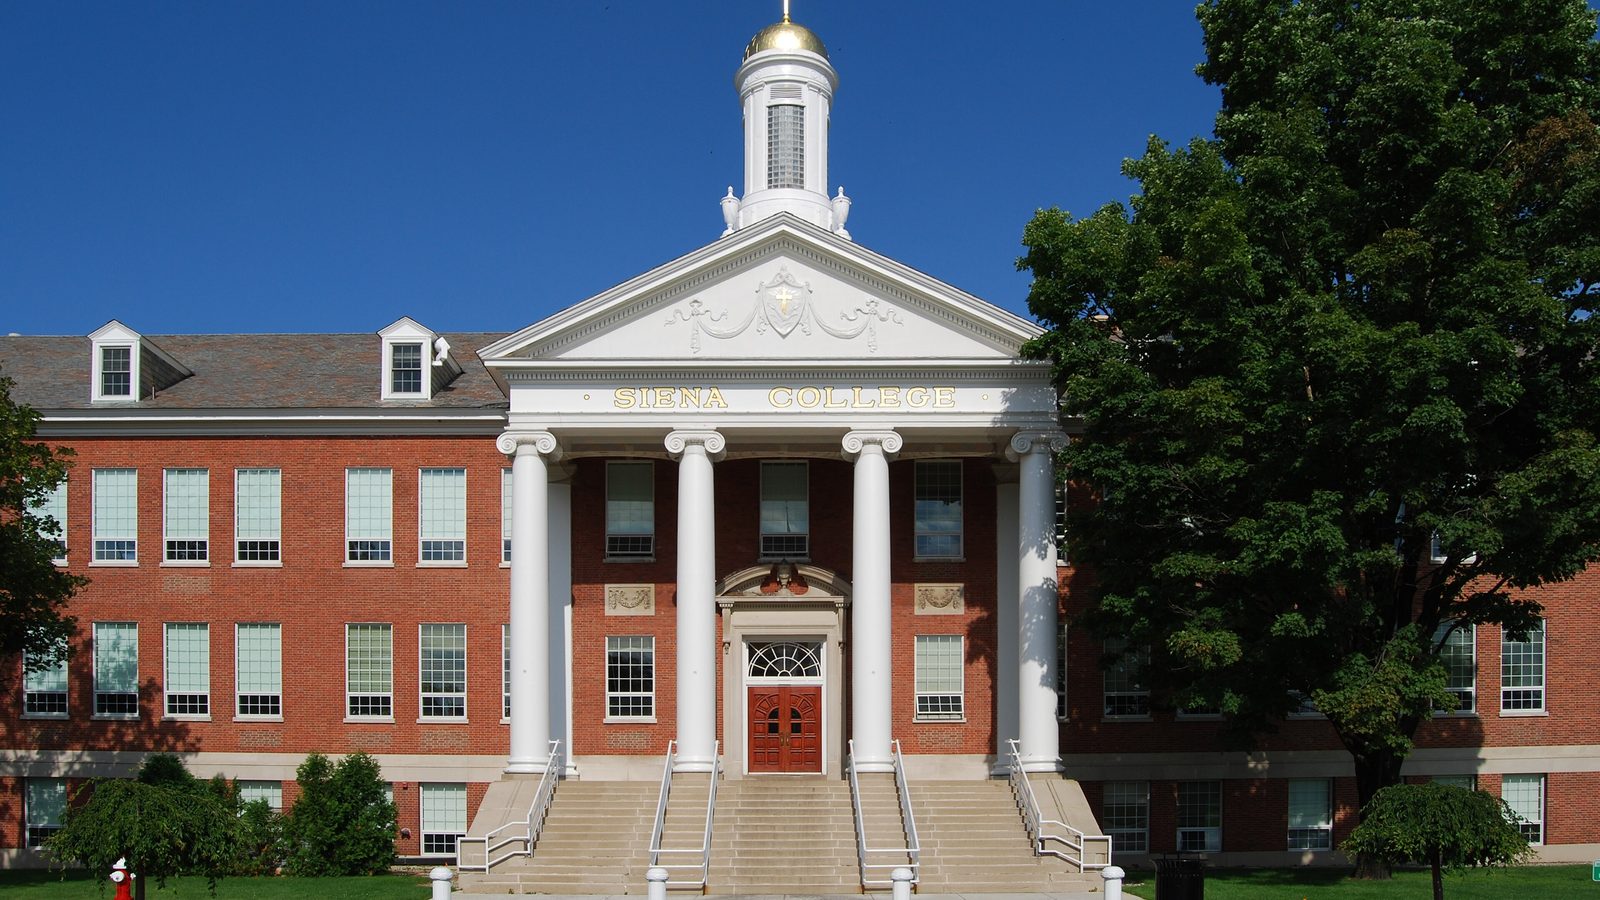
The firms that did best polled a lot of races and kept their misses small. Survey 160 was 1.7 points off on average across eight races. Suffolk University was 2.6 across eight, CNN and SSRS 3.1 across twelve, and Siena College, which polled 21 races, 3.9.
Why last cycle's winners were this cycle's losers
A pollster that leans a couple of points towards the Republicans every year looks brilliant when the whole field is underrating Republicans, as it was in 2016, 2020 and 2024. It looks worst when the field misses the other way. A good result in one cycle can be a lean that happened to point the right way that year. To tell skill from lean you need the firm's record over many elections, which is how we rate pollsters.
That is also why we don't simply trust whichever firms were closest last time. Our forecast measures each pollster's lean against the other polls of the same races, over every cycle we hold, and takes it out before averaging. This year's misses are now in that record.
What changes for 2028
Every 2026 race we marked now feeds our 2028 forecast: how far polls miss, how much of the miss is shared from race to race, and each pollster's lean. The 2028 map also has a new reading, "if the polls miss like 2026", next to the older misses.
One midterm does not prove the polls now lean towards Republicans. 2012 also leaned the Democrats' way, and 2016 then leaned the other. What it does show, again, is that the polls can be off by several points, in either direction, in the same direction in most races at once. A forecast that ignores that is not much use. Ours runs every past miss through the map.
Some counts are still running, so the marks are provisional. The results hardly move with the votes still to come, and the full table updates as each state certifies. It is on our polling accuracy page, race by race and pollster by pollster.
Polling Forecast reads every poll in ten countries, corrects for how pollsters have missed before, and turns them into seats. Our forecasts, the polls and our methods are free to explore.
Elsewhere on Polling Forecast
 Merz and the SPD agree an electricity tax cut overnight
The cut is funded for 2027 only, with the budget vote due next week; our forecast leaves the Union and SPD 65 seats short of a majority.
 Abascal claims three big parties as Vox holds 67 seats
Vox is on 19.1% and 67 seats in our projection, double its 2023 total, and Feijóo would need its votes to govern.
 Jetten's cabinet survives four days of crisis talks with the VVD
D66, the VVD and the CDA will carry on together, but our forecast gives the three parties 43 seats, far short of the 76 needed.