
Election 2026 midterms Live count
Each election opens in its own mode: the forecast before the votes are counted, the live count while races are still too close to call, and the results once every race is decided.
- 2028 President, Senate, House and governors Forecast
- 2026 midterms Senate, House and governors Live count
- 2025 governors Results
- 2024 President, Senate, House and governors Results
- 2023 governors Results
- 2022 Senate, House and governors Results
- 2021 governors Results
- 2020 President, Senate, House and governors Results
- 2019 governors Results
- 2018 Senate, House and governors Results
- 2017 governors Results
- 2016 President, Senate, House and governors Results
- 2015 governors Results
- 2014 Senate, House and governors Results
- 2013 governors Results
- 2012 President, Senate, House and governors Results
- 2011 governors Results
- 2010 Senate, House and governors Results
- 2009 governors Results
- 2008 President, Senate, House and governors Results
- 2007 governors Results
- 2006 Senate, House and governors Results
- 2005 governors Results
- 2004 President, Senate, House and governors Results
- 2003 governors Results
- 2002 Senate, House and governors Results
- 2001 governors Results
- 2000 President, Senate, House and governors Results
- 1999 governors Results
- 1998 Senate, House and governors Results
- 1997 governors Results
- 1996 President, Senate, House and governors Results
- 1995 governors Results
- 1994 Senate, House and governors Results
- 1993 governors Results
- 1992 President, Senate, House and governors Results
- 1991 governors Results
- 1990 Senate, House and governors Results
- 1989 governors Results
- 1988 President, Senate and governors Results
- 1987 governors Results
- 1986 Senate and governors Results
- 1985 governors Results
- 1984 President, Senate and governors Results
- 1983 governors Results
- 1982 Senate and governors Results
- 1981 governors Results
- 1980 President, Senate and governors Results
- 1979 governors Results
- 1978 Senate and governors Results
- 1977 governors Results
- 1976 President, Senate and governors Results
- 1975 governors Results
- 1974 Senate and governors Results
- 1973 governors Results
- 1972 President, Senate and governors Results
- 1971 governors Results
- 1970 Senate and governors Results
- 1969 governors Results
- 1968 President, Senate and governors Results
- 1967 governors Results
- 1966 Senate and governors Results
- 1965 governors Results
- 1964 President, Senate and governors Results
- 1963 governors Results
- 1962 Senate and governors Results
- 1961 governors Results
- 1960 President, Senate and governors Results
- 1959 governors Results
- 1958 Senate and governors Results
- 1957 governors Results
- 1956 President, Senate and governors Results
- 1955 governors Results
- 1954 Senate and governors Results
- 1953 governors Results
- 1952 President, Senate and governors Results
- 1951 governors Results
- 1950 Senate and governors Results
- 1949 governors Results
- 1948 President, Senate and governors Results
- 1947 governors Results
- 1946 Senate and governors Results
- 1945 governors Results
- 1944 President, Senate and governors Results
- 1943 governors Results
- 1942 Senate and governors Results
- 1941 governors Results
- 1940 President, Senate and governors Results
- 1939 governors Results
- 1938 Senate and governors Results
- 1937 governors Results
- 1936 President, Senate and governors Results
- 1935 governors Results
- 1934 Senate and governors Results
- 1933 governors Results
- 1932 President, Senate and governors Results
- 1931 governors Results
- 1930 Senate and governors Results
- 1929 governors Results
- 1928 President, Senate and governors Results
- 1927 governors Results
- 1926 Senate and governors Results
- 1925 governors Results
- 1924 President, Senate and governors Results
- 1923 governors Results
- 1922 Senate and governors Results
- 1921 governors Results
- 1920 President, Senate and governors Results
- 1919 governors Results
- 1918 Senate and governors Results
- 1917 governors Results
- 1916 President, Senate and governors Results
- 1915 governors Results
- 1914 Senate and governors Results
- 1913 governors Results
- 1912 President and governors Results
- 1911 governors Results
- 1910 governors Results
- 1909 governors Results
- 1908 President and governors Results
- 1907 governors Results
- 1906 governors Results
- 1905 governors Results
- 1904 President and governors Results
- 1903 governors Results
- 1902 governors Results
- 1901 governors Results
- 1900 President and governors Results
- 1899 governors Results
- 1898 governors Results
- 1897 governors Results
- 1896 President and governors Results
- 1895 governors Results
- 1894 governors Results
- 1893 governors Results
- 1892 President and governors Results
- 1891 governors Results
- 1890 governors Results
- 1889 governors Results
- 1888 President and governors Results
- 1887 governors Results
- 1886 governors Results
- 1885 governors Results
- 1884 President and governors Results
- 1883 governors Results
- 1882 governors Results
- 1881 governors Results
- 1880 President and governors Results
- 1879 governors Results
- 1878 governors Results
- 1877 governors Results
- 1876 President and governors Results
- 1875 governors Results
- 1874 governors Results
- 1873 governors Results
- 1872 President and governors Results
- 1871 governors Results
- 1870 governors Results
- 1869 governors Results
- 1868 President and governors Results
- 1867 governors Results
- 1866 governors Results
- 1865 governors Results
Live results
On election night we read the official results feeds of 26 states straight from their election offices, every few minutes, and show each Senate, governor and House race's count against the vote we expect there. A live model turns the count into a chance for each race and for control of each chamber, updated with every read, and we call a race once we are 97% sure of the winner. Our calls are our judgement; the states certify the results, weeks later.
Senate
House
Governors
Updated 12:27 pm ET
Unofficial counts from the states' own results feeds until the states certify. A race is won here once we have called it (97% sure on the count) or its count is in. Counties' share counted is against the votes we expect there. Shift is against each place's 2024 presidential margin. Boundaries: US Census Bureau.
How to use this map
- Every state is colored by who won or leads the race. Click or tap a state to zoom in to its counties (or, for the House, its districts) and see the count.
- Switch between the Senate, House and governor races.
- Choose what the colors mean: the winner, the size of the lead, a gradient from blue to red, or how far each place moved since 2024.
- The races still counting and the closest ones. Click one to fly to it.
- The seats won so far and the count for the state you picked.
Seats that changed hands 12 of the 67 Senate and governor races decided so far
The other 55 decided races
Live results are switched off; the last figures read are shown. Last read 5 min ago.
Senate control, live
Before the count: Democrats 83%, Republicans 15%.
House majority, live
Before the count: Democrats 90%. Based on 487 races with votes counted; races with nothing counted keep our forecast, moved by half the swing seen so far (D+3.6).
Our calls
We call a race once its polls have closed and we are 97% sure of the winner: from the count once it starts, or from our forecast for the seats that were never close. Races with no count yet move by half the swing the counted races show against our forecast. Every chance updates with each read of the feeds; if one falls back under 97%, the call is withdrawn and shown as such. Unofficial until certified.
House
Called: the Democrats win the House (over 99%)
Senate
Called: the Democrats control the Senate (over 99%)
- Senate called: 20 Democratic, 13 Republican; 2 still open or too close
- House called: 254 Democratic, 166 Republican; 15 still open or too close
- Governors called: 22 Democratic, 12 Republican; 2 still open or too close
Too close to call 19
- North Carolina's 5th district Republican 52% call withdrawn
- Tennessee's 4th district Democrat 55%
- Minnesota's 1st district Democrat 56% call withdrawn
- Mississippi Senate Democrat 58%
- North Carolina's 3rd district Republican 61%
- Alaska Senate Democrat 64%
- Alaska's at-large district Republican 75%
- Florida's 27th district Republican 82% call withdrawn
- Florida's 7th district Republican 85% call withdrawn
- Florida's 9th district Democrat 85% call withdrawn
- Colorado's 4th district Democrat 85% call withdrawn
- Kansas governor Democrat 88%
- Washington's 5th district Republican 89% call withdrawn
- California's 23rd district Republican 93% call withdrawn
- Florida's 26th district Republican 94% call withdrawn
- North Carolina's 7th district Republican 94% call withdrawn
- Florida's 13th district Republican 95% call withdrawn
- Maine's 2nd district Republican over 99%
- Alaska governor Democrat over 99%
Latest calls
- North Carolina's 1st district: Democrat over 99%, 12:16 pm ET
- North Carolina's 6th district: Democrat over 99%, 12:16 pm ET
- North Carolina's 8th district: Republican over 99%, 12:16 pm ET
- North Carolina's 9th district: Democrat over 99%, 12:16 pm ET
- North Carolina's 10th district: Republican 99%, 12:16 pm ET
- North Carolina's 13th district: Democrat over 99%, 12:16 pm ET
- North Carolina's 14th district: Democrat over 99%, 12:16 pm ET
- Indiana's 5th district: Democrat over 99%, 12:06 pm ET
- Arkansas's 2nd district: Republican over 99%, 11:32 am ET
- Virginia's 5th district: Republican over 99%, 11:26 am ET
- Arizona's 2nd district: Republican 99%, 11:21 am ET
- Colorado's 3rd district: Republican 97%, 11:21 am ET
Senate 35
| Race | Votes counted | Of expected vote | Count | Live chance | Call | Feed time |
|---|---|---|---|---|---|---|
| Mississippi Senate | 953,314 | 97% 97 of 100 units |
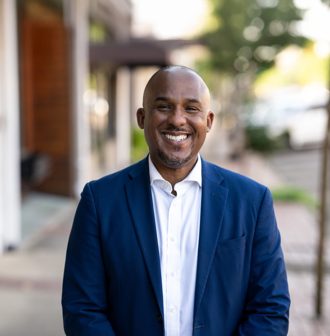 Scott Colom (Democrat) leading by 0.3 pts |
Democrat 58% | too close | updated 11:42 AM ET (16:42 UTC, 9 Nov) as reported by AP (as published on the BBC's resul [aligned] |
| Alaska Senate | 213,733 | 74% 74 of 100 units |
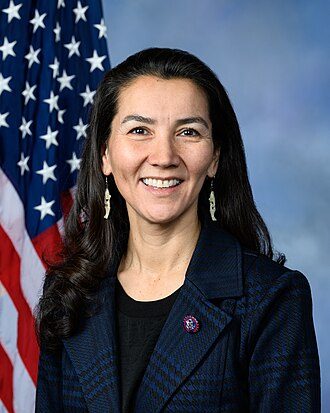 Mary Peltola (Democrat) leading by 0.3 pts |
Democrat 64% | too close | updated 12:07 PM ET (17:07 UTC, 9 Nov) as reported by AP (as published on the BBC's resul [aligned] |
| Louisiana Senate | 1,466,087 | 99% 99 of 100 units |
 Julia Letlow (Republican) leading by 1.8 pts |
Republican over 99% | Republican | updated 12:06 PM ET (17:06 UTC, 9 Nov) as reported by AP (as published on the BBC's resul [aligned] |
| Idaho Senate | 710,724 | 60% 44 of 44 units |
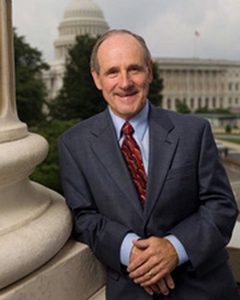 Jim Risch (Republican) leading by 23 pts |
Republican over 99% | Republican | updated 12:11 PM ET (17:11 UTC, 9 Nov) |
| Florida Senate (special) | 8,276,953 | 99% 99 of 100 units |
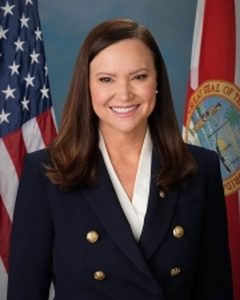 Ashley Moody (Republican) leading by 2.9 pts |
Republican over 99% | Republican | updated 11:51 AM ET (16:51 UTC, 9 Nov) as reported by AP (as published on the BBC's resul [aligned] |
| Alabama Senate | 1,676,659 | 99% 99 of 100 units |
 Barry Moore (Republican) leading by 9.4 pts |
Republican over 99% | Republican | updated 12:23 PM ET (17:23 UTC, 9 Nov) as reported by AP (as published on the BBC's resul [aligned] |
| Arkansas Senate | 886,159 | over 99% 2768 of 2768 units |
 Tom Cotton (Republican) leading by 12 pts |
Republican over 99% | Republican | updated 11:43 AM ET (16:43 UTC, 9 Nov) |
| Colorado Senate | 2,662,053 | 98% 98 of 100 units |
 John Hickenlooper (Democrat) leading by 25 pts |
Democrat over 99% | Democrat | updated 11:43 AM ET (16:43 UTC, 9 Nov) as reported by AP (as published on the BBC's resul [aligned] |
| Delaware Senate | 378,111 | 99% 99 of 100 units |
 Chris Coons (Democrat) leading by 27 pts |
Democrat over 99% | Democrat | updated 10:08 AM ET (15:08 UTC, 6 Nov) as reported by AP (as published on the BBC's resul [aligned] |
| Georgia Senate | 4,180,275 | over 99% 159 of 159 units |
 Jon Ossoff (Democrat) leading by 18 pts |
Democrat over 99% | Democrat | updated 8:50 AM ET (13:50 UTC, 9 Nov) |
| Iowa Senate | 1,361,644 | 99% 99 of 100 units |
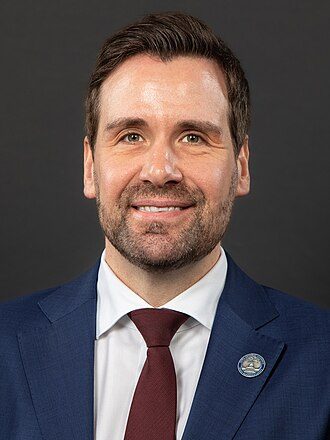 Josh Turek (Democrat) leading by 4.2 pts |
Democrat over 99% | Democrat | updated 11:57 AM ET (16:57 UTC, 9 Nov) as reported by AP (as published on the BBC's results page) |
| Illinois Senate | 4,076,979 | 96% 96 of 100 units |
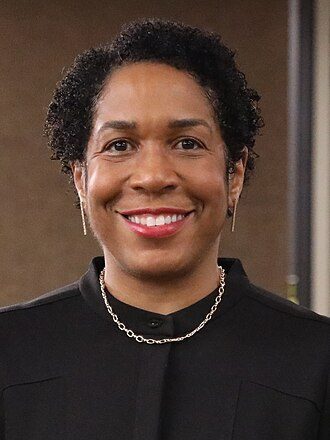 Juliana Stratton (Democrat) leading by 24 pts |
Democrat over 99% | Democrat | updated 10:05 AM ET (15:05 UTC, 9 Nov) as reported by AP (as published on the BBC's resul [aligned] |
| Kansas Senate | 1,099,896 | 99% 99 of 100 units |
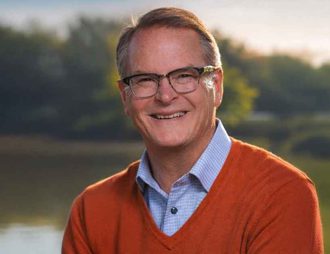 Adam Hamilton (Democrat) leading by 5.1 pts |
Democrat over 99% | Democrat | updated 12:17 PM ET (17:17 UTC, 9 Nov) as reported by AP (as published on the BBC's resul [aligned] |
| Kentucky Senate | 1,427,118 | 97% 99 of 100 units |
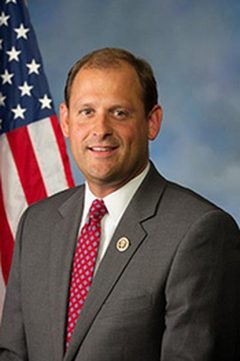 Andy Barr (Republican) leading by 12 pts |
Republican over 99% | Republican | updated 5:04 PM ET (22:04 UTC, 7 Nov) as reported by AP (as published on the BBC's resul [aligned] |
| Massachusetts Senate | 2,604,303 | 99% 99 of 100 units |
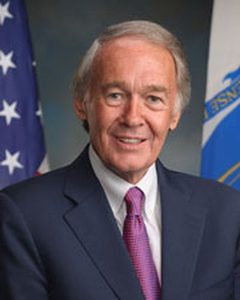 Edward Markey (Democrat) leading by 31 pts |
Democrat over 99% | Democrat | updated 12:02 PM ET (17:02 UTC, 9 Nov) as reported by AP (as published on the BBC's resul [aligned] |
| Maine Senate | 709,565 | 97% 97 of 100 units |
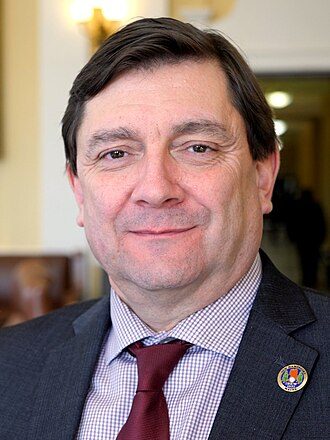 Troy Jackson (Democrat) leading by 6.3 pts |
Democrat over 99% | Democrat | updated 12:23 PM ET (17:23 UTC, 9 Nov) as reported by AP (as published on the BBC's resul [aligned] |
| Michigan Senate | 4,796,991 | 98% 98 of 100 units |
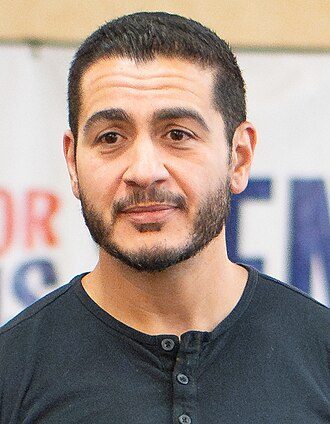 Abdul El-Sayed (Democrat) leading by 7.1 pts |
Democrat over 99% | Democrat | updated 12:05 PM ET (17:05 UTC, 9 Nov) as reported by AP (as published on the BBC's resul [aligned] |
| Minnesota Senate | 2,831,458 | over 99% 4105 of 4105 units |
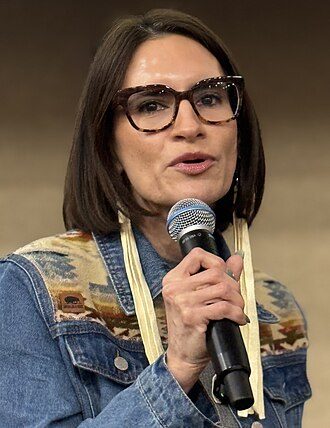 Peggy Flanagan (Democrat) leading by 10 pts |
Democrat over 99% | Democrat | updated 12:18 PM ET (17:18 UTC, 9 Nov) |
| Montana Senate | 482,014 | 98% 98 of 100 units |
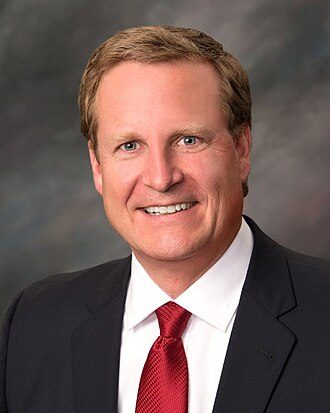 Kurt Alme (Republican) leading by 11 pts |
Republican over 99% | Republican | updated 5:26 PM ET (22:26 UTC, 6 Nov) as reported by AP (as published on the BBC's resul [aligned] |
| North Carolina Senate | 4,203,168 | over 99% 2626 of 2626 units |
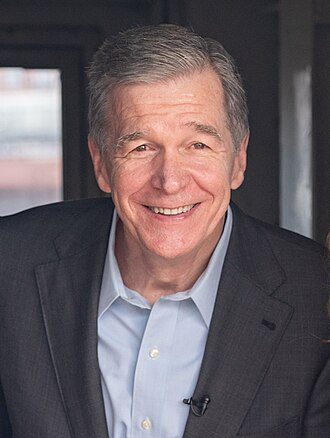 Roy Cooper (Democrat) leading by 20 pts |
Democrat over 99% | Democrat | updated 12:10 PM ET (17:10 UTC, 9 Nov) |
| Nebraska Senate | 754,367 | over 99% 1322 of 1322 units |
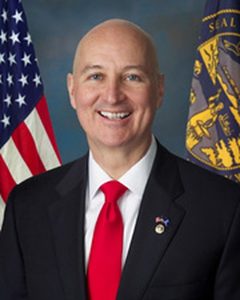 Pete Ricketts (Republican) leading by 6.2 pts |
Republican over 99% | Republican | file made 12:24 PM ET (17:24 UTC, 9 Nov) |
| New Hampshire Senate | 636,125 | 99% 99 of 100 units |
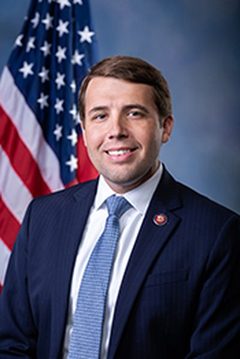 Chris Pappas (Democrat) leading by 14 pts |
Democrat over 99% | Democrat | updated 12:20 PM ET (17:20 UTC, 9 Nov) as reported by AP (as published on the BBC's resul [aligned] |
| New Jersey Senate | 2,922,463 | 94% 96 of 100 units |
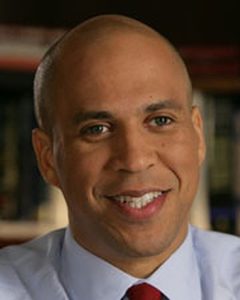 Cory Booker (Democrat) leading by 27 pts |
Democrat over 99% | Democrat | updated 9:54 AM ET (14:54 UTC, 9 Nov) as reported by AP (as published on the BBC's resul [aligned] |
| New Mexico Senate | 725,190 | 98% 98 of 100 units |
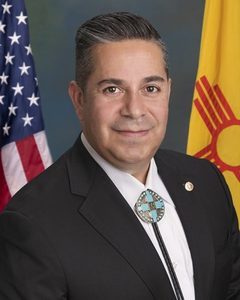 Ben Lujan (Democrat) leading by 27 pts |
Democrat over 99% | Democrat | updated 3:35 PM ET (20:35 UTC, 6 Nov) as reported by AP (as published on the BBC's resul [aligned] |
| Ohio Senate (special) | 4,601,571 | 98% 98 of 100 units |
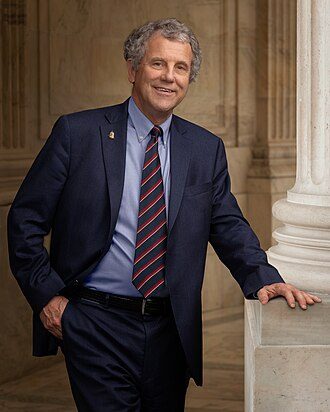 Sherrod Brown (Democrat) leading by 4.9 pts |
Democrat over 99% | Democrat | updated 4:33 PM ET (21:33 UTC, 6 Nov) as reported by AP (as published on the BBC's resul [aligned] |
| Oklahoma Senate | 1,117,932 | 97% 99 of 100 units |
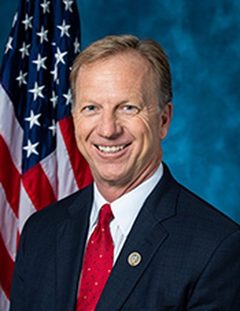 Kevin Hern (Republican) leading by 18 pts |
Republican over 99% | Republican | updated 7:28 PM ET (00:28 UTC, 6 Nov) as reported by AP (as published on the BBC's resul [aligned] |
| Oregon Senate | 1,862,634 | 92% 92 of 100 units |
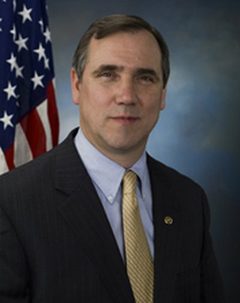 Jeff Merkley (Democrat) leading by 19 pts |
Democrat over 99% | Democrat | updated 10:25 AM ET (15:25 UTC, 9 Nov) as reported by AP (as published on the BBC's resul [aligned] |
| Rhode Island Senate | 359,645 | 98% 98 of 100 units |
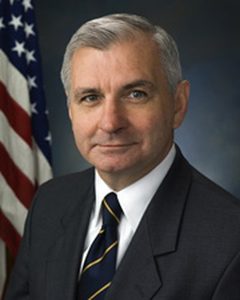 John Reed (Democrat) leading by 37 pts |
Democrat over 99% | Democrat | updated 11:00 AM ET (16:00 UTC, 9 Nov) as reported by AP (as published on the BBC's resul [aligned] |
| South Carolina Senate | 2,040,928 | 99% 99 of 100 units |
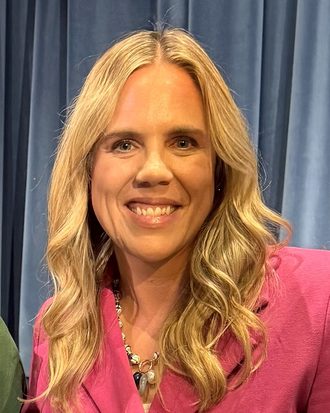 Annie Andrews (Democrat) leading by 4.5 pts |
Democrat over 99% | Democrat | updated 6:23 PM ET (23:23 UTC, 6 Nov) as reported by AP (as published on the BBC's resul [aligned] |
| South Dakota Senate | 305,102 | 87% 671 of 671 units |
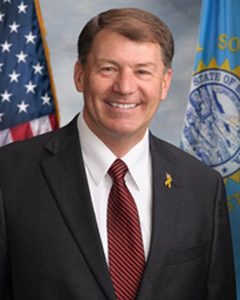 Mike Rounds (Republican) leading by 21 pts |
Republican over 99% | Republican | file made 12:25 PM ET (17:25 UTC, 9 Nov) |
| Tennessee Senate | 2,066,890 | 93% 99 of 100 units |
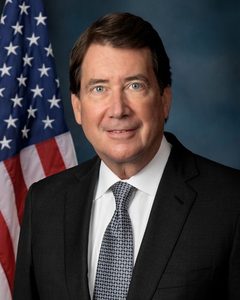 Bill Hagerty (Republican) leading by 12 pts |
Republican over 99% | Republican | updated 9:11 AM ET (14:11 UTC, 6 Nov) as reported by AP (as published on the BBC's resul [aligned] |
| Texas Senate | 9,888,056 | 99% 99 of 100 units |
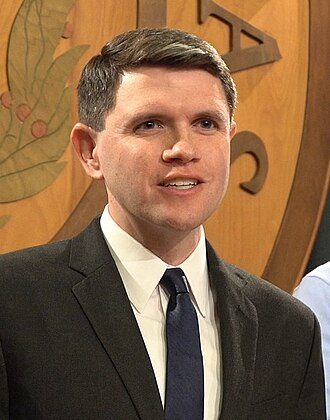 James Talarico (Democrat) leading by 12 pts |
Democrat over 99% | Democrat | updated 11:34 AM ET (16:34 UTC, 9 Nov) as reported by AP (as published on the BBC's resul [aligned] |
| Virginia Senate | 3,595,288 | over 99% 133 of 133 units |
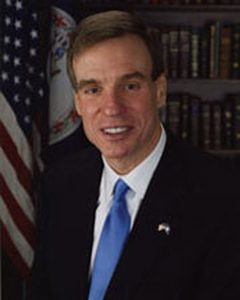 Mark R. Warner (Democrat) leading by 23 pts |
Democrat over 99% | Democrat | updated 12:24 PM ET (17:24 UTC, 9 Nov) |
| West Virginia Senate | 456,162 | 82% 99 of 100 units |
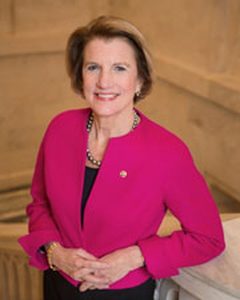 Shelley Capito (Republican) leading by 20 pts |
Republican over 99% | Republican | updated 12:22 PM ET (17:22 UTC, 9 Nov) as reported by AP (as published on the BBC's resul [aligned] |
| Wyoming Senate | 187,254 | 97% 97 of 100 units |
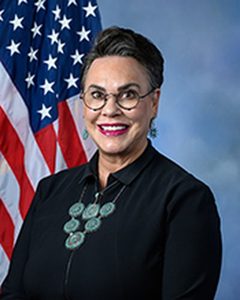 Harriet Hageman (Republican) leading by 30 pts |
Republican over 99% | Republican | updated 3:16 AM ET (08:16 UTC, 8 Nov) as reported by AP (as published on the BBC's resul [aligned] |
Governors 36
| Race | Votes counted | Of expected vote | Count | Live chance | Call | Feed time |
|---|---|---|---|---|---|---|
| Kansas governor | 1,094,862 | 99% 99 of 100 units |
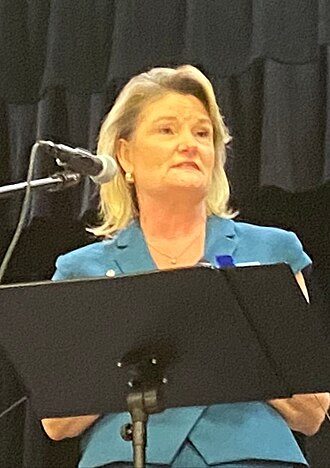 Cindy Holscher (Democrat) leading by 0.7 pts |
Democrat 88% | too close | updated 12:17 PM ET (17:17 UTC, 9 Nov) as reported by AP (as published on the BBC's resul [aligned] |
| Florida governor | 8,266,800 | 99% 99 of 100 units |
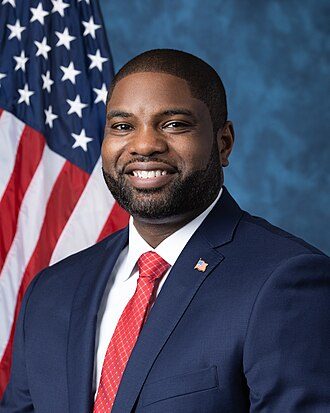 Byron Donalds (Republican) leading by 1.3 pts |
Republican over 99% | Republican | updated 11:51 AM ET (16:51 UTC, 9 Nov) as reported by AP (as published on the BBC's resul [aligned] |
| Tennessee governor | 2,099,975 | 94% 99 of 100 units |
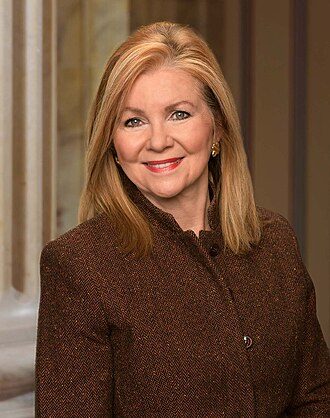 Marsha Blackburn (Republican) leading by 2.5 pts |
Republican over 99% | Republican | updated 9:11 AM ET (14:11 UTC, 6 Nov) as reported by AP (as published on the BBC's resul [aligned] |
| Idaho governor | 715,182 | 60% 44 of 44 units |
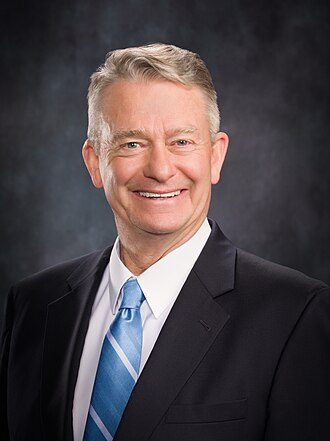 Brad Little (Republican) leading by 25 pts |
Republican over 99% | Republican | updated 12:11 PM ET (17:11 UTC, 9 Nov) |
| Alabama governor | 1,679,602 | 99% 99 of 100 units |
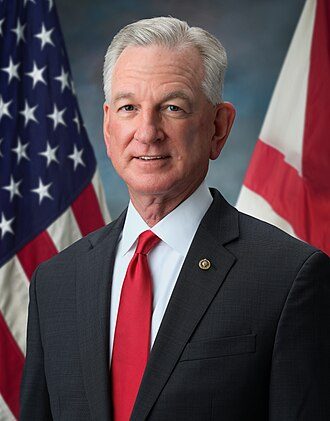 Thomas Tuberville (Republican) leading by 4.0 pts |
Republican over 99% | Republican | updated 12:23 PM ET (17:23 UTC, 9 Nov) as reported by AP (as published on the BBC's resul [aligned] |
| Alaska governor | 211,337 | 74% 74 of 100 units |
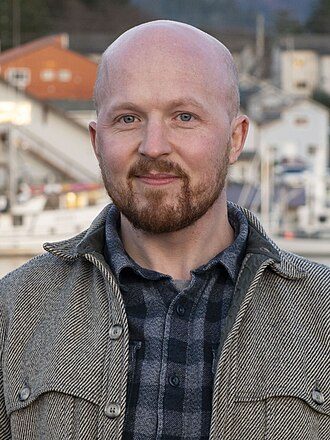 Jonathan Kreiss-Tomkins (Democrat) leading by 20 pts |
Democrat over 99% | too close | updated 12:07 PM ET (17:07 UTC, 9 Nov) as reported by AP (as published on the BBC's resul [aligned] |
| Arkansas governor | 886,097 | over 99% 2768 of 2768 units |
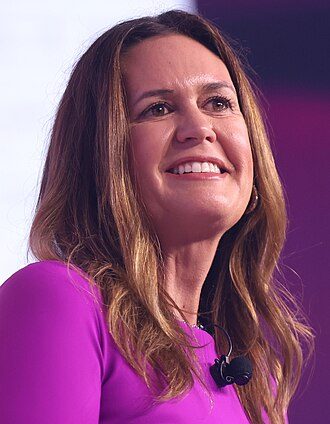 Sarah Huckabee Sanders (Republican) leading by 15 pts |
Republican over 99% | Republican | updated 11:43 AM ET (16:43 UTC, 9 Nov) |
| Arizona governor | 2,547,672 | 98% 98 of 100 units |
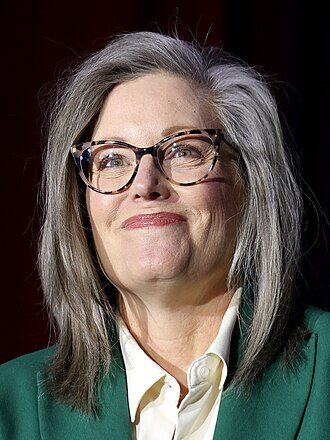 Katie Hobbs (Democrat) leading by 13 pts |
Democrat over 99% | Democrat | updated 12:03 PM ET (17:03 UTC, 9 Nov) as reported by AP (as published on the BBC's resul [aligned] |
| California governor | 10,482,746 | 77% 23860 of 23860 units |
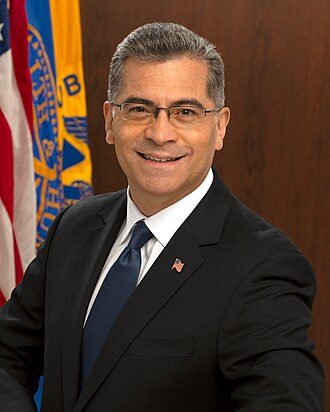 Xavier Becerra (Democrat) leading by 31 pts |
Democrat over 99% | Democrat | updated 10:43 AM ET (15:43 UTC, 9 Nov) |
| Colorado governor | 2,649,874 | 98% 98 of 100 units |
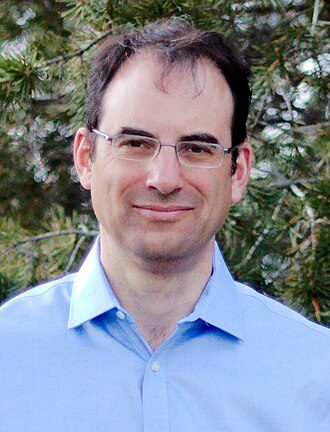 Phil Weiser (Democrat) leading by 28 pts |
Democrat over 99% | Democrat | updated 11:43 AM ET (16:43 UTC, 9 Nov) as reported by AP (as published on the BBC's results page) |
| Connecticut governor | 1,295,963 | 98% | 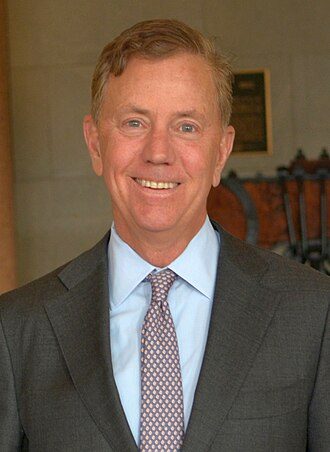 Ned Lamont (Democrat) leading by 19 pts |
Democrat over 99% | Democrat | updated 12:27 PM ET (17:27 UTC, 9 Nov) |
| Georgia governor | 4,182,507 | over 99% 159 of 159 units |
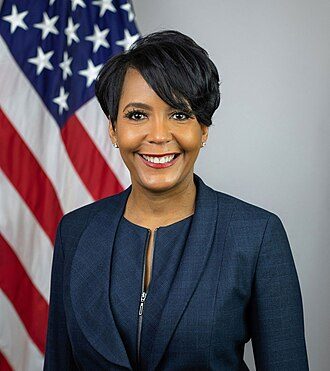 Keisha Lance Bottoms (Democrat) leading by 8.7 pts |
Democrat over 99% | Democrat | updated 8:50 AM ET (13:50 UTC, 9 Nov) |
| Hawaii governor | 383,578 | 93% 99 of 100 units |
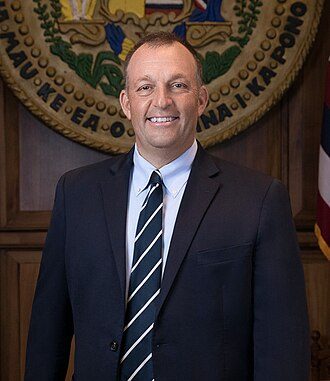 Josh Green (Democrat) leading by 45 pts |
Democrat over 99% | Democrat | updated 3:02 PM ET (20:02 UTC, 6 Nov) as reported by AP (as published on the BBC's resul [aligned] |
| Iowa governor | 1,367,206 | 99% 99 of 100 units |
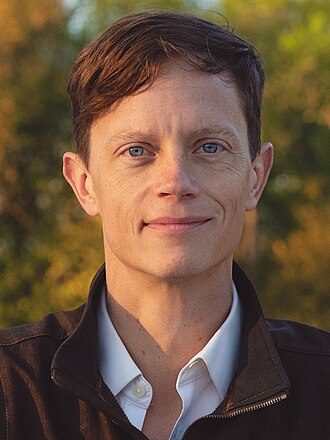 Rob Sand (Democrat) leading by 11 pts |
Democrat over 99% | Democrat | updated 11:57 AM ET (16:57 UTC, 9 Nov) as reported by AP (as published on the BBC's results page) |
| Illinois governor | 4,091,178 | 96% 96 of 100 units |
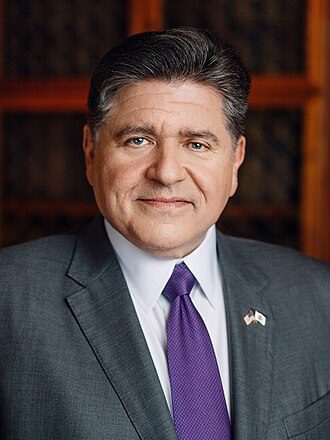 JB Pritzker (Democrat) leading by 24 pts |
Democrat over 99% | Democrat | updated 10:05 AM ET (15:05 UTC, 9 Nov) as reported by AP (as published on the BBC's resul [aligned] |
| Massachusetts governor | 2,623,012 | 99% 99 of 100 units |
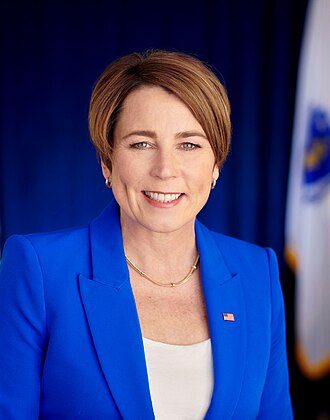 Maura Healey (Democrat) leading by 27 pts |
Democrat over 99% | Democrat | updated 12:02 PM ET (17:02 UTC, 9 Nov) as reported by AP (as published on the BBC's resul [aligned] |
| Maryland governor | 2,049,030 | 87% 87 of 100 units |
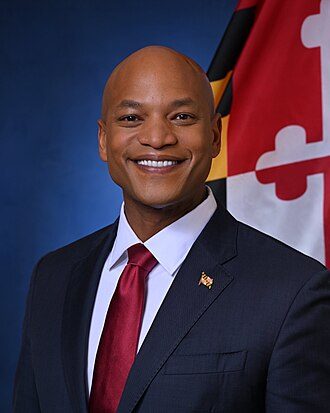 Wes Moore (Democrat) leading by 32 pts |
Democrat over 99% | Democrat | updated 10:56 AM ET (15:56 UTC, 9 Nov) as reported by AP (as published on the BBC's resul [aligned] |
| Maine governor | 713,514 | 97% 97 of 100 units |
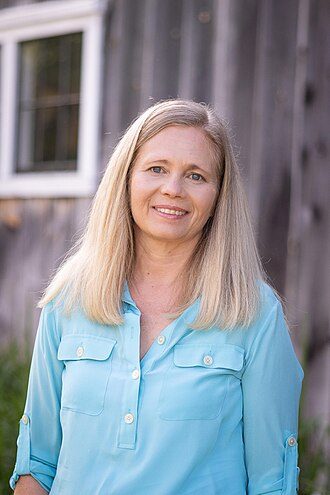 Hannah Pingree (Democrat) leading by 17 pts |
Democrat over 99% | Democrat | updated 12:23 PM ET (17:23 UTC, 9 Nov) as reported by AP (as published on the BBC's resul [aligned] |
| Michigan governor | 4,790,691 | 98% 98 of 100 units |
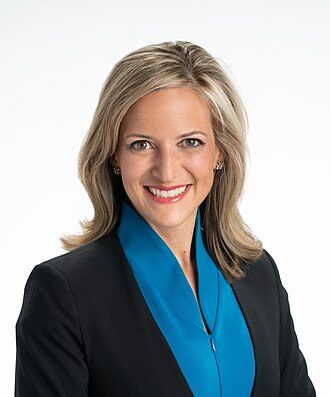 Jocelyn Benson (Democrat) leading by 11 pts |
Democrat over 99% | Democrat | updated 12:05 PM ET (17:05 UTC, 9 Nov) as reported by AP (as published on the BBC's resul [aligned] |
| Minnesota governor | 2,830,159 | 99% 99 of 100 units |
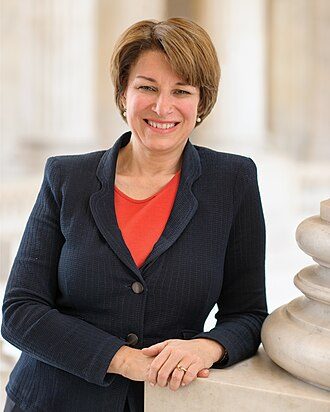 Amy Klobuchar (Democrat) leading by 13 pts |
Democrat over 99% | Democrat | updated 3:00 AM ET (08:00 UTC, 8 Nov) as reported by AP (as published on the BBC's resul [aligned] |
| Nebraska governor | 755,863 | over 99% 1322 of 1322 units |
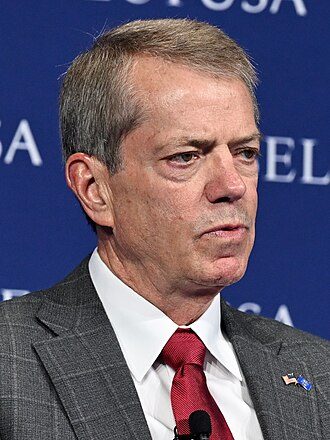 Jim Pillen and Joe Kelly (Republican) leading by 8.0 pts |
Republican over 99% | Republican | file made 12:24 PM ET (17:24 UTC, 9 Nov) |
| New Hampshire governor | 631,784 | 99% 99 of 100 units |
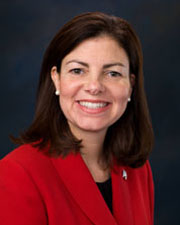 Kelly Ayotte (Republican) leading by 4.3 pts |
Republican over 99% | Republican | updated 12:05 PM ET (17:05 UTC, 9 Nov) as reported by AP (as published on the BBC's resul [aligned] |
| New Mexico governor | 725,612 | 98% 98 of 100 units |
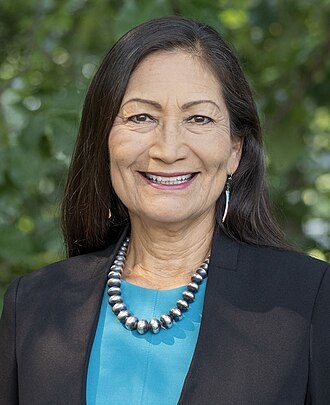 Deb Haaland (Democrat) leading by 15 pts |
Democrat over 99% | Democrat | updated 3:35 PM ET (20:35 UTC, 6 Nov) as reported by AP (as published on the BBC's resul [aligned] |
| Nevada governor | 1,089,636 | 98% 98 of 100 units |
Aaron Ford (Democrat) leading by 7.6 pts | Democrat over 99% | Democrat | updated 9:03 PM ET (02:03 UTC, 8 Nov) as reported by AP (as published on the BBC's resul [aligned] |
| New York governor | 6,097,824 | 93% 93 of 100 units |
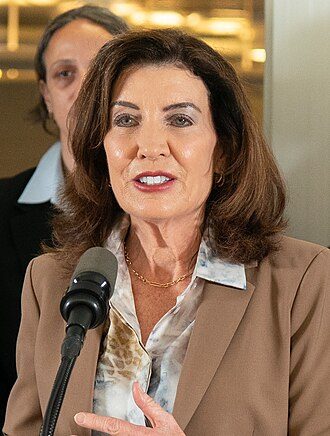 Kathy Hochul (Democrat) leading by 20 pts |
Democrat over 99% | Democrat | updated 11:57 AM ET (16:57 UTC, 9 Nov) as reported by AP (as published on the BBC's resul [aligned] |
| Ohio governor | 4,595,782 | 98% 98 of 100 units |
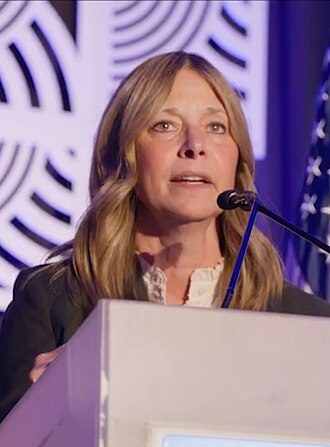 Amy Acton (Democrat) leading by 7.9 pts |
Democrat over 99% | Democrat | updated 4:33 PM ET (21:33 UTC, 6 Nov) as reported by AP (as published on the BBC's resul [aligned] |
| Oklahoma governor | 1,120,139 | 97% 99 of 100 units |
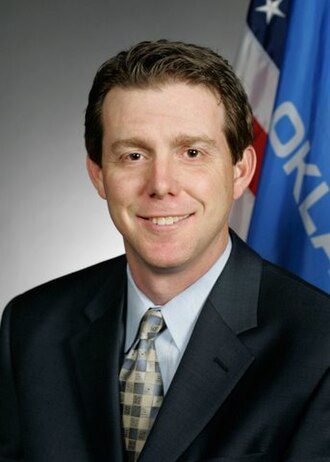 Mike Mazzei (Republican) leading by 6.0 pts |
Republican over 99% | Republican | updated 7:28 PM ET (00:28 UTC, 6 Nov) as reported by AP (as published on the BBC's resul [aligned] |
| Oregon governor | 1,875,722 | 92% 92 of 100 units |
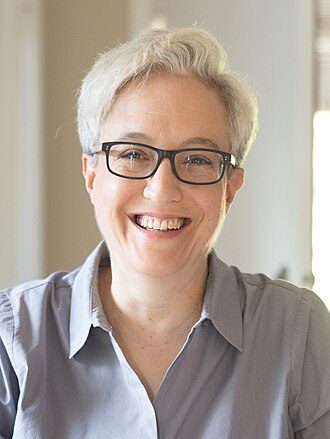 Tina Kotek (Democrat) leading by 9.6 pts |
Democrat over 99% | Democrat | updated 10:25 AM ET (15:25 UTC, 9 Nov) as reported by AP (as published on the BBC's resul [aligned] |
| Pennsylvania governor | 4,989,023 | 93% 99 of 100 units |
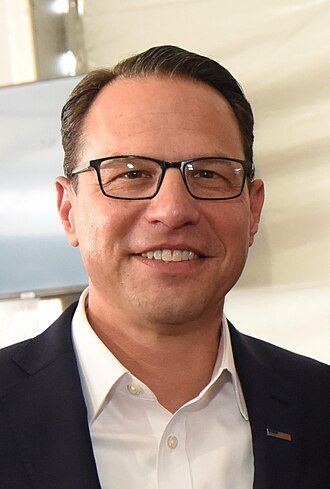 Josh Shapiro (Democrat) leading by 22 pts |
Democrat over 99% | Democrat | updated 12:09 PM ET (17:09 UTC, 9 Nov) as reported by AP (as published on the BBC's resul [aligned] |
| Rhode Island governor | 359,223 | 98% 98 of 100 units |
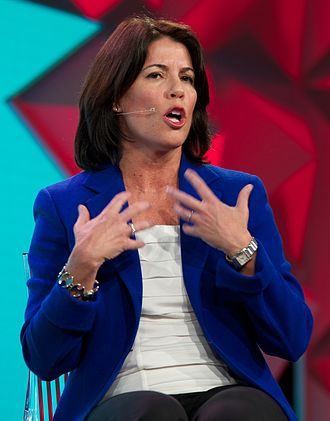 Helena Foulkes (Democrat) leading by 30 pts |
Democrat over 99% | Democrat | updated 11:00 AM ET (16:00 UTC, 9 Nov) as reported by AP (as published on the BBC's resul [aligned] |
| South Carolina governor | 2,037,662 | 99% 99 of 100 units |
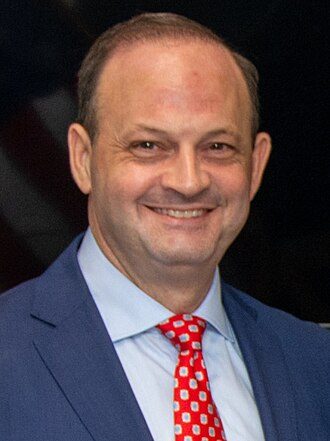 Alan Wilson (Republican) leading by 4.5 pts |
Republican over 99% | Republican | updated 6:23 PM ET (23:23 UTC, 6 Nov) as reported by AP (as published on the BBC's resul [aligned] |
| South Dakota governor | 304,495 | 87% 671 of 671 units |
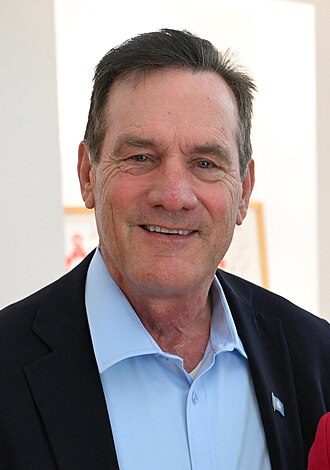 Larry Rhoden and Tony Venhuizen (Republican) leading by 27 pts |
Republican over 99% | Republican | file made 12:25 PM ET (17:25 UTC, 9 Nov) |
| Texas governor | 9,906,766 | 99% 99 of 100 units |
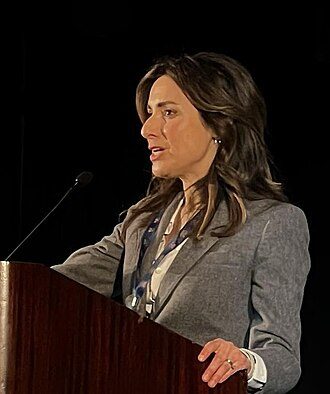 Gina Hinojosa (Democrat) leading by 7.1 pts |
Democrat over 99% | Democrat | updated 11:34 AM ET (16:34 UTC, 9 Nov) as reported by AP (as published on the BBC's resul [aligned] |
| Vermont governor | 308,657 | 99% 283 of 283 units |
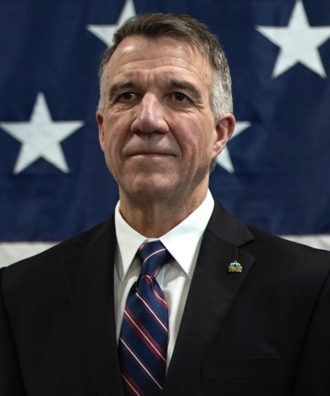 Phil Scott (Republican) leading by 6.6 pts |
Republican over 99% | Republican | file made 7:23 AM ET (12:23 UTC, 9 Nov) |
| Wisconsin governor | 2,668,669 | 99% 99 of 100 units |
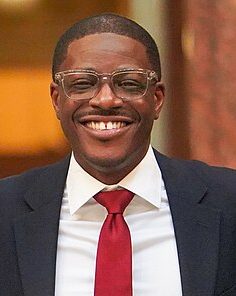 David Crowley (Democrat) leading by 8.0 pts |
Democrat over 99% | Democrat | updated 9:52 AM ET (14:52 UTC, 9 Nov) as reported by AP (as published on the BBC's resul [aligned] |
| Wyoming governor | 187,387 | 97% 97 of 100 units |
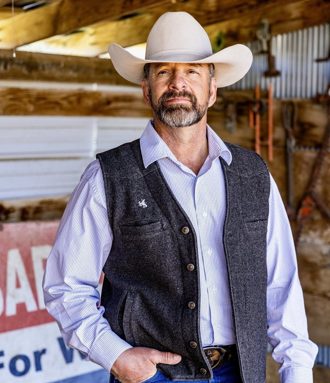 Eric Barlow (Republican) leading by 52 pts |
Republican over 99% | Republican | updated 3:16 AM ET (08:16 UTC, 8 Nov) as reported by AP (as published on the BBC's resul [aligned] |
House 434
| Race | Votes counted | Of expected vote | Count | Live chance | Call | Feed time |
|---|---|---|---|---|---|---|
| North Carolina's 5th district | 285,498 | 99% 230 of 230 units |
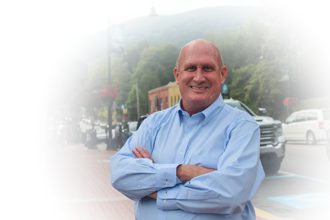 Level |
Republican 52% | withdrawn | updated 12:10 PM ET (17:10 UTC, 9 Nov) |
| Tennessee's 4th district | 195,576 | 99% 99 of 100 units |
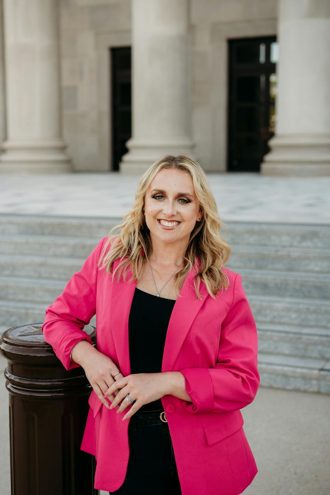 Victoria Broderick (Democrat) leading by 0.1 pts |
Democrat 55% | too close | updated 9:10 AM ET (14:10 UTC, 6 Nov) as reported by AP (as published on the BBC's results page) |
| Minnesota's 1st district | 326,179 | 99% 750 of 750 units |
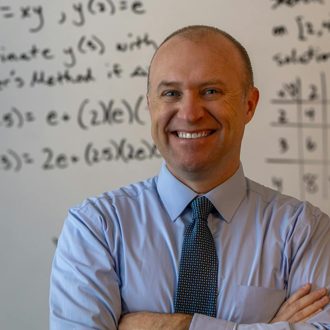 Jake Johnson (Democrat) leading by 0.1 pts |
Democrat 56% | withdrawn | updated 12:18 PM ET (17:18 UTC, 9 Nov) |
| North Carolina's 3rd district | 237,904 | 99% 190 of 190 units |
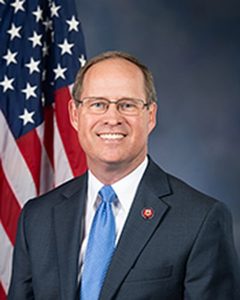 Greg Murphy (Republican) leading by 0.1 pts |
Republican 61% | too close | updated 12:10 PM ET (17:10 UTC, 9 Nov) |
| Alaska's at-large district | 213,009 | 74% 74 of 100 units |
 Nick Begich (Republican) leading by 9.2 pts |
Republican 75% | too close | updated 12:07 PM ET (17:07 UTC, 9 Nov) as reported by AP (as published on the BBC's results page) |
| Florida's 27th district | 247,966 | 99% 99 of 100 units |
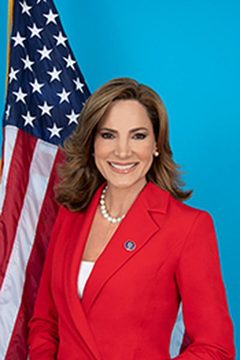 Maria Elvira Salazar (Republican) leading by 0.4 pts |
Republican 82% | withdrawn | updated 7:57 PM ET (00:57 UTC, 6 Nov) as reported by AP (as published on the BBC's resul [aligned] |
| Florida's 7th district | 324,454 | 99% 99 of 100 units |
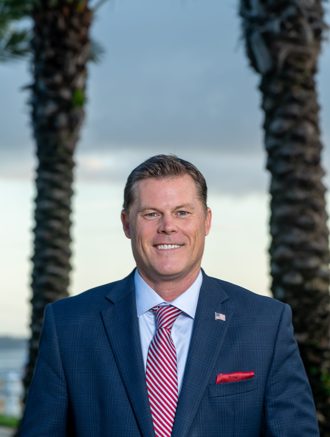 Ryan Elijah (Republican) leading by 0.5 pts |
Republican 85% | withdrawn | updated 6:12 PM ET (23:12 UTC, 6 Nov) as reported by AP (as published on the BBC's resul [aligned] |
| Florida's 9th district | 285,115 | 99% 99 of 100 units |
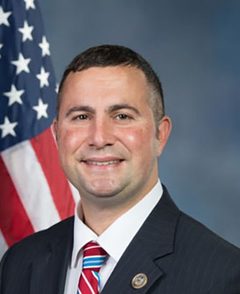 Darren Soto (Democrat) leading by 0.5 pts |
Democrat 85% | withdrawn | updated 6:12 PM ET (23:12 UTC, 6 Nov) as reported by AP (as published on the BBC's resul [aligned] |
| Colorado's 4th district | 381,214 | 97% 97 of 100 units |
 Eileen Laubacher (Democrat) leading by 0.8 pts |
Democrat 85% | withdrawn | updated 9:42 AM ET (14:42 UTC, 9 Nov) as reported by AP (as published on the BBC's resul [aligned] |
| Washington's 5th district | 271,604 | 82% 12 of 12 units |
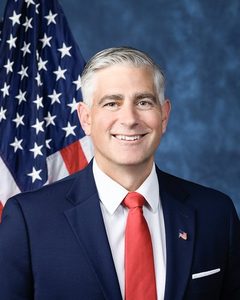 Michael Baumgartner (Republican) leading by 3.4 pts |
Republican 89% | withdrawn | updated 8:04 PM ET (01:04 UTC, 7 Nov) |
| California's 23rd district | 190,836 | 85% 1324 of 1324 units |
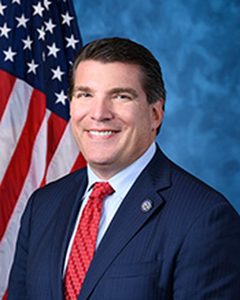 Jay Obernolte (Republican) leading by 2.8 pts |
Republican 93% | withdrawn | updated 10:43 AM ET (15:43 UTC, 9 Nov) |
| Florida's 26th district | 229,804 | 99% 99 of 100 units |
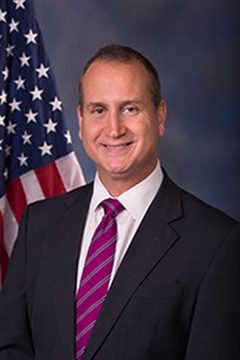 Mario Diaz-Balart (Republican) leading by 0.7 pts |
Republican 94% | withdrawn | updated 7:53 PM ET (00:53 UTC, 6 Nov) as reported by AP (as published on the BBC's results page) |
| North Carolina's 7th district | 320,680 | 99% 183 of 183 units |
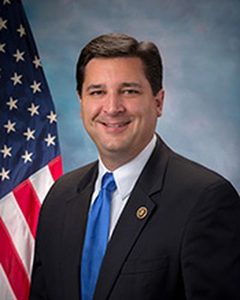 David Rouzer (Republican) leading by 0.8 pts |
Republican 94% | withdrawn | updated 12:10 PM ET (17:10 UTC, 9 Nov) |
| Florida's 13th district | 313,669 | 99% 99 of 100 units |
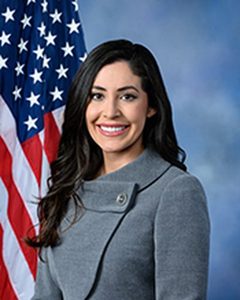 Anna Luna (Republican) leading by 0.8 pts |
Republican 95% | withdrawn | updated 6:12 PM ET (23:12 UTC, 6 Nov) as reported by AP (as published on the BBC's resul [aligned] |
| Colorado's 3rd district | 332,044 | 95% 95 of 100 units |
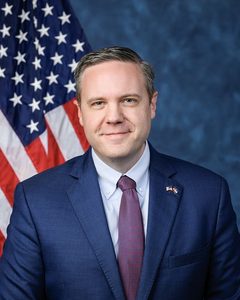 Jeff Hurd (Republican) leading by 1.8 pts |
Republican 97% | Republican | updated 9:41 AM ET (14:41 UTC, 9 Nov) as reported by AP (as published on the BBC's resul [aligned] |
| South Carolina's 1st district | 326,423 | 99% 99 of 100 units |
 Nancy Lacore (Democrat) leading by 1.0 pts |
Democrat 98% | Democrat | updated 6:51 PM ET (23:51 UTC, 6 Nov) as reported by AP (as published on the BBC's results page) |
| South Carolina's 2nd district | 296,664 | 99% 99 of 100 units |
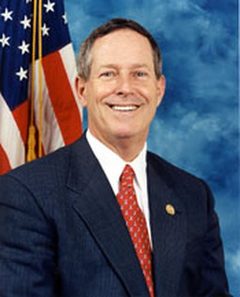 Joe Wilson (Republican) leading by 1.0 pts |
Republican 98% | Republican | updated 6:21 PM ET (23:21 UTC, 6 Nov) as reported by AP (as published on the BBC's results page) |
| North Carolina's 10th district | 293,976 | 99% 187 of 187 units |
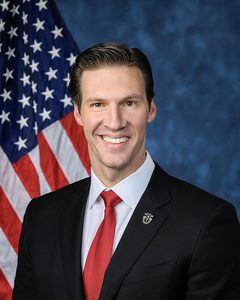 Pat Harrigan (Republican) leading by 1.0 pts |
Republican 99% | Republican | updated 12:10 PM ET (17:10 UTC, 9 Nov) |
| Tennessee's 9th district | 225,614 | 99% 99 of 100 units |
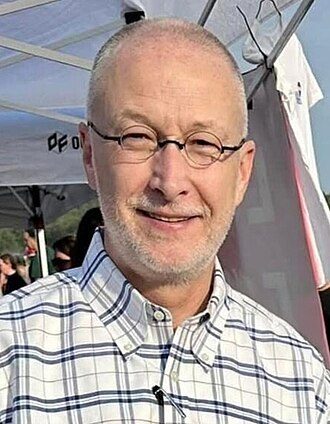 Brent Taylor (Republican) leading by 1.1 pts |
Republican over 99% | Republican | updated 9:10 AM ET (14:10 UTC, 6 Nov) as reported by AP (as published on the BBC's results page) |
| Arizona's 2nd district | 327,651 | 99% 99 of 100 units |
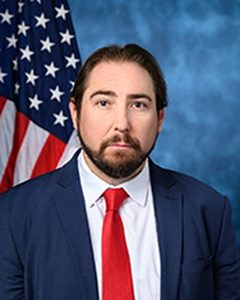 Eli Crane (Republican) leading by 1.2 pts |
Republican over 99% | Republican | updated 12:03 PM ET (17:03 UTC, 9 Nov) as reported by AP (as published on the BBC's results page) |
| Virginia's 1st district | 423,119 | over 99% 18 of 18 units |
 Shannon L. Taylor (Democrat) leading by 1.2 pts |
Democrat over 99% | Democrat | updated 8:21 AM ET (13:21 UTC, 4 Nov) |
| California's 1st district | 176,146 | 61% 788 of 788 units |
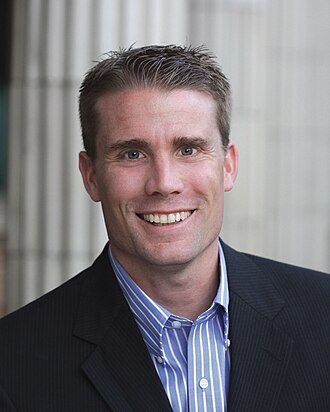 Mike McGuire (Democrat) leading by 10 pts |
Democrat over 99% | Democrat | updated 10:43 AM ET (15:43 UTC, 9 Nov) |
| Oklahoma's 5th district | 264,647 | 99% 99 of 100 units |
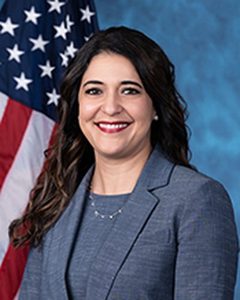 Stephanie Bice (Republican) leading by 1.3 pts |
Republican over 99% | Republican | updated 7:28 PM ET (00:28 UTC, 6 Nov) as reported by AP (as published on the BBC's results page) |
| Michigan's 4th district | 371,374 | 97% 97 of 100 units |
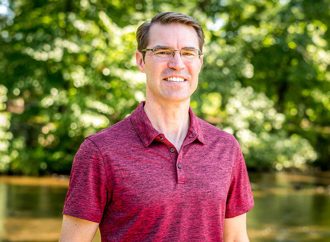 Sean McCann (Democrat) leading by 1.8 pts |
Democrat over 99% | Democrat | updated 12:03 PM ET (17:03 UTC, 9 Nov) as reported by AP (as published on the BBC's results page) |
| Maine's 2nd district | 341,256 | 98% 98 of 100 units |
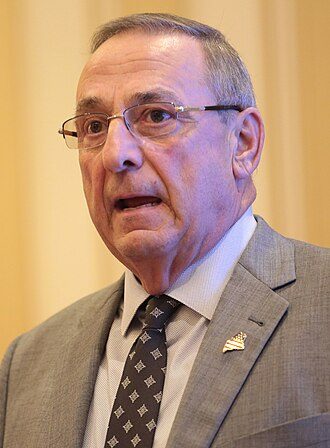 Paul LePage (Republican) leading by 1.6 pts |
Republican over 99% | too close | updated 12:18 PM ET (17:18 UTC, 9 Nov) as reported by AP (as published on the BBC's results page) |
| New York's 21st district | 276,510 | 97% 97 of 100 units |
Anthony Constantino (Republican) leading by 1.9 pts | Republican over 99% | Republican | updated 11:57 AM ET (16:57 UTC, 9 Nov) as reported by AP (as published on the BBC's results page) |
| California's 5th district | 217,533 | 71% 399 of 399 units |
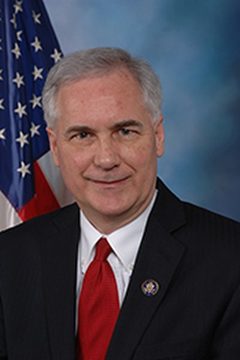 Tom McClintock (Republican) leading by 13 pts |
Republican over 99% | Republican | updated 10:43 AM ET (15:43 UTC, 9 Nov) |
| Ohio's 10th district | 302,016 | 98% 98 of 100 units |
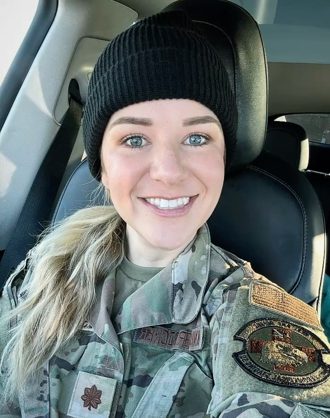 Kristina Knickerbocker (Democrat) leading by 1.6 pts |
Democrat over 99% | Democrat | updated 2:56 PM ET (19:56 UTC, 6 Nov) as reported by AP (as published on the BBC's results page) |
| New York's 1st district | 298,585 | 97% 97 of 100 units |
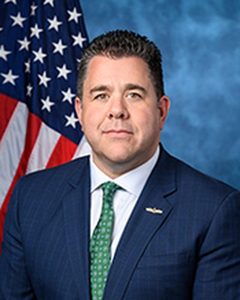 Nicholas LaLota (Republican) leading by 2.2 pts |
Republican over 99% | Republican | updated 12:00 PM ET (17:00 UTC, 5 Nov) as reported by AP (as published on the BBC's results page) |
| Arkansas's 2nd district | 250,548 | 99% 404 of 404 units |
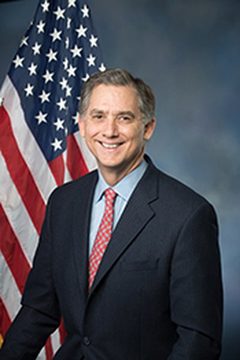 French Hill (Republican) leading by 1.7 pts |
Republican over 99% | Republican | updated 11:43 AM ET (16:43 UTC, 9 Nov) |
| California's 48th district | 192,797 | 62% 692 of 692 units |
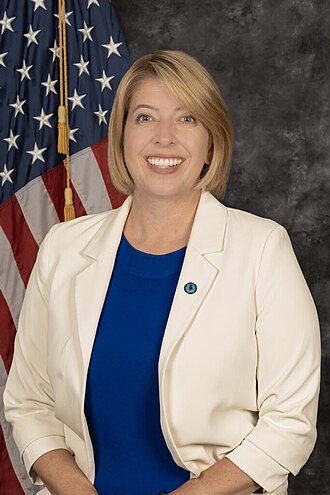 Marni von Wilpert (Democrat) leading by 19 pts |
Democrat over 99% | Democrat | updated 10:43 AM ET (15:43 UTC, 9 Nov) |
| California's 3rd district | 207,168 | 63% 531 of 531 units |
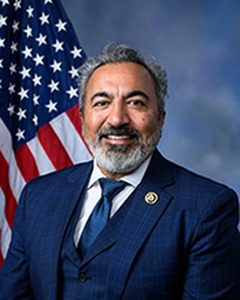 Ami Bera (Democrat) leading by 16 pts |
Democrat over 99% | Democrat | updated 10:43 AM ET (15:43 UTC, 9 Nov) |
| North Carolina's 8th district | 291,899 | 99% 193 of 193 units |
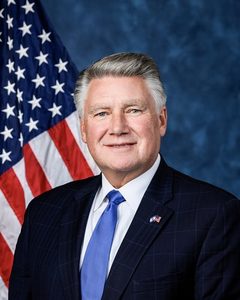 Mark Harris (Republican) leading by 1.8 pts |
Republican over 99% | Republican | updated 12:10 PM ET (17:10 UTC, 9 Nov) |
| New Jersey's 2nd district | 271,153 | 97% 97 of 100 units |
 Zack Mullock (Democrat) leading by 2.7 pts |
Democrat over 99% | Democrat | updated 5:10 PM ET (22:10 UTC, 6 Nov) as reported by AP (as published on the BBC's results page) |
| Virginia's 5th district | 362,649 | 98% 24 of 24 units |
 John J. McGuire III (Republican) leading by 2.0 pts |
Republican over 99% | Republican | updated 12:24 PM ET (17:24 UTC, 9 Nov) |
| California's 49th district | 241,733 | 70% 699 of 699 units |
 Mike Levin (Democrat) leading by 15 pts |
Democrat over 99% | Democrat | updated 10:43 AM ET (15:43 UTC, 9 Nov) |
| Texas's 2nd district | 283,915 | 99% 99 of 100 units |
 Steve Toth (Republican) leading by 2.0 pts |
Republican over 99% | Republican | updated 10:19 AM ET (15:19 UTC, 9 Nov) as reported by AP (as published on the BBC's results page) |
| Florida's 4th district | 300,985 | 99% 99 of 100 units |
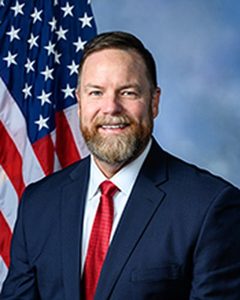 Aaron Bean (Republican) leading by 2.1 pts |
Republican over 99% | Republican | updated 6:12 PM ET (23:12 UTC, 6 Nov) as reported by AP (as published on the BBC's resul [aligned] |
| North Carolina's 9th district | 271,399 | 99% 169 of 169 units |
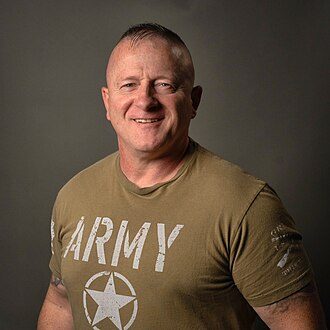 Richard N. Ojeda II (Democrat) leading by 2.2 pts |
Democrat over 99% | Democrat | updated 12:10 PM ET (17:10 UTC, 9 Nov) |
| North Carolina's 14th district | 288,361 | 99% 142 of 142 units |
Lakesha Womack (Democrat) leading by 2.2 pts | Democrat over 99% | Democrat | updated 12:10 PM ET (17:10 UTC, 9 Nov) |
| North Carolina's 6th district | 273,738 | 99% 195 of 195 units |
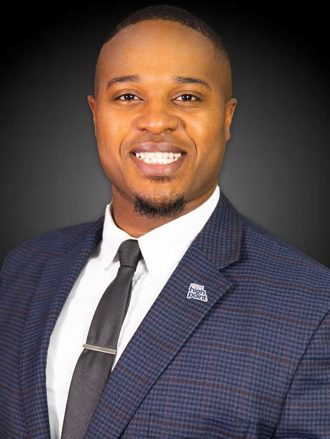 Cyril Jefferson (Democrat) leading by 2.3 pts |
Democrat over 99% | Democrat | updated 12:10 PM ET (17:10 UTC, 9 Nov) |
| Tennessee's 7th district | 240,886 | 99% 99 of 100 units |
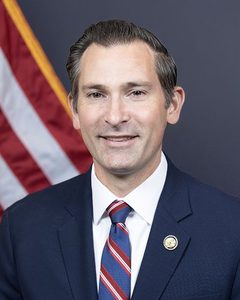 Matt Van Epps (Republican) leading by 2.2 pts |
Republican over 99% | Republican | updated 9:11 AM ET (14:11 UTC, 6 Nov) as reported by AP (as published on the BBC's results page) |
| California's 20th district | 168,648 | 58% 764 of 764 units |
 Vince Fong (Republican) leading by 24 pts |
Republican over 99% | Republican | updated 10:43 AM ET (15:43 UTC, 9 Nov) |
| North Carolina's 13th district | 316,789 | 99% 140 of 140 units |
 Paul Barringer (Democrat) leading by 2.4 pts |
Democrat over 99% | Democrat | updated 12:10 PM ET (17:10 UTC, 9 Nov) |
| Colorado's 5th district | 307,995 | 95% 95 of 100 units |
 Jessica Killin (Democrat) leading by 4.7 pts |
Democrat over 99% | Democrat | updated 9:37 AM ET (14:37 UTC, 9 Nov) as reported by AP (as published on the BBC's resul [aligned] |
| California's 21st district | 99,931 | 59% 323 of 323 units |
 Jim Costa (Democrat) leading by 25 pts |
Democrat over 99% | Democrat | updated 10:43 AM ET (15:43 UTC, 9 Nov) |
| California's 13th district | 113,824 | 65% 974 of 974 units |
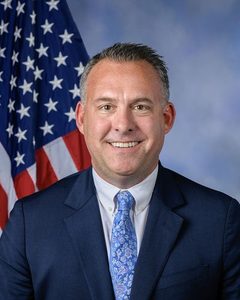 Adam Gray (Democrat) leading by 23 pts |
Democrat over 99% | Democrat | updated 10:43 AM ET (15:43 UTC, 9 Nov) |
| Texas's 27th district | 282,399 | 99% 99 of 100 units |
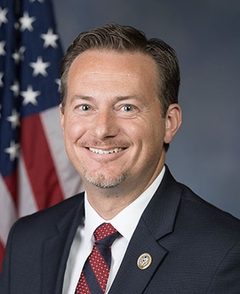 Michael Cloud (Republican) leading by 2.3 pts |
Republican over 99% | Republican | updated 10:19 AM ET (15:19 UTC, 9 Nov) as reported by AP (as published on the BBC's results page) |
| California's 22nd district | 93,372 | 57% 575 of 575 units |
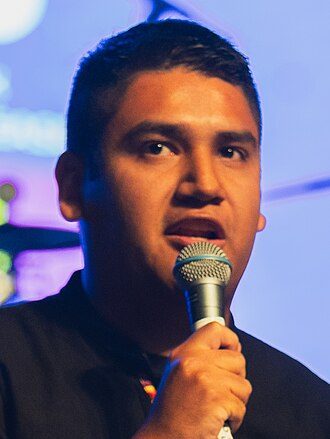 Randy Villegas (Democrat) leading by 33 pts |
Democrat over 99% | Democrat | updated 10:43 AM ET (15:43 UTC, 9 Nov) |
| Maryland's 1st district | 298,548 | 92% 92 of 100 units |
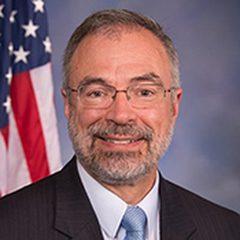 Andy Harris (Republican) leading by 6.8 pts |
Republican over 99% | Republican | updated 10:56 AM ET (15:56 UTC, 9 Nov) as reported by AP (as published on the BBC's results page) |
| New York's 2nd district | 248,655 | 97% 97 of 100 units |
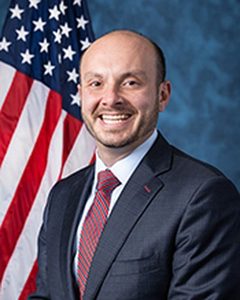 Andrew Garbarino (Republican) leading by 3.2 pts |
Republican over 99% | Republican | updated 10:29 AM ET (15:29 UTC, 6 Nov) as reported by AP (as published on the BBC's results page) |
| California's 25th district | 147,500 | 57% 656 of 656 units |
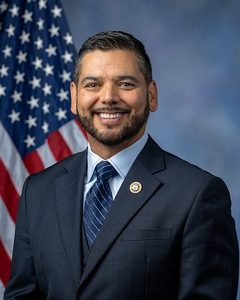 Raul Ruiz (Democrat) leading by 30 pts |
Democrat over 99% | Democrat | updated 10:43 AM ET (15:43 UTC, 9 Nov) |
| Arizona's 8th district | 285,544 | 99% 99 of 100 units |
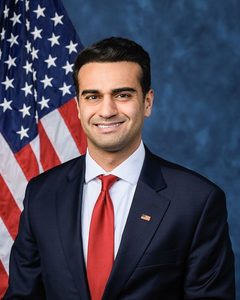 Abraham Hamadeh (Republican) leading by 2.5 pts |
Republican over 99% | Republican | updated 10:15 AM ET (15:15 UTC, 9 Nov) as reported by AP (as published on the BBC's results page) |
| Nebraska's 1st district | 254,139 | 97% 438 of 438 units |
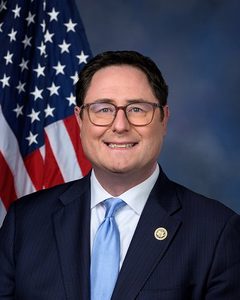 Mike Flood (Republican) leading by 3.5 pts |
Republican over 99% | Republican | file made 12:26 PM ET (17:26 UTC, 9 Nov) |
| California's 50th district | 222,706 | 68% 713 of 713 units |
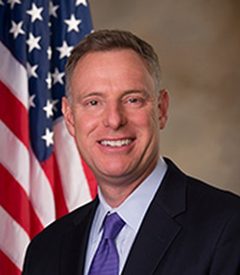 Scott Peters (Democrat) leading by 24 pts |
Democrat over 99% | Democrat | updated 10:43 AM ET (15:43 UTC, 9 Nov) |
| Georgia's 1st district | 272,776 | 99% 15 of 15 units |
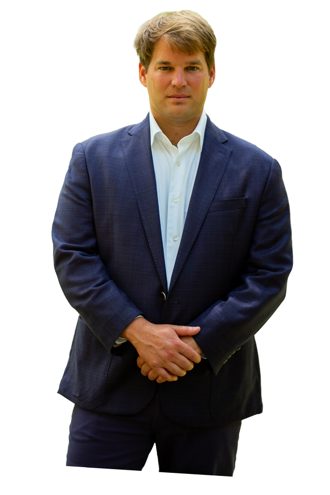 James Jim Kingston (Republican) leading by 2.8 pts |
Republican over 99% | Republican | updated 8:50 AM ET (13:50 UTC, 9 Nov) |
| Washington's 4th district | 229,838 | 92% 8 of 8 units |
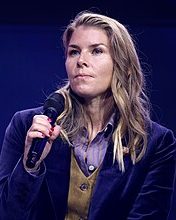 Amanda McKinney (Republican) leading by 7.9 pts |
Republican over 99% | Republican | updated 8:04 PM ET (01:04 UTC, 7 Nov) |
| California's 2nd district | 182,334 | 56% 595 of 595 units |
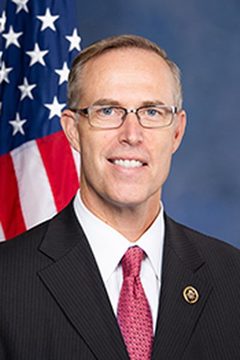 Jared Huffman (Democrat) leading by 30 pts |
Democrat over 99% | Democrat | updated 10:43 AM ET (15:43 UTC, 9 Nov) |
| Texas's 32nd district | 277,615 | 99% 99 of 100 units |
 Jace Yarbrough (Republican) leading by 2.9 pts |
Republican over 99% | Republican | updated 10:18 AM ET (15:18 UTC, 9 Nov) as reported by AP (as published on the BBC's results page) |
| California's 26th district | 213,256 | 70% 1087 of 1087 units |
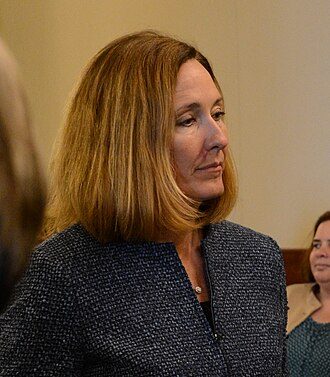 Jacqui Irwin (Democrat) leading by 24 pts |
Democrat over 99% | Democrat | updated 10:43 AM ET (15:43 UTC, 9 Nov) |
| California's 47th district | 249,011 | 83% 561 of 561 units |
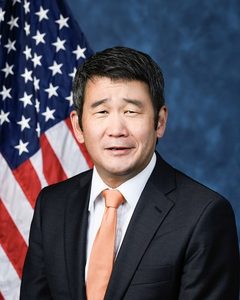 Dave Min (Democrat) leading by 16 pts |
Democrat over 99% | Democrat | updated 10:43 AM ET (15:43 UTC, 9 Nov) |
| California's 39th district | 112,701 | 59% 210 of 210 units |
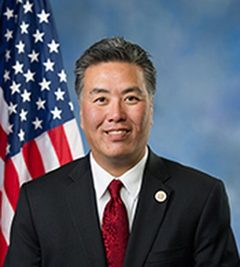 Mark Takano (Democrat) leading by 33 pts |
Democrat over 99% | Democrat | updated 10:43 AM ET (15:43 UTC, 9 Nov) |
| Texas's 5th district | 253,133 | 99% 99 of 100 units |
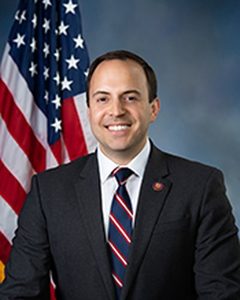 Lance Gooden (Republican) leading by 2.9 pts |
Republican over 99% | Republican | updated 10:19 AM ET (15:19 UTC, 9 Nov) as reported by AP (as published on the BBC's results page) |
| Oregon's 6th district | 257,662 | 82% 82 of 100 units |
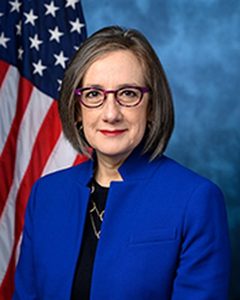 Andrea Salinas (Democrat) leading by 17 pts |
Democrat over 99% | Democrat | updated 10:25 AM ET (15:25 UTC, 9 Nov) as reported by AP (as published on the BBC's results page) |
| New York's 17th district | 310,670 | 95% 95 of 100 units |
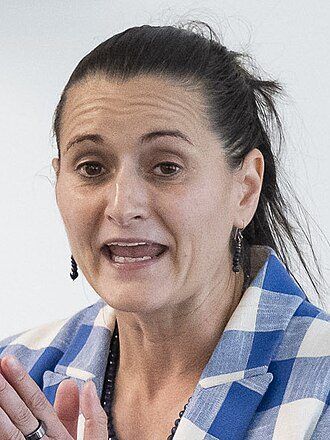 Cait Conley (Democrat) leading by 6.1 pts |
Democrat over 99% | Democrat | updated 9:35 AM ET (14:35 UTC, 9 Nov) as reported by AP (as published on the BBC's results page) |
| Indiana's 5th district | 260,319 | 99% |  J.D. Ford (Democrat) leading by 3.3 pts |
Democrat over 99% | Democrat | file made 12:02 PM ET (17:02 UTC, 9 Nov) |
| California's 24th district | 189,609 | 61% 627 of 627 units |
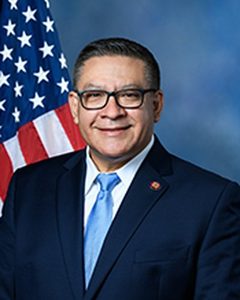 Salud Carbajal (Democrat) leading by 32 pts |
Democrat over 99% | Democrat | updated 10:43 AM ET (15:43 UTC, 9 Nov) |
| North Carolina's 1st district | 312,740 | 99% 290 of 290 units |
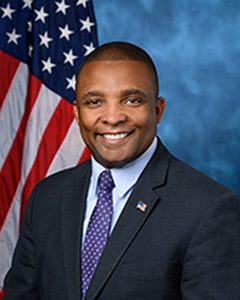 Don Davis (Democrat) leading by 3.3 pts |
Democrat over 99% | Democrat | updated 12:10 PM ET (17:10 UTC, 9 Nov) |
| California's 51st district | 202,615 | 69% 663 of 663 units |
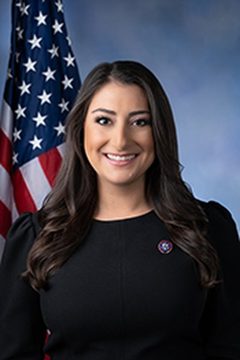 Sara Jacobs (Democrat) leading by 28 pts |
Democrat over 99% | Democrat | updated 10:43 AM ET (15:43 UTC, 9 Nov) |
| Tennessee's 6th district | 238,224 | 99% 99 of 100 units |
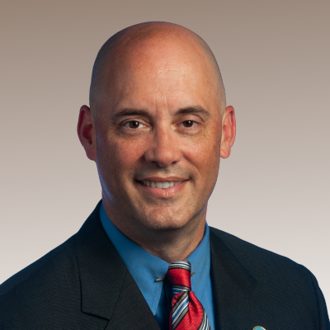 Johnny Garrett (Republican) leading by 3.3 pts |
Republican over 99% | Republican | updated 9:10 AM ET (14:10 UTC, 6 Nov) as reported by AP (as published on the BBC's results page) |
| Michigan's 7th district | 397,113 | 98% 98 of 100 units |
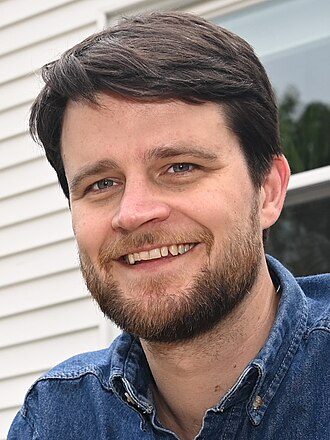 William Lawrence (Democrat) leading by 3.3 pts |
Democrat over 99% | Democrat | updated 12:03 PM ET (17:03 UTC, 9 Nov) as reported by AP (as published on the BBC's results page) |
| Arizona's 5th district | 323,005 | 99% 99 of 100 units |
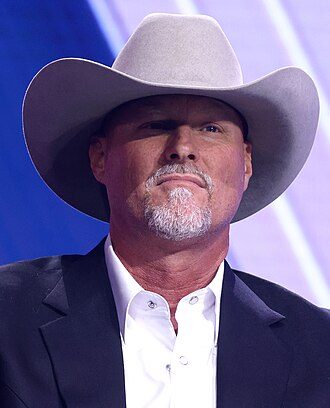 Mark Lamb (Republican) leading by 3.4 pts |
Republican over 99% | Republican | updated 10:15 AM ET (15:15 UTC, 9 Nov) as reported by AP (as published on the BBC's results page) |
| Montana's 1st district | 262,219 | 98% 98 of 100 units |
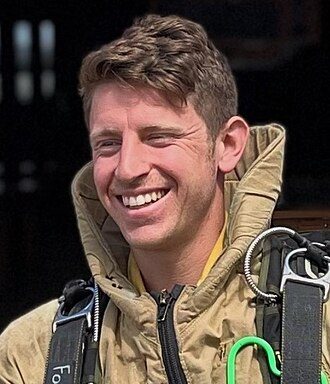 Sam Forstag (Democrat) leading by 3.6 pts |
Democrat over 99% | Democrat | updated 4:44 PM ET (21:44 UTC, 6 Nov) as reported by AP (as published on the BBC's results page) |
| Texas's 22nd district | 289,777 | 99% 99 of 100 units |
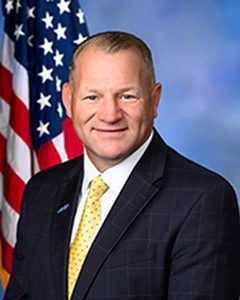 Trever Nehls (Republican) leading by 3.6 pts |
Republican over 99% | Republican | updated 10:19 AM ET (15:19 UTC, 9 Nov) as reported by AP (as published on the BBC's results page) |
| Florida's 18th district | 273,286 | 99% 99 of 100 units |
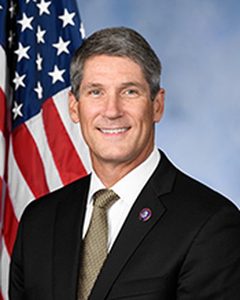 Scott Franklin (Republican) leading by 3.7 pts |
Republican over 99% | Republican | updated 6:12 PM ET (23:12 UTC, 6 Nov) as reported by AP (as published on the BBC's resul [aligned] |
| Florida's 22nd district | 295,116 | 99% 99 of 100 units |
 Pia Dandiya (Democrat) leading by 3.8 pts |
Democrat over 99% | Democrat | updated 6:12 PM ET (23:12 UTC, 6 Nov) as reported by AP (as published on the BBC's resul [aligned] |
| New York's 11th district | 181,316 | 91% 91 of 100 units |
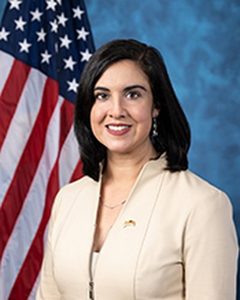 Nicole Malliotakis (Republican) leading by 12 pts |
Republican over 99% | Republican | updated 4:32 PM ET (21:32 UTC, 5 Nov) as reported by AP (as published on the BBC's results page) |
| Wisconsin's 1st district | 305,724 | 99% 99 of 100 units |
 Mitchell Berman (Democrat) leading by 3.9 pts |
Democrat over 99% | Democrat | updated 9:25 AM ET (14:25 UTC, 9 Nov) as reported by AP (as published on the BBC's results page) |
| Iowa's 2nd district | 346,216 | 99% 99 of 100 units |
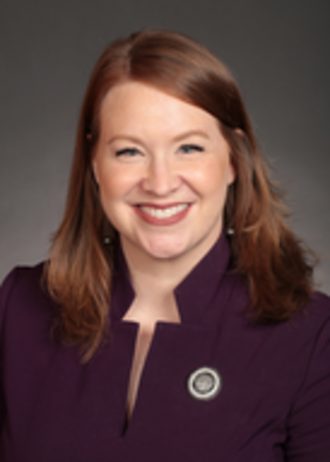 Lindsay James (Democrat) leading by 4.0 pts |
Democrat over 99% | Democrat | updated 10:33 AM ET (15:33 UTC, 9 Nov) as reported by AP (as published on the BBC's results page) |
| Georgia's 12th district | 270,452 | 99% 24 of 24 units |
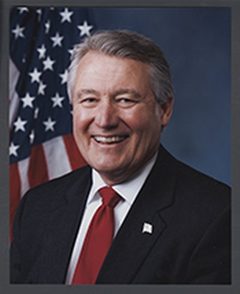 Rick W. Allen (Republican) leading by 4.2 pts |
Republican over 99% | Republican | updated 8:50 AM ET (13:50 UTC, 9 Nov) |
| Alabama's 1st district | 231,965 | 99% 99 of 100 units |
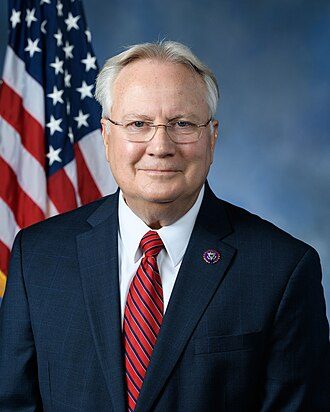 Jerry Carl (Republican) leading by 18 pts |
Republican over 99% | Republican | updated 5:29 PM ET (22:29 UTC, 5 Nov) as reported by AP (as published on the BBC's results page) |
| Alabama's 2nd district | 231,471 | 99% 99 of 100 units |
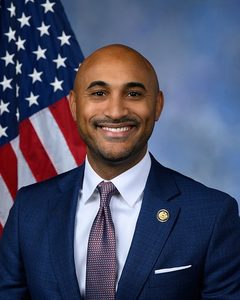 Shomari Figures (Democrat) leading by 7.5 pts |
Democrat over 99% | Democrat | updated 5:27 PM ET (22:27 UTC, 5 Nov) as reported by AP (as published on the BBC's results page) |
| Alabama's 3rd district | 221,726 | 99% 99 of 100 units |
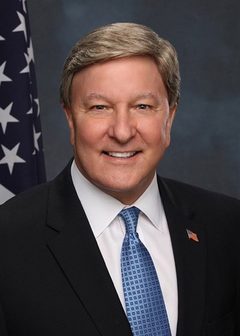 Mike Rogers (Republican) leading by 28 pts |
Republican over 99% | Republican | updated 4:17 PM ET (21:17 UTC, 5 Nov) as reported by AP (as published on the BBC's results page) |
| Alabama's 4th district | 213,641 | 99% 99 of 100 units |
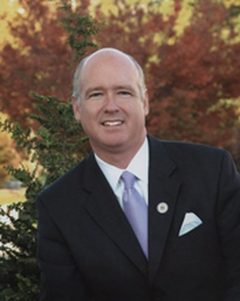 Robert Aderholt (Republican) leading by 50 pts |
Republican over 99% | Republican | updated 5:28 PM ET (22:28 UTC, 5 Nov) as reported by AP (as published on the BBC's results page) |
| Alabama's 5th district | 266,843 | 99% 99 of 100 units |
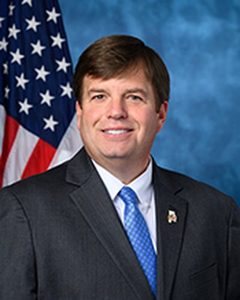 Dale Strong (Republican) leading by 6.5 pts |
Republican over 99% | Republican | updated 12:23 PM ET (17:23 UTC, 9 Nov) as reported by AP (as published on the BBC's results page) |
| Alabama's 6th district | 260,878 | 98% 98 of 100 units |
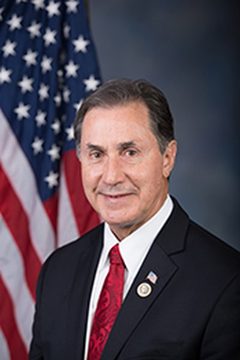 Gary Palmer (Republican) leading by 15 pts |
Republican over 99% | Republican | updated 5:26 PM ET (22:26 UTC, 5 Nov) as reported by AP (as published on the BBC's results page) |
| Alabama's 7th district | 251,908 | 99% 99 of 100 units |
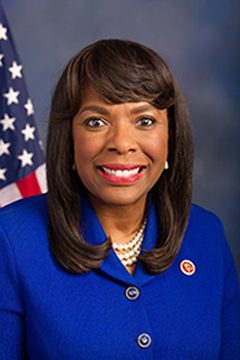 Terri Sewell (Democrat) leading by 39 pts |
Democrat over 99% | Democrat | updated 5:26 PM ET (22:26 UTC, 5 Nov) as reported by AP (as published on the BBC's results page) |
| Arkansas's 1st district | 194,232 | 99% 712 of 712 units |
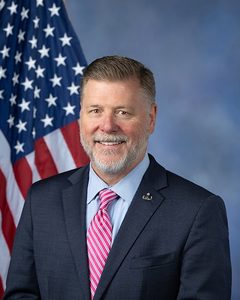 Rick Crawford (Republican) leading by 34 pts |
Republican over 99% | Republican | updated 11:43 AM ET (16:43 UTC, 9 Nov) |
| Arkansas's 3rd district | 231,928 | 99% 833 of 833 units |
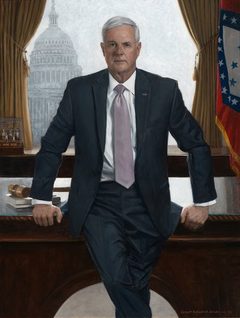 Steve Womack (Republican) leading by 13 pts |
Republican over 99% | Republican | updated 11:43 AM ET (16:43 UTC, 9 Nov) |
| Arkansas's 4th district | 200,496 | 99% 820 of 820 units |
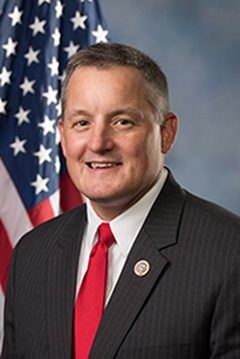 Bruce Westerman (Republican) leading by 31 pts |
Republican over 99% | Republican | updated 11:43 AM ET (16:43 UTC, 9 Nov) |
| Arizona's 1st district | 352,449 | 99% 99 of 100 units |
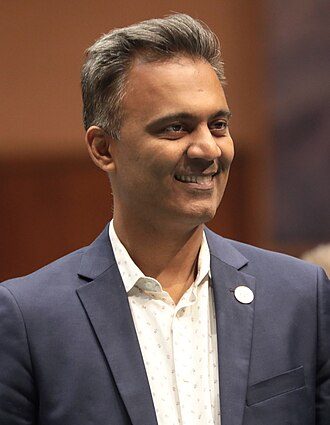 Amish Shah (Democrat) leading by 6.9 pts |
Democrat over 99% | Democrat | updated 10:15 AM ET (15:15 UTC, 9 Nov) as reported by AP (as published on the BBC's results page) |
| Arizona's 4th district | 253,315 | 99% 99 of 100 units |
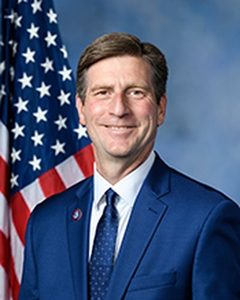 Greg Stanton (Democrat) leading by 27 pts |
Democrat over 99% | Democrat | updated 10:15 AM ET (15:15 UTC, 9 Nov) as reported by AP (as published on the BBC's results page) |
| Arizona's 6th district | 355,465 | 98% 98 of 100 units |
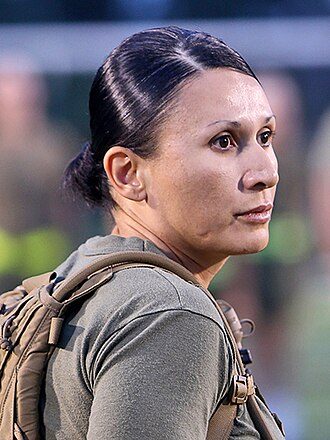 JoAnna Mendoza (Democrat) leading by 8.0 pts |
Democrat over 99% | Democrat | updated 11:06 AM ET (16:06 UTC, 9 Nov) as reported by AP (as published on the BBC's results page) |
| Arizona's 7th district | 197,790 | 96% 96 of 100 units |
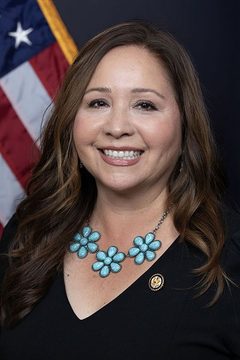 Adelita Grijalva (Democrat) leading by 44 pts |
Democrat over 99% | Democrat | updated 10:53 AM ET (15:53 UTC, 9 Nov) as reported by AP (as published on the BBC's results page) |
| Arizona's 9th district | 282,239 | 97% 97 of 100 units |
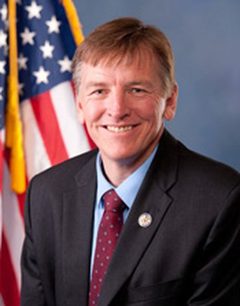 Paul Gosar (Republican) leading by 15 pts |
Republican over 99% | Republican | updated 10:53 AM ET (15:53 UTC, 9 Nov) as reported by AP (as published on the BBC's results page) |
| California's 8th district | 224,070 | 86% 396 of 396 units |
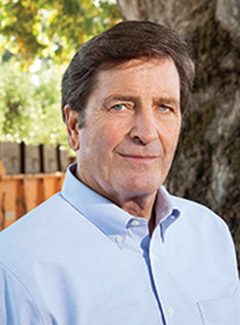 John Garamendi (Democrat) leading by 45 pts |
Democrat over 99% | Democrat | updated 10:43 AM ET (15:43 UTC, 9 Nov) |
| California's 9th district | 167,062 | 80% 322 of 322 units |
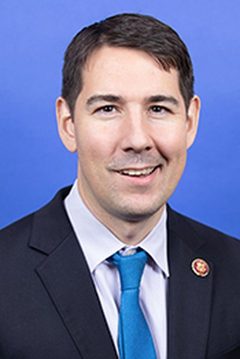 Josh Harder (Democrat) leading by 34 pts |
Democrat over 99% | Democrat | updated 10:43 AM ET (15:43 UTC, 9 Nov) |
| California's 10th district | 255,811 | 79% 728 of 728 units |
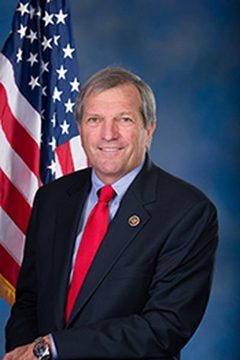 Mark DeSaulnier (Democrat) leading by 39 pts |
Democrat over 99% | Democrat | updated 10:43 AM ET (15:43 UTC, 9 Nov) |
| California's 15th district | 165,423 | 67% 299 of 299 units |
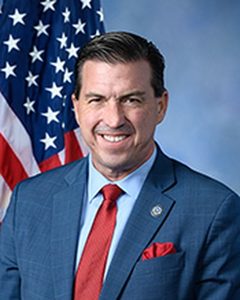 Kevin Mullin (Democrat) leading by 57 pts |
Democrat over 99% | Democrat | updated 10:43 AM ET (15:43 UTC, 9 Nov) |
| California's 16th district | 209,285 | 67% 337 of 337 units |
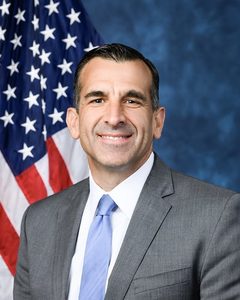 Sam Liccardo (Democrat) leading by 54 pts |
Democrat over 99% | Democrat | updated 10:43 AM ET (15:43 UTC, 9 Nov) |
| California's 17th district | 160,535 | 70% 241 of 241 units |
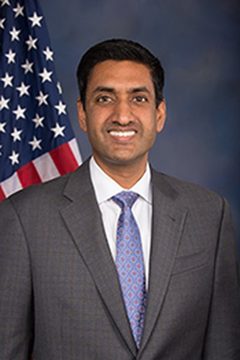 Ro Khanna (Democrat) leading by 44 pts |
Democrat over 99% | Democrat | updated 10:43 AM ET (15:43 UTC, 9 Nov) |
| California's 18th district | 144,236 | 71% 376 of 376 units |
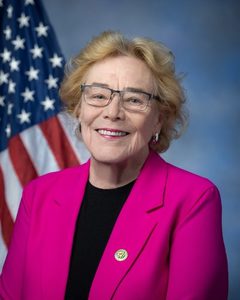 Zoe Lofgren (Democrat) leading by 45 pts |
Democrat over 99% | Democrat | updated 10:43 AM ET (15:43 UTC, 9 Nov) |
| California's 19th district | 253,790 | 76% 428 of 428 units |
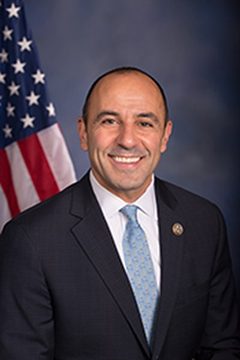 Jimmy Panetta (Democrat) leading by 46 pts |
Democrat over 99% | Democrat | updated 10:43 AM ET (15:43 UTC, 9 Nov) |
| California's 27th district | 228,808 | 97% 378 of 378 units |
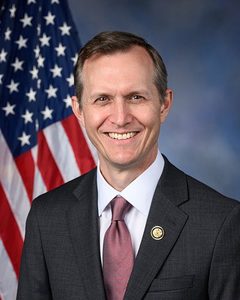 George Whitesides (Democrat) leading by 28 pts |
Democrat over 99% | Democrat | updated 10:43 AM ET (15:43 UTC, 9 Nov) |
| California's 28th district | 252,375 | 95% 391 of 391 units |
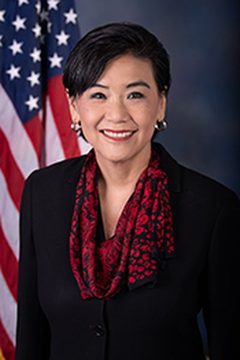 Judy Chu (Democrat) leading by 40 pts |
Democrat over 99% | Democrat | updated 10:43 AM ET (15:43 UTC, 9 Nov) |
| California's 30th district | 255,385 | 97% 193 of 193 units |
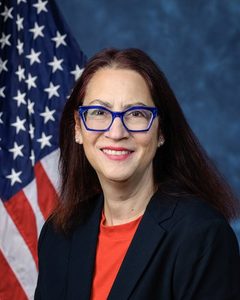 Laura Friedman (Democrat) leading by 55 pts |
Democrat over 99% | Democrat | updated 10:43 AM ET (15:43 UTC, 9 Nov) |
| California's 31st district | 230,535 | 96% 360 of 360 units |
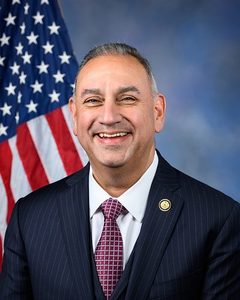 Gil Cisneros (Democrat) leading by 32 pts |
Democrat over 99% | Democrat | updated 10:43 AM ET (15:43 UTC, 9 Nov) |
| California's 32nd district | 254,812 | 90% 268 of 268 units |
 Brad Sherman (Democrat) leading by 36 pts |
Democrat over 99% | Democrat | updated 10:43 AM ET (15:43 UTC, 9 Nov) |
| California's 33rd district | 178,600 | 88% 491 of 491 units |
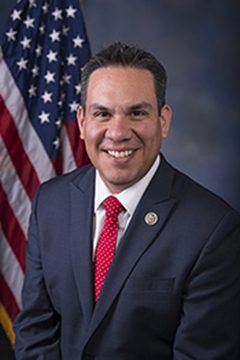 Pete Aguilar (Democrat) leading by 37 pts |
Democrat over 99% | Democrat | updated 10:43 AM ET (15:43 UTC, 9 Nov) |
| California's 35th district | 173,372 | 84% 272 of 272 units |
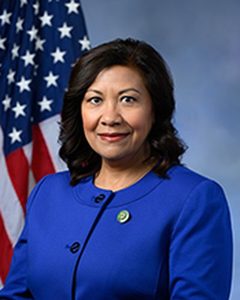 Norma J. Torres (Democrat) leading by 34 pts |
Democrat over 99% | Democrat | updated 10:43 AM ET (15:43 UTC, 9 Nov) |
| California's 36th district | 300,677 | 97% 156 of 156 units |
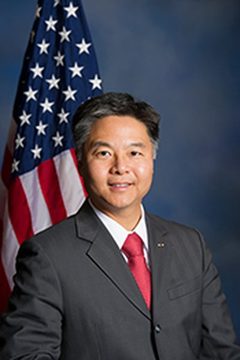 Ted W. Lieu (Democrat) leading by 46 pts |
Democrat over 99% | Democrat | updated 10:43 AM ET (15:43 UTC, 9 Nov) |
| California's 38th district | 206,163 | 93% 415 of 415 units |
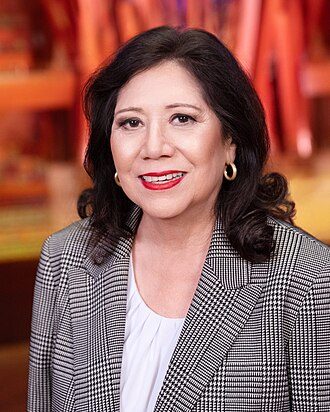 Hilda Solis (Democrat) leading by 35 pts |
Democrat over 99% | Democrat | updated 10:43 AM ET (15:43 UTC, 9 Nov) |
| California's 41st district | 241,749 | 94% 281 of 281 units |
Linda Sánchez (Democrat) leading by 35 pts | Democrat over 99% | Democrat | updated 10:43 AM ET (15:43 UTC, 9 Nov) |
| California's 42nd district | 258,971 | 89% 402 of 402 units |
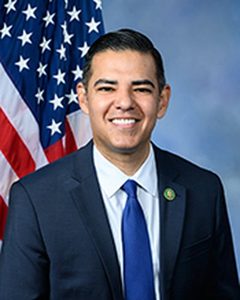 Robert Garcia (Democrat) leading by 24 pts |
Democrat over 99% | Democrat | updated 10:43 AM ET (15:43 UTC, 9 Nov) |
| California's 43rd district | 184,418 | 97% 193 of 193 units |
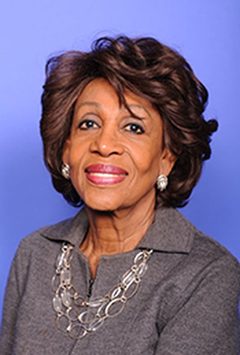 Maxine Waters (Democrat) leading by 66 pts |
Democrat over 99% | Democrat | updated 10:43 AM ET (15:43 UTC, 9 Nov) |
| California's 44th district | 178,285 | 97% 97 of 100 units |
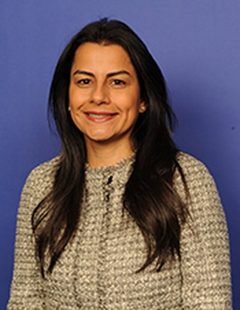 Nanette Barragan (Democrat) leading by 63 pts |
Democrat over 99% | Democrat | updated 9:25 AM ET (14:25 UTC, 9 Nov) as reported by AP (as published on the BBC's results page) |
| California's 45th district | 218,956 | 85% 424 of 424 units |
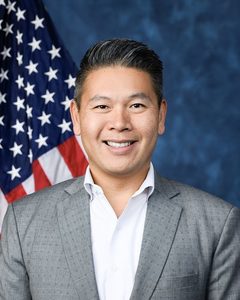 Derek Tran (Democrat) leading by 21 pts |
Democrat over 99% | Democrat | updated 10:43 AM ET (15:43 UTC, 9 Nov) |
| California's 46th district | 161,881 | 86% 423 of 423 units |
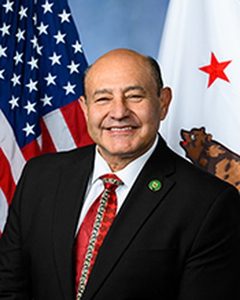 Lou Correa (Democrat) leading by 40 pts |
Democrat over 99% | Democrat | updated 10:43 AM ET (15:43 UTC, 9 Nov) |
| California's 52nd district | 152,827 | 69% 580 of 580 units |
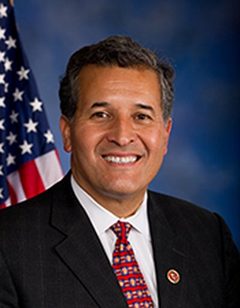 Juan Vargas (Democrat) leading by 39 pts |
Democrat over 99% | Democrat | updated 10:43 AM ET (15:43 UTC, 9 Nov) |
| Colorado's 1st district | 303,828 | 99% 99 of 100 units |
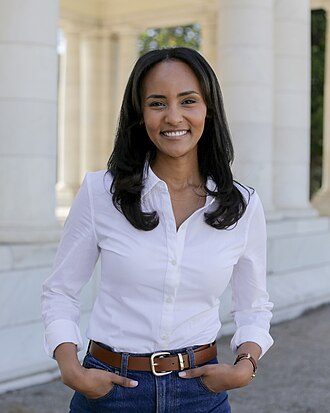 Melat Kiros (Democrat) leading by 64 pts |
Democrat over 99% | Democrat | updated 9:39 AM ET (14:39 UTC, 9 Nov) as reported by AP (as published on the BBC's resul [aligned] |
| Colorado's 2nd district | 366,709 | 97% 97 of 100 units |
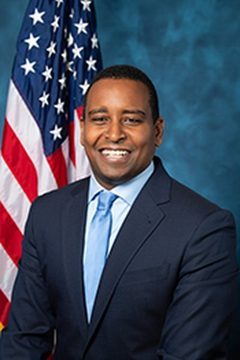 Joe Neguse (Democrat) leading by 51 pts |
Democrat over 99% | Democrat | updated 10:54 AM ET (15:54 UTC, 9 Nov) as reported by AP (as published on the BBC's resul [aligned] |
| Colorado's 6th district | 290,542 | 94% 94 of 100 units |
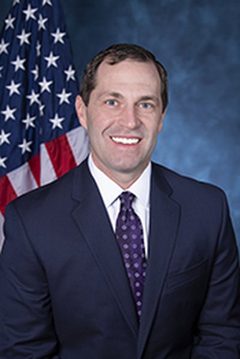 Jason Crow (Democrat) leading by 35 pts |
Democrat over 99% | Democrat | updated 9:39 AM ET (14:39 UTC, 9 Nov) as reported by AP (as published on the BBC's resul [aligned] |
| Colorado's 7th district | 376,024 | 96% 96 of 100 units |
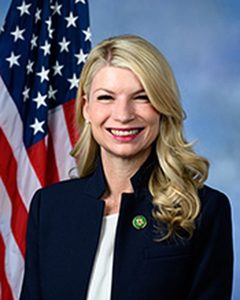 Brittany Pettersen (Democrat) leading by 25 pts |
Democrat over 99% | Democrat | updated 11:43 AM ET (16:43 UTC, 9 Nov) as reported by AP (as published on the BBC's resul [aligned] |
| Colorado's 8th district | 286,502 | 97% 97 of 100 units |
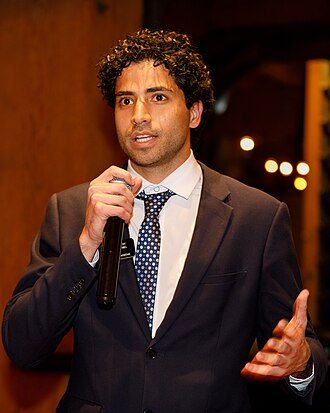 Manny Rutinel (Democrat) leading by 15 pts |
Democrat over 99% | Democrat | updated 9:42 AM ET (14:42 UTC, 9 Nov) as reported by AP (as published on the BBC's resul [aligned] |
| Connecticut's 1st district | 253,388 | 98% | 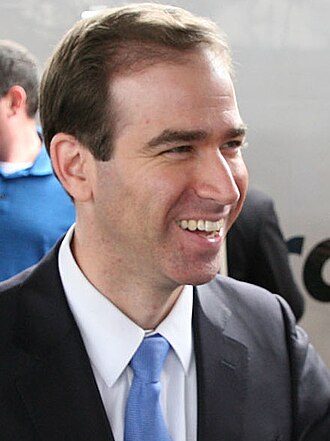 Luke Bronin (Democrat) leading by 36 pts |
Democrat over 99% | Democrat | updated 12:27 PM ET (17:27 UTC, 9 Nov) |
| Connecticut's 2nd district | 291,936 | 98% | 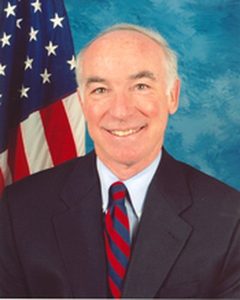 Joe Courtney (Democrat) leading by 25 pts |
Democrat over 99% | Democrat | updated 12:27 PM ET (17:27 UTC, 9 Nov) |
| Connecticut's 3rd district | 247,131 | 98% | 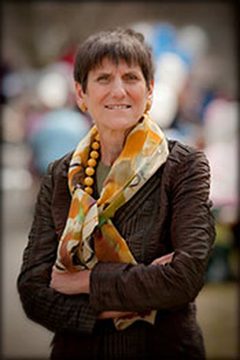 Rosa L. DeLauro (Democrat) leading by 26 pts |
Democrat over 99% | Democrat | updated 12:27 PM ET (17:27 UTC, 9 Nov) |
| Connecticut's 4th district | 240,138 | 98% | 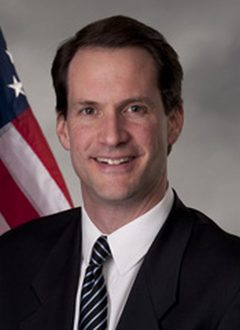 Jim Himes (Democrat) leading by 33 pts |
Democrat over 99% | Democrat | updated 12:27 PM ET (17:27 UTC, 9 Nov) |
| Connecticut's 5th district | 251,822 | 98% | 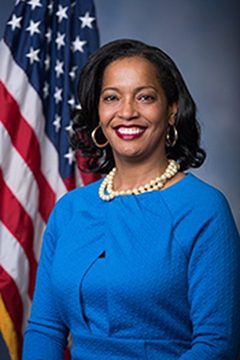 Jahana Hayes (Democrat) leading by 16 pts |
Democrat over 99% | Democrat | updated 12:27 PM ET (17:27 UTC, 9 Nov) |
| Delaware's at-large district | 378,433 | 99% 99 of 100 units |
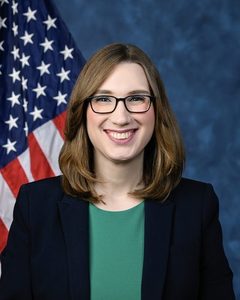 Sarah McBride (Democrat) leading by 29 pts |
Democrat over 99% | Democrat | updated 10:08 AM ET (15:08 UTC, 6 Nov) as reported by AP (as published on the BBC's results page) |
| Florida's 1st district | 291,010 | 99% 99 of 100 units |
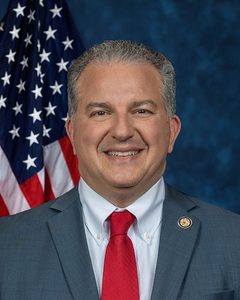 Jimmy Patronis (Republican) leading by 27 pts |
Republican over 99% | Republican | updated 6:12 PM ET (23:12 UTC, 6 Nov) as reported by AP (as published on the BBC's resul [aligned] |
| Florida's 2nd district | 309,363 | 99% 99 of 100 units |
Austin Rogers (Republican) leading by 4.2 pts | Republican over 99% | Republican | updated 11:51 AM ET (16:51 UTC, 9 Nov) as reported by AP (as published on the BBC's resul [aligned] |
| Florida's 3rd district | 300,417 | 99% 99 of 100 units |
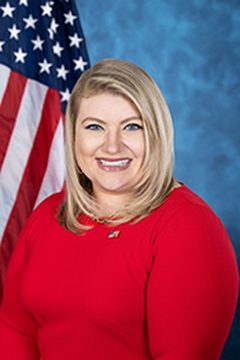 Kat Cammack (Republican) leading by 12 pts |
Republican over 99% | Republican | updated 11:47 AM ET (16:47 UTC, 9 Nov) as reported by AP (as published on the BBC's resul [aligned] |
| Florida's 5th district | 333,358 | 99% 99 of 100 units |
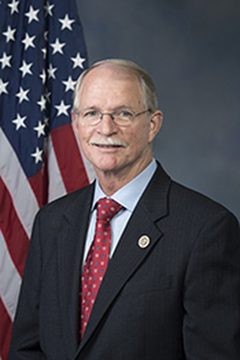 John Rutherford (Republican) leading by 13 pts |
Republican over 99% | Republican | updated 6:12 PM ET (23:12 UTC, 6 Nov) as reported by AP (as published on the BBC's resul [aligned] |
| Florida's 6th district | 331,470 | 99% 99 of 100 units |
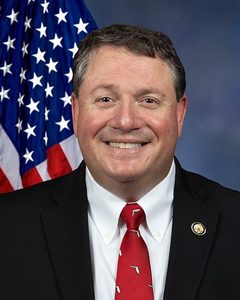 Randy Fine (Republican) leading by 19 pts |
Republican over 99% | Republican | updated 6:12 PM ET (23:12 UTC, 6 Nov) as reported by AP (as published on the BBC's resul [aligned] |
| Florida's 8th district | 319,595 | 99% 99 of 100 units |
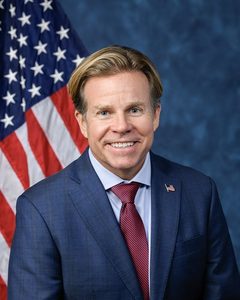 Mike Haridopolos (Republican) leading by 6.3 pts |
Republican over 99% | Republican | updated 6:12 PM ET (23:12 UTC, 6 Nov) as reported by AP (as published on the BBC's resul [aligned] |
| Florida's 11th district | 365,706 | 99% 99 of 100 units |
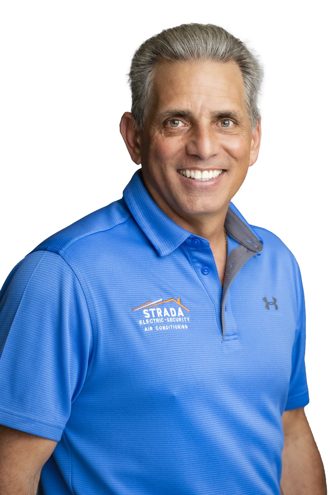 Joe Strada (Republican) leading by 6.9 pts |
Republican over 99% | Republican | updated 6:12 PM ET (23:12 UTC, 6 Nov) as reported by AP (as published on the BBC's resul [aligned] |
| Florida's 12th district | 286,094 | 99% 99 of 100 units |
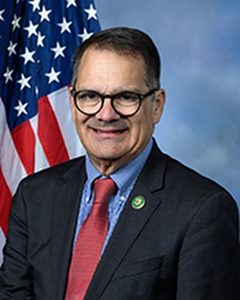 Gus Bilirakis (Republican) leading by 6.8 pts |
Republican over 99% | Republican | updated 6:12 PM ET (23:12 UTC, 6 Nov) as reported by AP (as published on the BBC's resul [aligned] |
| Florida's 14th district | 300,233 | 99% 99 of 100 units |
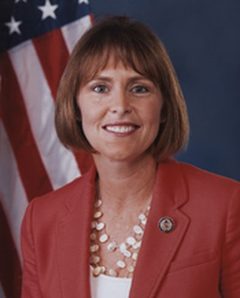 Kathy Castor (Democrat) leading by 5.4 pts |
Democrat over 99% | Democrat | updated 6:12 PM ET (23:12 UTC, 6 Nov) as reported by AP (as published on the BBC's resul [aligned] |
| Florida's 15th district | 300,907 | 99% 99 of 100 units |
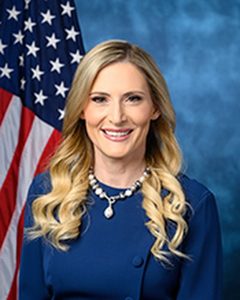 Laurel Lee (Republican) leading by 8.6 pts |
Republican over 99% | Republican | updated 6:12 PM ET (23:12 UTC, 6 Nov) as reported by AP (as published on the BBC's resul [aligned] |
| Florida's 16th district | 343,033 | 99% 99 of 100 units |
Sydney Gruters (Republican) leading by 4.2 pts | Republican over 99% | Republican | updated 6:12 PM ET (23:12 UTC, 6 Nov) as reported by AP (as published on the BBC's resul [aligned] |
| Florida's 17th district | 357,875 | 99% 99 of 100 units |
 Greg Steube (Republican) leading by 18 pts |
Republican over 99% | Republican | updated 6:12 PM ET (23:12 UTC, 6 Nov) as reported by AP (as published on the BBC's resul [aligned] |
| Florida's 19th district | 325,188 | 99% 99 of 100 units |
Jim Schwartzel (Republican) leading by 23 pts | Republican over 99% | Republican | updated 6:12 PM ET (23:12 UTC, 6 Nov) as reported by AP (as published on the BBC's resul [aligned] |
| Florida's 20th district | 245,706 | 99% 99 of 100 units |
 Debbie Wasserman Schultz (Democrat) leading by 53 pts |
Democrat over 99% | Democrat | updated 6:12 PM ET (23:12 UTC, 6 Nov) as reported by AP (as published on the BBC's resul [aligned] |
| Florida's 21st district | 342,040 | 99% 99 of 100 units |
 Brian Mast (Republican) leading by 9.1 pts |
Republican over 99% | Republican | updated 6:12 PM ET (23:12 UTC, 6 Nov) as reported by AP (as published on the BBC's resul [aligned] |
| Florida's 23rd district | 258,967 | 99% 99 of 100 units |
 Lois Frankel (Democrat) leading by 31 pts |
Democrat over 99% | Democrat | updated 6:12 PM ET (23:12 UTC, 6 Nov) as reported by AP (as published on the BBC's resul [aligned] |
| Florida's 24th district | 204,435 | 99% 99 of 100 units |
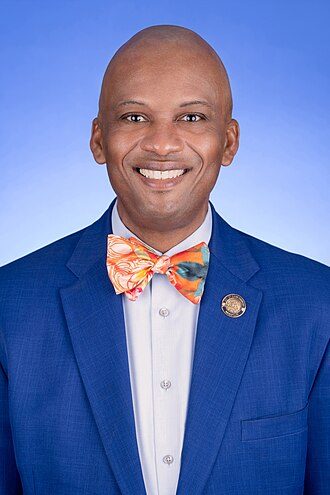 Oliver Gilbert (Democrat) leading by 61 pts |
Democrat over 99% | Democrat | updated 6:12 PM ET (23:12 UTC, 6 Nov) as reported by AP (as published on the BBC's resul [aligned] |
| Florida's 25th district | 280,681 | 99% 99 of 100 units |
 Jared Moskowitz (Democrat) leading by 4.6 pts |
Democrat over 99% | Democrat | updated 6:12 PM ET (23:12 UTC, 6 Nov) as reported by AP (as published on the BBC's resul [aligned] |
| Florida's 28th district | 236,301 | 99% 99 of 100 units |
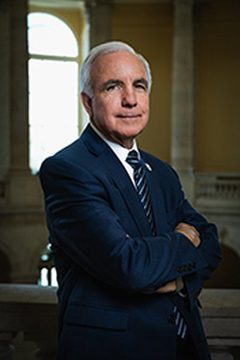 Carlos Gimenez (Republican) leading by 7.2 pts |
Republican over 99% | Republican | updated 6:12 PM ET (23:12 UTC, 6 Nov) as reported by AP (as published on the BBC's results page) |
| Georgia's 2nd district | 243,858 | 99% 30 of 30 units |
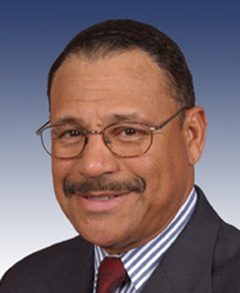 Sanford Bishop (Democrat) leading by 22 pts |
Democrat over 99% | Democrat | updated 8:50 AM ET (13:50 UTC, 9 Nov) |
| Georgia's 3rd district | 321,733 | 99% 15 of 15 units |
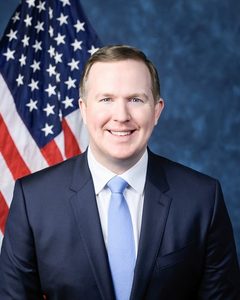 Brian Jack (Republican) leading by 17 pts |
Republican over 99% | Republican | updated 8:50 AM ET (13:50 UTC, 9 Nov) |
| Georgia's 4th district | 262,763 | 99% 2 of 2 units |
 Henry Hank Johnson Jr. (Democrat) leading by 65 pts |
Democrat over 99% | Democrat | updated 8:50 AM ET (13:50 UTC, 9 Nov) |
| Georgia's 5th district | 304,461 | 99% 3 of 3 units |
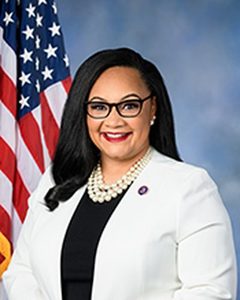 Nikema Williams (Democrat) leading by 80 pts |
Democrat over 99% | Democrat | updated 8:50 AM ET (13:50 UTC, 9 Nov) |
| Georgia's 6th district | 326,231 | 99% 4 of 4 units |
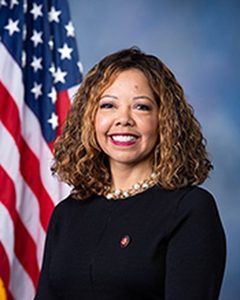 Lucy McBath (Democrat) leading by 62 pts |
Democrat over 99% | Democrat | updated 8:50 AM ET (13:50 UTC, 9 Nov) |
| Georgia's 7th district | 340,894 | 99% 6 of 6 units |
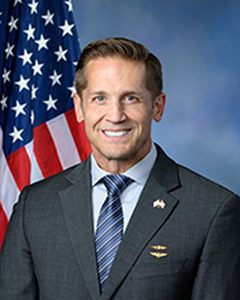 Rich McCormick (Republican) leading by 12 pts |
Republican over 99% | Republican | updated 8:50 AM ET (13:50 UTC, 9 Nov) |
| Georgia's 8th district | 265,037 | 99% 29 of 29 units |
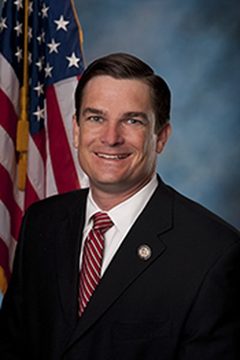 Austin Scott (Republican) leading by 21 pts |
Republican over 99% | Republican | updated 8:50 AM ET (13:50 UTC, 9 Nov) |
| Georgia's 9th district | 308,514 | 99% 12 of 12 units |
 Andrew Clyde (Republican) leading by 19 pts |
Republican over 99% | Republican | updated 8:50 AM ET (13:50 UTC, 9 Nov) |
| Georgia's 10th district | 325,911 | 99% 20 of 20 units |
 Houston Gaines (Republican) leading by 7.3 pts |
Republican over 99% | Republican | updated 8:50 AM ET (13:50 UTC, 9 Nov) |
| Georgia's 11th district | 329,161 | 99% 5 of 5 units |
 John Cowan (Republican) leading by 11 pts |
Republican over 99% | Republican | updated 8:50 AM ET (13:50 UTC, 9 Nov) |
| Georgia's 13th district | 310,596 | 99% 6 of 6 units |
 Jasmine Clark (Democrat) leading by 60 pts |
Democrat over 99% | Democrat | updated 8:50 AM ET (13:50 UTC, 9 Nov) |
| Georgia's 14th district | 287,140 | 99% 10 of 10 units |
 Clay Fuller (Republican) leading by 18 pts |
Republican over 99% | Republican | updated 8:50 AM ET (13:50 UTC, 9 Nov) |
| Hawaii's 1st district | 175,575 | 99% 99 of 100 units |
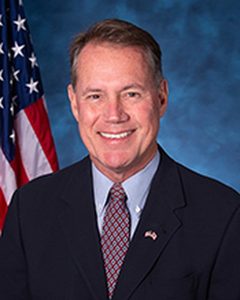 Ed Case (Democrat) leading by 49 pts |
Democrat over 99% | Democrat | updated 3:01 PM ET (20:01 UTC, 6 Nov) as reported by AP (as published on the BBC's results page) |
| Hawaii's 2nd district | 194,717 | 99% 99 of 100 units |
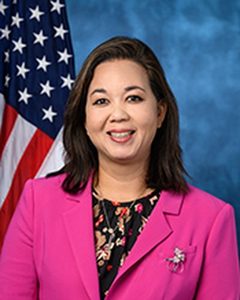 Jill Tokuda (Democrat) leading by 33 pts |
Democrat over 99% | Democrat | updated 3:02 PM ET (20:02 UTC, 6 Nov) as reported by AP (as published on the BBC's results page) |
| Iowa's 1st district | 347,566 | 99% 99 of 100 units |
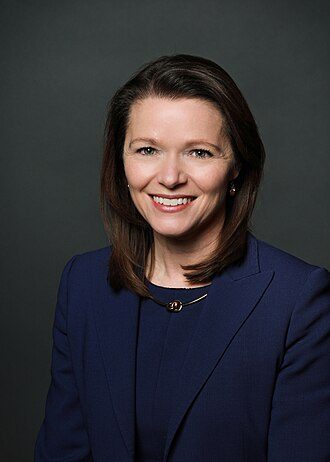 Christina Bohannan (Democrat) leading by 9.6 pts |
Democrat over 99% | Democrat | updated 11:57 AM ET (16:57 UTC, 9 Nov) as reported by AP (as published on the BBC's results page) |
| Iowa's 3rd district | 352,986 | 99% 99 of 100 units |
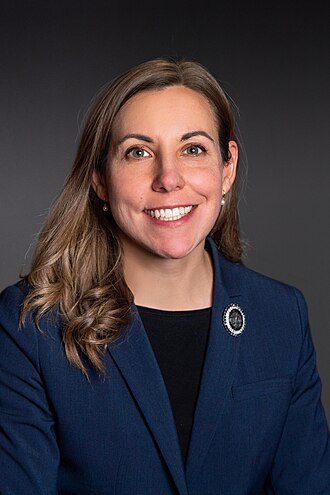 Sarah Trone Garriott (Democrat) leading by 7.3 pts |
Democrat over 99% | Democrat | updated 10:30 AM ET (15:30 UTC, 9 Nov) as reported by AP (as published on the BBC's results page) |
| Iowa's 4th district | 302,808 | 99% 99 of 100 units |
 Chris McGowan (Republican) leading by 18 pts |
Republican over 99% | Republican | updated 11:27 AM ET (16:27 UTC, 9 Nov) as reported by AP (as published on the BBC's results page) |
| Idaho's 1st district | 379,048 | 99% 19 of 19 units |
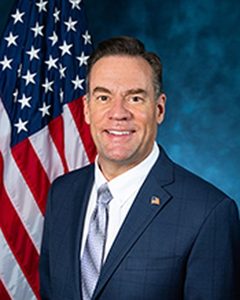 Russ Fulcher (Republican) leading by 36 pts |
Republican over 99% | Republican | updated 12:11 PM ET (17:11 UTC, 9 Nov) |
| Idaho's 2nd district | 330,398 | 99% 26 of 26 units |
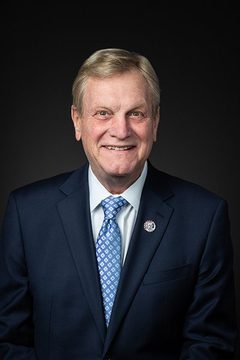 Mike Simpson (Republican) leading by 11 pts |
Republican over 99% | Republican | updated 12:11 PM ET (17:11 UTC, 9 Nov) |
| Illinois's 1st district | 231,193 | 93% 93 of 100 units |
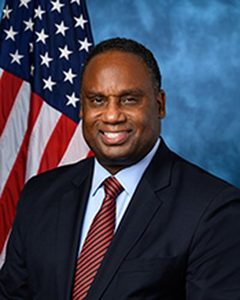 Jonathan Jackson (Democrat) leading by 43 pts |
Democrat over 99% | Democrat | updated 10:05 AM ET (15:05 UTC, 9 Nov) as reported by AP (as published on the BBC's results page) |
| Illinois's 2nd district | 212,750 | 89% 89 of 100 units |
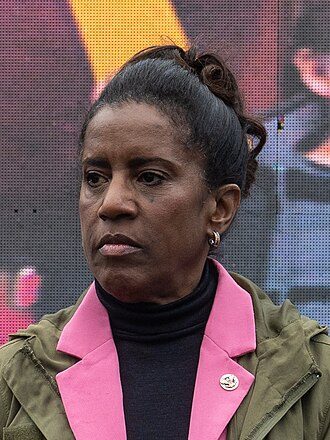 Donna Miller (Democrat) leading by 46 pts |
Democrat over 99% | Democrat | updated 10:05 AM ET (15:05 UTC, 9 Nov) as reported by AP (as published on the BBC's results page) |
| Illinois's 3rd district | 192,427 | 94% 94 of 100 units |
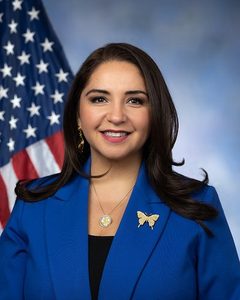 Delia Ramirez (Democrat) leading by 53 pts |
Democrat over 99% | Democrat | updated 10:05 AM ET (15:05 UTC, 9 Nov) as reported by AP (as published on the BBC's results page) |
| Illinois's 4th district | 157,386 | 93% 93 of 100 units |
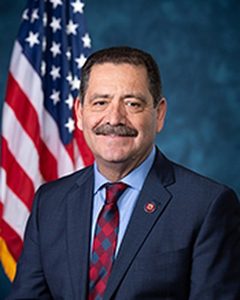 Patty Garcia (Democrat) leading by 55 pts |
Democrat over 99% | Democrat | updated 10:05 AM ET (15:05 UTC, 9 Nov) as reported by AP (as published on the BBC's results page) |
| Illinois's 5th district | 254,154 | 94% 94 of 100 units |
 Mike Quigley (Democrat) leading by 52 pts |
Democrat over 99% | Democrat | updated 10:05 AM ET (15:05 UTC, 9 Nov) as reported by AP (as published on the BBC's results page) |
| Illinois's 6th district | 259,448 | 96% 96 of 100 units |
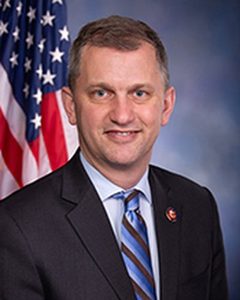 Sean Casten (Democrat) leading by 26 pts |
Democrat over 99% | Democrat | updated 10:05 AM ET (15:05 UTC, 9 Nov) as reported by AP (as published on the BBC's results page) |
| Illinois's 7th district | 191,651 | 92% 92 of 100 units |
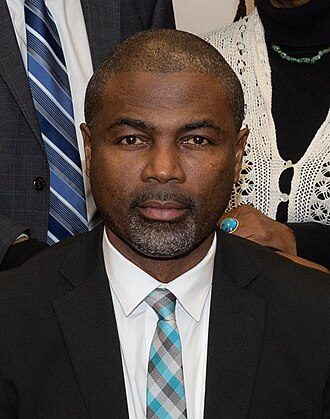 La Shawn Ford (Democrat) leading by 78 pts |
Democrat over 99% | Democrat | updated 10:05 AM ET (15:05 UTC, 9 Nov) as reported by AP (as published on the BBC's results page) |
| Illinois's 8th district | 213,273 | 97% 97 of 100 units |
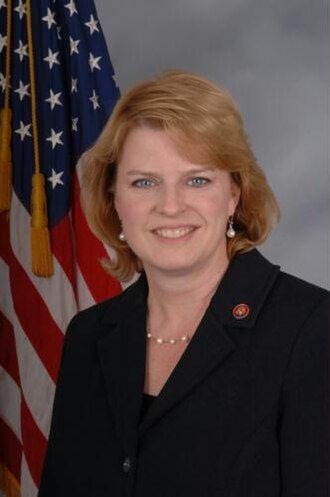 Melissa Bean (Democrat) leading by 28 pts |
Democrat over 99% | Democrat | updated 10:05 AM ET (15:05 UTC, 9 Nov) as reported by AP (as published on the BBC's results page) |
| Illinois's 9th district | 250,211 | 95% 95 of 100 units |
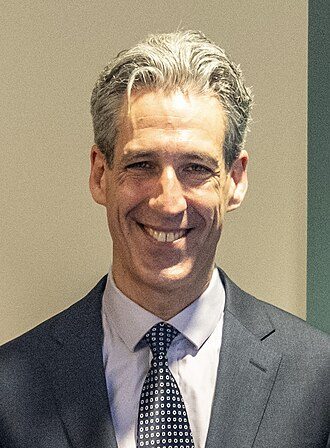 Daniel Biss (Democrat) leading by 52 pts |
Democrat over 99% | Democrat | updated 10:05 AM ET (15:05 UTC, 9 Nov) as reported by AP (as published on the BBC's results page) |
| Illinois's 10th district | 233,638 | 98% 98 of 100 units |
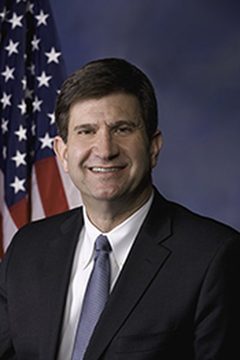 Brad Schneider (Democrat) leading by 40 pts |
Democrat over 99% | Democrat | updated 2:39 PM ET (19:39 UTC, 7 Nov) as reported by AP (as published on the BBC's results page) |
| Illinois's 11th district | 265,901 | 97% 97 of 100 units |
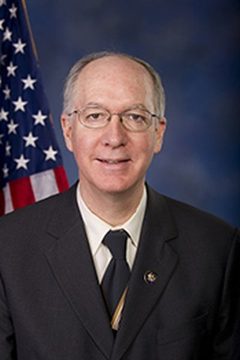 Bill Foster (Democrat) leading by 29 pts |
Democrat over 99% | Democrat | updated 2:40 PM ET (19:40 UTC, 7 Nov) as reported by AP (as published on the BBC's results page) |
| Illinois's 12th district | 279,419 | 98% 98 of 100 units |
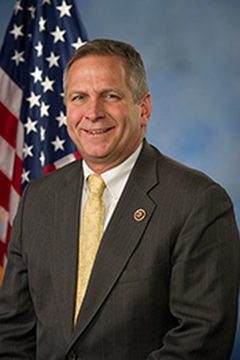 Mike Bost (Republican) leading by 39 pts |
Republican over 99% | Republican | updated 11:25 AM ET (16:25 UTC, 6 Nov) as reported by AP (as published on the BBC's results page) |
| Illinois's 13th district | 251,178 | 98% 98 of 100 units |
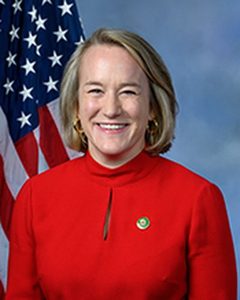 Nikki Budzinski (Democrat) leading by 25 pts |
Democrat over 99% | Democrat | updated 5:46 PM ET (22:46 UTC, 4 Nov) as reported by AP (as published on the BBC's results page) |
| Illinois's 14th district | 245,166 | 97% 97 of 100 units |
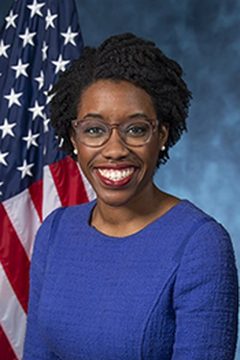 Lauren Underwood (Democrat) leading by 25 pts |
Democrat over 99% | Democrat | updated 3:14 PM ET (20:14 UTC, 6 Nov) as reported by AP (as published on the BBC's results page) |
| Illinois's 15th district | 288,061 | 98% 98 of 100 units |
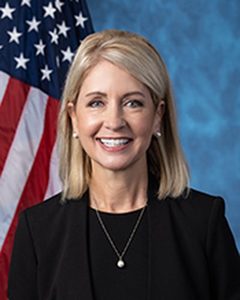 Mary Miller (Republican) leading by 34 pts |
Republican over 99% | Republican | updated 11:29 AM ET (16:29 UTC, 6 Nov) as reported by AP (as published on the BBC's results page) |
| Illinois's 16th district | 294,611 | 94% 94 of 100 units |
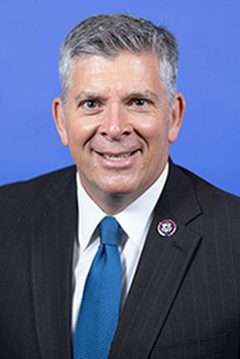 Darin LaHood (Republican) leading by 18 pts |
Republican over 99% | Republican | updated 2:17 PM ET (19:17 UTC, 7 Nov) as reported by AP (as published on the BBC's results page) |
| Illinois's 17th district | 236,027 | 95% 95 of 100 units |
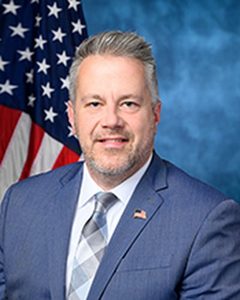 Eric Sorensen (Democrat) leading by 20 pts |
Democrat over 99% | Democrat | updated 2:18 PM ET (19:18 UTC, 7 Nov) as reported by AP (as published on the BBC's results page) |
| Indiana's 1st district | 223,232 | 98% | 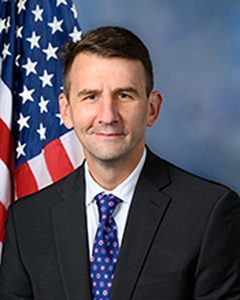 Frank J. Mrvan (Democrat) leading by 26 pts |
Democrat over 99% | Democrat | file made 12:02 PM ET (17:02 UTC, 9 Nov) |
| Indiana's 2nd district | 192,747 | 99% |  Rudy Yakym (Republican) leading by 4.9 pts |
Republican over 99% | Republican | file made 12:02 PM ET (17:02 UTC, 9 Nov) |
| Indiana's 3rd district | 200,013 | 99% |  Marlin A. Stutzman (Republican) leading by 9.7 pts |
Republican over 99% | Republican | file made 12:02 PM ET (17:02 UTC, 9 Nov) |
| Indiana's 4th district | 212,399 | 99% |  Jim Baird (Republican) leading by 8.5 pts |
Republican over 99% | Republican | file made 12:02 PM ET (17:02 UTC, 9 Nov) |
| Indiana's 6th district | 201,646 | 99% |  Jefferson Shreve (Republican) leading by 10 pts |
Republican over 99% | Republican | file made 12:02 PM ET (17:02 UTC, 9 Nov) |
| Indiana's 7th district | 206,871 | 99% | 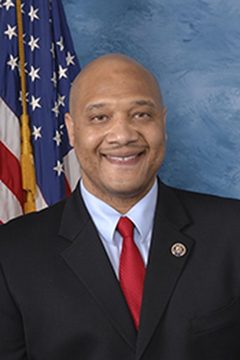 André Carson (Democrat) leading by 57 pts |
Democrat over 99% | Democrat | file made 12:02 PM ET (17:02 UTC, 9 Nov) |
| Indiana's 8th district | 212,534 | 99% | 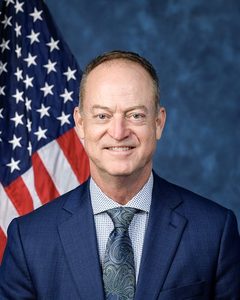 Mark Messmer (Republican) leading by 11 pts |
Republican over 99% | Republican | file made 12:02 PM ET (17:02 UTC, 9 Nov) |
| Indiana's 9th district | 224,790 | 98% | 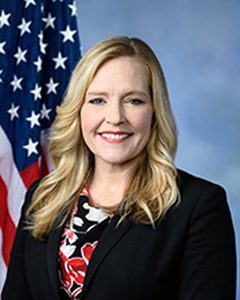 Erin Houchin (Republican) leading by 10 pts |
Republican over 99% | Republican | file made 12:02 PM ET (17:02 UTC, 9 Nov) |
| Kansas's 1st district | 253,318 | 99% 99 of 100 units |
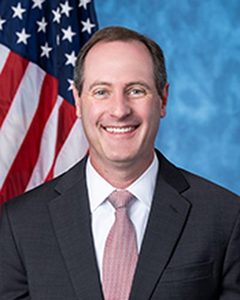 Tracey Mann (Republican) leading by 22 pts |
Republican over 99% | Republican | updated 12:17 PM ET (17:17 UTC, 9 Nov) as reported by AP (as published on the BBC's results page) |
| Kansas's 2nd district | 245,721 | 99% 99 of 100 units |
 Derek Schmidt (Republican) leading by 6.2 pts |
Republican over 99% | Republican | updated 12:17 PM ET (17:17 UTC, 9 Nov) as reported by AP (as published on the BBC's results page) |
| Kansas's 3rd district | 337,509 | 99% 99 of 100 units |
 Sharice Davids (Democrat) leading by 21 pts |
Democrat over 99% | Democrat | updated 12:13 PM ET (17:13 UTC, 9 Nov) as reported by AP (as published on the BBC's results page) |
| Kansas's 4th district | 259,910 | 99% 99 of 100 units |
 Ron Estes (Republican) leading by 9.5 pts |
Republican over 99% | Republican | updated 12:16 PM ET (17:16 UTC, 9 Nov) as reported by AP (as published on the BBC's results page) |
| Kentucky's 1st district | 229,170 | 99% 99 of 100 units |
 James Comer (Republican) leading by 35 pts |
Republican over 99% | Republican | updated 3:08 PM ET (20:08 UTC, 7 Nov) as reported by AP (as published on the BBC's results page) |
| Kentucky's 2nd district | 231,058 | 99% 99 of 100 units |
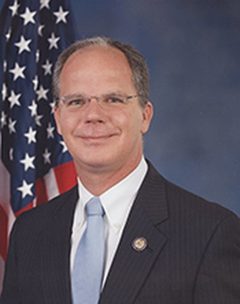 S. Guthrie (Republican) leading by 28 pts |
Republican over 99% | Republican | updated 3:08 PM ET (20:08 UTC, 7 Nov) as reported by AP (as published on the BBC's results page) |
| Kentucky's 3rd district | 248,500 | 99% 99 of 100 units |
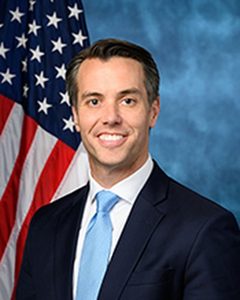 Morgan McGarvey (Democrat) leading by 41 pts |
Democrat over 99% | Democrat | updated 3:07 PM ET (20:07 UTC, 7 Nov) as reported by AP (as published on the BBC's results page) |
| Kentucky's 4th district | 253,820 | 99% 99 of 100 units |
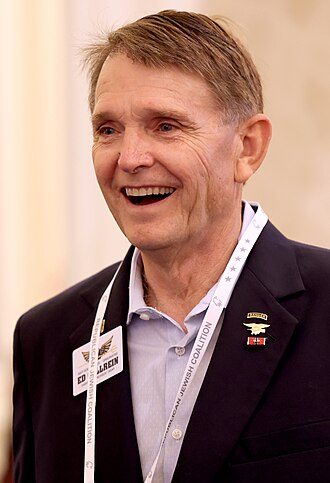 Ed Gallrein (Republican) leading by 13 pts |
Republican over 99% | Republican | updated 3:07 PM ET (20:07 UTC, 7 Nov) as reported by AP (as published on the BBC's results page) |
| Kentucky's 5th district | 196,468 | 99% 99 of 100 units |
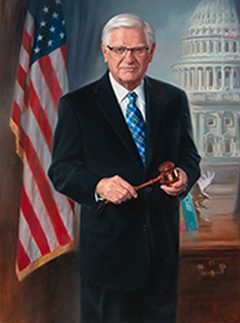 Hal Rogers (Republican) leading by 46 pts |
Republican over 99% | Republican | updated 3:08 PM ET (20:08 UTC, 7 Nov) as reported by AP (as published on the BBC's results page) |
| Kentucky's 6th district | 263,353 | 99% 99 of 100 units |
 Zach Dembo (Democrat) leading by 9.4 pts |
Democrat over 99% | Democrat | updated 3:07 PM ET (20:07 UTC, 7 Nov) as reported by AP (as published on the BBC's results page) |
| Louisiana's 1st district | 263,375 | 99% 99 of 100 units |
 Steve Scalise (Republican) leading by 27 pts |
Republican over 99% | Republican | updated 11:55 AM ET (16:55 UTC, 9 Nov) as reported by AP (as published on the BBC's results page) |
| Louisiana's 2nd district | 240,582 | 99% 99 of 100 units |
 Troy Carter (Democrat) leading by 65 pts |
Democrat over 99% | Democrat | updated 11:13 AM ET (16:13 UTC, 9 Nov) as reported by AP (as published on the BBC's results page) |
| Louisiana's 3rd district | 234,995 | 99% 99 of 100 units |
 Clay Higgins (Republican) leading by 34 pts |
Republican over 99% | Republican | updated 11:55 AM ET (16:55 UTC, 9 Nov) as reported by AP (as published on the BBC's results page) |
| Louisiana's 4th district | 230,352 | 99% 99 of 100 units |
 Mike Johnson (Republican) leading by 36 pts |
Republican over 99% | Republican | updated 11:55 AM ET (16:55 UTC, 9 Nov) as reported by AP (as published on the BBC's results page) |
| Louisiana's 5th district | 227,918 | 99% 99 of 100 units |
Patricia Moore (Democrat) leading by 0.7 pts | Republican over 99% | Republican | updated 12:06 PM ET (17:06 UTC, 9 Nov) as reported by AP (as published on the BBC's results page) |
| Louisiana's 6th district | 261,951 | 99% 99 of 100 units |
Chauna Banks (Democrat) leading by 0.3 pts | Republican over 99% | Republican | updated 11:13 AM ET (16:13 UTC, 9 Nov) as reported by AP (as published on the BBC's results page) |
| Massachusetts's 3rd district | 258,068 | 99% 99 of 100 units |
 Lori Trahan (Democrat) leading by 37 pts |
Democrat over 99% | Democrat | updated 12:05 PM ET (17:05 UTC, 9 Nov) as reported by AP (as published on the BBC's results page) |
| Massachusetts's 4th district | 290,261 | 99% 99 of 100 units |
 Jake Auchincloss (Democrat) leading by 33 pts |
Democrat over 99% | Democrat | updated 10:20 AM ET (15:20 UTC, 9 Nov) as reported by AP (as published on the BBC's results page) |
| Massachusetts's 6th district | 325,368 | 99% 99 of 100 units |
 Dan Koh (Democrat) leading by 27 pts |
Democrat over 99% | Democrat | updated 10:22 AM ET (15:22 UTC, 9 Nov) as reported by AP (as published on the BBC's results page) |
| Massachusetts's 8th district | 281,804 | 99% 99 of 100 units |
 Stephen Lynch (Democrat) leading by 43 pts |
Democrat over 99% | Democrat | updated 10:21 AM ET (15:21 UTC, 9 Nov) as reported by AP (as published on the BBC's results page) |
| Massachusetts's 9th district | 350,869 | 99% 99 of 100 units |
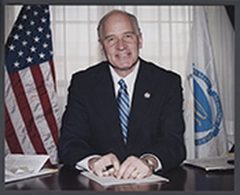 Bill Keating (Democrat) leading by 22 pts |
Democrat over 99% | Democrat | updated 10:22 AM ET (15:22 UTC, 9 Nov) as reported by AP (as published on the BBC's results page) |
| Maryland's 2nd district | 259,901 | 86% 86 of 100 units |
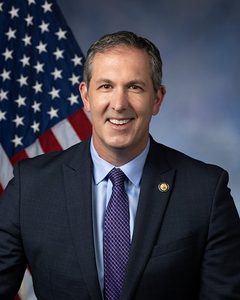 John Olszewski (Democrat) leading by 27 pts |
Democrat over 99% | Democrat | updated 10:56 AM ET (15:56 UTC, 9 Nov) as reported by AP (as published on the BBC's results page) |
| Maryland's 3rd district | 296,372 | 91% 91 of 100 units |
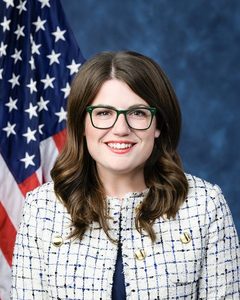 Sarah Elfreth (Democrat) leading by 35 pts |
Democrat over 99% | Democrat | updated 5:14 PM ET (22:14 UTC, 8 Nov) as reported by AP (as published on the BBC's results page) |
| Maryland's 4th district | 178,947 | 82% 82 of 100 units |
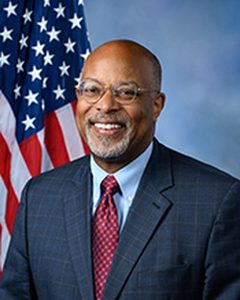 Glenn Ivey (Democrat) leading by 83 pts |
Democrat over 99% | Democrat | updated 5:15 PM ET (22:15 UTC, 8 Nov) as reported by AP (as published on the BBC's results page) |
| Maryland's 5th district | 298,371 | 90% 90 of 100 units |
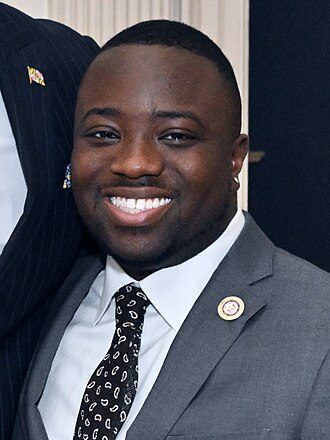 Adrian Boafo (Democrat) leading by 40 pts |
Democrat over 99% | Democrat | updated 5:14 PM ET (22:14 UTC, 8 Nov) as reported by AP (as published on the BBC's results page) |
| Maryland's 6th district | 262,351 | 91% 91 of 100 units |
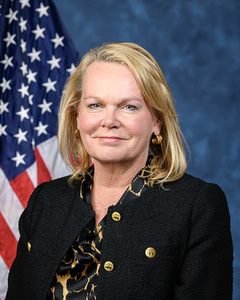 April McClain Delaney (Democrat) leading by 20 pts |
Democrat over 99% | Democrat | updated 5:15 PM ET (22:15 UTC, 8 Nov) as reported by AP (as published on the BBC's results page) |
| Maryland's 7th district | 188,854 | 82% 82 of 100 units |
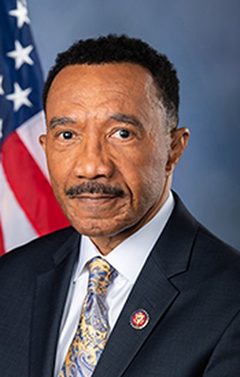 Kweisi Mfume (Democrat) leading by 69 pts |
Democrat over 99% | Democrat | updated 10:56 AM ET (15:56 UTC, 9 Nov) as reported by AP (as published on the BBC's results page) |
| Maryland's 8th district | 259,462 | 81% 81 of 100 units |
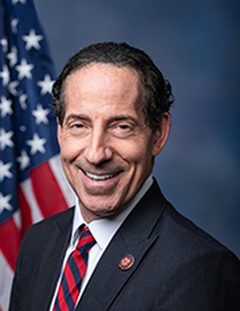 Jamie Raskin (Democrat) leading by 68 pts |
Democrat over 99% | Democrat | updated 5:14 PM ET (22:14 UTC, 8 Nov) as reported by AP (as published on the BBC's results page) |
| Maine's 1st district | 380,069 | 99% 99 of 100 units |
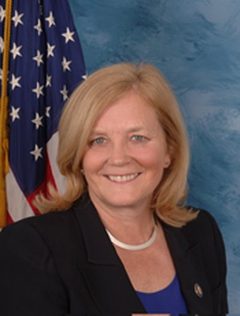 Chellie Pingree (Democrat) leading by 32 pts |
Democrat over 99% | Democrat | updated 12:11 PM ET (17:11 UTC, 9 Nov) as reported by AP (as published on the BBC's results page) |
| Michigan's 1st district | 403,805 | 97% 97 of 100 units |
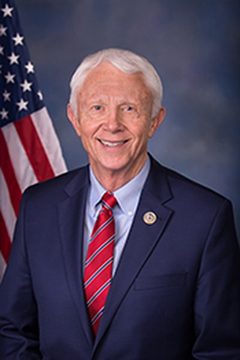 Jack Bergman (Republican) leading by 9.6 pts |
Republican over 99% | Republican | updated 12:05 PM ET (17:05 UTC, 9 Nov) as reported by AP (as published on the BBC's results page) |
| Michigan's 2nd district | 358,458 | 95% 95 of 100 units |
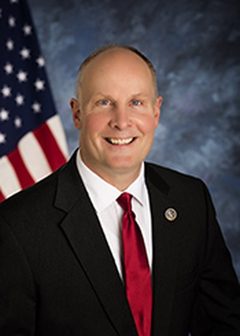 John Moolenaar (Republican) leading by 25 pts |
Republican over 99% | Republican | updated 12:03 PM ET (17:03 UTC, 9 Nov) as reported by AP (as published on the BBC's results page) |
| Michigan's 3rd district | 369,388 | 99% 99 of 100 units |
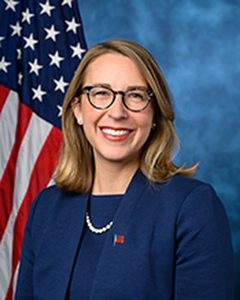 Hillary Scholten (Democrat) leading by 16 pts |
Democrat over 99% | Democrat | updated 12:03 PM ET (17:03 UTC, 9 Nov) as reported by AP (as published on the BBC's results page) |
| Michigan's 5th district | 337,427 | 95% 95 of 100 units |
 Tim Walberg (Republican) leading by 21 pts |
Republican over 99% | Republican | updated 12:02 PM ET (17:02 UTC, 9 Nov) as reported by AP (as published on the BBC's results page) |
| Michigan's 6th district | 407,161 | 99% 99 of 100 units |
 Debbie Dingell (Democrat) leading by 37 pts |
Democrat over 99% | Democrat | updated 12:05 PM ET (17:05 UTC, 9 Nov) as reported by AP (as published on the BBC's results page) |
| Michigan's 8th district | 352,770 | 98% 98 of 100 units |
 Kristen McDonald Rivet (Democrat) leading by 14 pts |
Democrat over 99% | Democrat | updated 4:55 PM ET (21:55 UTC, 5 Nov) as reported by AP (as published on the BBC's results page) |
| Michigan's 9th district | 395,591 | 98% 98 of 100 units |
 Lisa McClain (Republican) leading by 28 pts |
Republican over 99% | Republican | updated 12:03 PM ET (17:03 UTC, 9 Nov) as reported by AP (as published on the BBC's results page) |
| Michigan's 10th district | 358,665 | 99% 99 of 100 units |
 Christina Hines (Democrat) leading by 7.2 pts |
Democrat over 99% | Democrat | updated 12:03 PM ET (17:03 UTC, 9 Nov) as reported by AP (as published on the BBC's results page) |
| Michigan's 11th district | 392,301 | 99% 99 of 100 units |
 Jeremy Moss (Democrat) leading by 24 pts |
Democrat over 99% | Democrat | updated 12:03 PM ET (17:03 UTC, 9 Nov) as reported by AP (as published on the BBC's results page) |
| Michigan's 12th district | 325,322 | 98% 98 of 100 units |
 Rashida Tlaib (Democrat) leading by 55 pts |
Democrat over 99% | Democrat | updated 12:04 PM ET (17:04 UTC, 9 Nov) as reported by AP (as published on the BBC's results page) |
| Michigan's 13th district | 274,324 | 69% 69 of 100 units |
 Donavan McKinney (Democrat) leading by 57 pts |
Democrat over 99% | Democrat | updated 12:05 PM ET (17:05 UTC, 9 Nov) as reported by AP (as published on the BBC's results page) |
| Minnesota's 2nd district | 375,236 | 99% 260 of 260 units |
 Matt Little (Democrat) leading by 14 pts |
Democrat over 99% | Democrat | updated 12:18 PM ET (17:18 UTC, 9 Nov) |
| Minnesota's 3rd district | 377,996 | 99% 229 of 229 units |
 Kelly Morrison (Democrat) leading by 28 pts |
Democrat over 99% | Democrat | updated 12:18 PM ET (17:18 UTC, 9 Nov) |
| Minnesota's 4th district | 336,243 | 99% 212 of 212 units |
 Betty McCollum (Democrat) leading by 46 pts |
Democrat over 99% | Democrat | updated 12:18 PM ET (17:18 UTC, 9 Nov) |
| Minnesota's 5th district | 343,507 | 99% 217 of 217 units |
 Ilhan Omar (Democrat) leading by 60 pts |
Democrat over 99% | Democrat | updated 12:18 PM ET (17:18 UTC, 9 Nov) |
| Minnesota's 6th district | 367,341 | 99% 276 of 276 units |
 Tom Emmer (Republican) leading by 12 pts |
Republican over 99% | Republican | updated 12:18 PM ET (17:18 UTC, 9 Nov) |
| Minnesota's 7th district | 330,856 | 99% 1327 of 1327 units |
 Michelle Fischbach (Republican) leading by 30 pts |
Republican over 99% | Republican | updated 12:18 PM ET (17:18 UTC, 9 Nov) |
| Minnesota's 8th district | 359,455 | 99% 834 of 834 units |
 Pete Stauber (Republican) leading by 6.2 pts |
Republican over 99% | Republican | updated 12:18 PM ET (17:18 UTC, 9 Nov) |
| Missouri's 1st district | 232,150 | 99% 99 of 100 units |
 Wesley Bell (Democrat) leading by 68 pts |
Democrat over 99% | Democrat | updated 4:24 PM ET (21:24 UTC, 7 Nov) as reported by AP (as published on the BBC's results page) |
| Missouri's 2nd district | 331,391 | 99% 99 of 100 units |
 Fred Wellman (Democrat) leading by 4.9 pts |
Democrat over 99% | Democrat | updated 4:06 PM ET (21:06 UTC, 7 Nov) as reported by AP (as published on the BBC's results page) |
| Missouri's 3rd district | 282,210 | 99% 99 of 100 units |
 Bob Onder (Republican) leading by 8.5 pts |
Republican over 99% | Republican | updated 4:06 PM ET (21:06 UTC, 7 Nov) as reported by AP (as published on the BBC's results page) |
| Missouri's 4th district | 250,720 | 99% 99 of 100 units |
 Mark Alford (Republican) leading by 26 pts |
Republican over 99% | Republican | updated 4:26 PM ET (21:26 UTC, 7 Nov) as reported by AP (as published on the BBC's results page) |
| Missouri's 5th district | 257,956 | 99% 99 of 100 units |
 Emanuel Cleaver (Democrat) leading by 41 pts |
Democrat over 99% | Democrat | updated 2:19 PM ET (19:19 UTC, 7 Nov) as reported by AP (as published on the BBC's results page) |
| Missouri's 6th district | 257,854 | 99% 99 of 100 units |
 Chris Stigall (Republican) leading by 20 pts |
Republican over 99% | Republican | updated 10:52 AM ET (15:52 UTC, 9 Nov) as reported by AP (as published on the BBC's results page) |
| Missouri's 7th district | 253,422 | 99% 99 of 100 units |
 Eric Burlison (Republican) leading by 27 pts |
Republican over 99% | Republican | updated 1:14 PM ET (18:14 UTC, 8 Nov) as reported by AP (as published on the BBC's results page) |
| Missouri's 8th district | 225,426 | 99% 99 of 100 units |
 Jason Smith (Republican) leading by 39 pts |
Republican over 99% | Republican | updated 4:25 PM ET (21:25 UTC, 7 Nov) as reported by AP (as published on the BBC's results page) |
| Mississippi's 1st district | 239,607 | 98% 98 of 100 units |
 Trent Kelly (Republican) leading by 18 pts |
Republican over 99% | Republican | updated 11:34 AM ET (16:34 UTC, 9 Nov) as reported by AP (as published on the BBC's results page) |
| Mississippi's 2nd district | 244,403 | 97% 97 of 100 units |
 Bennie Thompson (Democrat) leading by 38 pts |
Democrat over 99% | Democrat | updated 11:42 AM ET (16:42 UTC, 9 Nov) as reported by AP (as published on the BBC's results page) |
| Mississippi's 3rd district | 251,707 | 97% 97 of 100 units |
 Michael Guest (Republican) leading by 16 pts |
Republican over 99% | Republican | updated 11:24 AM ET (16:24 UTC, 9 Nov) as reported by AP (as published on the BBC's results page) |
| Mississippi's 4th district | 214,705 | 98% 98 of 100 units |
 Mike Ezell (Republican) leading by 25 pts |
Republican over 99% | Republican | updated 11:27 AM ET (16:27 UTC, 9 Nov) as reported by AP (as published on the BBC's results page) |
| Montana's 2nd district | 218,859 | 98% 98 of 100 units |
 Troy Downing (Republican) leading by 26 pts |
Republican over 99% | Republican | updated 5:26 PM ET (22:26 UTC, 6 Nov) as reported by AP (as published on the BBC's results page) |
| North Carolina's 2nd district | 326,962 | 99% 156 of 156 units |
 Deborah K. Ross (Democrat) leading by 52 pts |
Democrat over 99% | Democrat | updated 12:10 PM ET (17:10 UTC, 9 Nov) |
| North Carolina's 4th district | 358,015 | 99% 142 of 142 units |
 Valerie P. Foushee (Democrat) leading by 60 pts |
Democrat over 99% | Democrat | updated 12:10 PM ET (17:10 UTC, 9 Nov) |
| North Carolina's 11th district | 342,379 | 99% 290 of 290 units |
 Jamie Ager (Democrat) leading by 16 pts |
Democrat over 99% | Democrat | updated 12:10 PM ET (17:10 UTC, 9 Nov) |
| North Carolina's 12th district | 270,536 | 99% 145 of 145 units |
 Alma S. Adams (Democrat) leading by 62 pts |
Democrat over 99% | Democrat | updated 12:10 PM ET (17:10 UTC, 9 Nov) |
| North Dakota's at-large district | 234,255 | 98% 98 of 100 units |
 Julie Fedorchak (Republican) leading by 21 pts |
Republican over 99% | Republican | updated 5:14 PM ET (22:14 UTC, 6 Nov) as reported by AP (as published on the BBC's results page) |
| Nebraska's 2nd district | 253,836 | 96% 334 of 334 units |
 Denise Powell (Democrat) leading by 16 pts |
Democrat over 99% | Democrat | file made 12:26 PM ET (17:26 UTC, 9 Nov) |
| Nebraska's 3rd district | 245,023 | 98% 639 of 639 units |
 Adrian Smith (Republican) leading by 51 pts |
Republican over 99% | Republican | file made 12:26 PM ET (17:26 UTC, 9 Nov) |
| New Hampshire's 1st district | 315,944 | 99% 99 of 100 units |
 Stefany Shaheen (Democrat) leading by 14 pts |
Democrat over 99% | Democrat | updated 11:29 AM ET (16:29 UTC, 9 Nov) as reported by AP (as published on the BBC's results page) |
| New Hampshire's 2nd district | 315,922 | 99% 99 of 100 units |
 Maggie Goodlander (Democrat) leading by 20 pts |
Democrat over 99% | Democrat | updated 12:05 PM ET (17:05 UTC, 9 Nov) as reported by AP (as published on the BBC's results page) |
| New Jersey's 1st district | 257,478 | 96% 96 of 100 units |
 Donald Norcross (Democrat) leading by 41 pts |
Democrat over 99% | Democrat | updated 9:54 AM ET (14:54 UTC, 9 Nov) as reported by AP (as published on the BBC's results page) |
| New Jersey's 3rd district | 274,422 | 96% 96 of 100 units |
 Herb Conaway (Democrat) leading by 27 pts |
Democrat over 99% | Democrat | updated 9:54 AM ET (14:54 UTC, 9 Nov) as reported by AP (as published on the BBC's results page) |
| New Jersey's 4th district | 265,368 | 98% 98 of 100 units |
 Christopher Smith (Republican) leading by 18 pts |
Republican over 99% | Republican | updated 3:41 PM ET (20:41 UTC, 6 Nov) as reported by AP (as published on the BBC's results page) |
| New Jersey's 5th district | 270,002 | 96% 96 of 100 units |
 Josh Gottheimer (Democrat) leading by 28 pts |
Democrat over 99% | Democrat | updated 5:35 PM ET (22:35 UTC, 5 Nov) as reported by AP (as published on the BBC's results page) |
| New Jersey's 6th district | 211,992 | 97% 97 of 100 units |
 Frank Pallone (Democrat) leading by 39 pts |
Democrat over 99% | Democrat | updated 10:30 AM ET (15:30 UTC, 6 Nov) as reported by AP (as published on the BBC's results page) |
| New Jersey's 7th district | 331,476 | 97% 97 of 100 units |
 Rebecca Bennett (Democrat) leading by 16 pts |
Democrat over 99% | Democrat | updated 8:46 AM ET (13:46 UTC, 9 Nov) as reported by AP (as published on the BBC's results page) |
| New Jersey's 9th district | 184,519 | 95% 95 of 100 units |
 Nelida Pou (Democrat) leading by 35 pts |
Democrat over 99% | Democrat | updated 5:33 PM ET (22:33 UTC, 6 Nov) as reported by AP (as published on the BBC's results page) |
| New Jersey's 10th district | 179,814 | 96% 96 of 100 units |
 LaMonica McIver (Democrat) leading by 69 pts |
Democrat over 99% | Democrat | updated 5:33 PM ET (22:33 UTC, 6 Nov) as reported by AP (as published on the BBC's results page) |
| New Jersey's 11th district | 279,906 | 96% 96 of 100 units |
 Analilia Mejia (Democrat) leading by 22 pts |
Democrat over 99% | Democrat | updated 5:31 PM ET (22:31 UTC, 6 Nov) as reported by AP (as published on the BBC's results page) |
| New Jersey's 12th district | 233,917 | 95% 95 of 100 units |
 Adam Hamawy (Democrat) leading by 42 pts |
Democrat over 99% | Democrat | updated 8:46 AM ET (13:46 UTC, 9 Nov) as reported by AP (as published on the BBC's results page) |
| New Mexico's 1st district | 282,547 | 99% 778 of 778 units |
 Melanie Ann Stansbury (Democrat) leading by 27 pts |
Democrat over 99% | Democrat | fetched (the feed gives no time) 12:27 PM ET (17:27 UTC, 9 Nov) |
| New Mexico's 2nd district | 210,600 | 98% 663 of 663 units |
 Gabriel Vasquez (Democrat) leading by 18 pts |
Democrat over 99% | Democrat | fetched (the feed gives no time) 12:27 PM ET (17:27 UTC, 9 Nov) |
| New Mexico's 3rd district | 229,247 | 98% 98 of 100 units |
 Teresa Leger Fernandez (Democrat) leading by 23 pts |
Democrat over 99% | Democrat | updated 3:35 PM ET (20:35 UTC, 6 Nov) as reported by AP (as published on the BBC's results page) |
| Nevada's 1st district | 238,045 | 99% 99 of 100 units |
 Dina Titus (Democrat) leading by 22 pts |
Democrat over 99% | Democrat | updated 9:09 PM ET (02:09 UTC, 7 Nov) as reported by AP (as published on the BBC's results page) |
| Nevada's 2nd district | 320,782 | 98% 98 of 100 units |
 Teresa Benitez-Thompson (Democrat) leading by 5.9 pts |
Democrat over 99% | Democrat | updated 9:03 PM ET (02:03 UTC, 8 Nov) as reported by AP (as published on the BBC's results page) |
| Nevada's 3rd district | 270,960 | 99% 99 of 100 units |
 Susie Lee (Democrat) leading by 21 pts |
Democrat over 99% | Democrat | updated 9:09 PM ET (02:09 UTC, 7 Nov) as reported by AP (as published on the BBC's results page) |
| Nevada's 4th district | 251,537 | 99% 99 of 100 units |
 Steven Horsford (Democrat) leading by 23 pts |
Democrat over 99% | Democrat | updated 9:09 PM ET (02:09 UTC, 7 Nov) as reported by AP (as published on the BBC's results page) |
| New York's 3rd district | 272,733 | 97% 97 of 100 units |
 Thomas Suozzi (Democrat) leading by 9.9 pts |
Democrat over 99% | Democrat | updated 10:29 AM ET (15:29 UTC, 6 Nov) as reported by AP (as published on the BBC's results page) |
| New York's 4th district | 288,407 | 98% 98 of 100 units |
 Laura Gillen (Democrat) leading by 13 pts |
Democrat over 99% | Democrat | updated 10:29 AM ET (15:29 UTC, 6 Nov) as reported by AP (as published on the BBC's results page) |
| New York's 5th district | 161,418 | 91% 91 of 100 units |
 Gregory Meeks (Democrat) leading by 61 pts |
Democrat over 99% | Democrat | updated 4:32 PM ET (21:32 UTC, 5 Nov) as reported by AP (as published on the BBC's results page) |
| New York's 6th district | 134,749 | 88% 88 of 100 units |
 Grace Meng (Democrat) leading by 38 pts |
Democrat over 99% | Democrat | updated 4:32 PM ET (21:32 UTC, 5 Nov) as reported by AP (as published on the BBC's results page) |
| New York's 7th district | 162,218 | 88% 88 of 100 units |
 Claire Valdez (Democrat) leading by 68 pts |
Democrat over 99% | Democrat | updated 4:32 PM ET (21:32 UTC, 5 Nov) as reported by AP (as published on the BBC's results page) |
| New York's 8th district | 162,404 | 87% 87 of 100 units |
 Hakeem Jeffries (Democrat) leading by 59 pts |
Democrat over 99% | Democrat | updated 4:32 PM ET (21:32 UTC, 5 Nov) as reported by AP (as published on the BBC's results page) |
| New York's 9th district | 178,465 | 87% 87 of 100 units |
 Yvette Clarke (Democrat) leading by 65 pts |
Democrat over 99% | Democrat | updated 4:32 PM ET (21:32 UTC, 5 Nov) as reported by AP (as published on the BBC's results page) |
| New York's 10th district | 201,120 | 88% 88 of 100 units |
 Brad Lander (Democrat) leading by 67 pts |
Democrat over 99% | Democrat | updated 4:32 PM ET (21:32 UTC, 5 Nov) as reported by AP (as published on the BBC's results page) |
| New York's 12th district | 250,781 | 86% 86 of 100 units |
 Micah Lasher (Democrat) leading by 57 pts |
Democrat over 99% | Democrat | updated 4:32 PM ET (21:32 UTC, 5 Nov) as reported by AP (as published on the BBC's results page) |
| New York's 13th district | 161,117 | 90% 90 of 100 units |
 Darializa Avila Chevalier (Democrat) leading by 76 pts |
Democrat over 99% | Democrat | updated 4:32 PM ET (21:32 UTC, 5 Nov) as reported by AP (as published on the BBC's results page) |
| New York's 14th district | 136,956 | 92% 92 of 100 units |
 Alexandria Ocasio-Cortez (Democrat) leading by 57 pts |
Democrat over 99% | Democrat | updated 4:32 PM ET (21:32 UTC, 5 Nov) as reported by AP (as published on the BBC's results page) |
| New York's 15th district | 122,169 | 90% 90 of 100 units |
 Ritchie Torres (Democrat) leading by 66 pts |
Democrat over 99% | Democrat | updated 4:32 PM ET (21:32 UTC, 5 Nov) as reported by AP (as published on the BBC's results page) |
| New York's 16th district | 227,926 | 83% 83 of 100 units |
 George Latimer (Democrat) leading by 52 pts |
Democrat over 99% | Democrat | updated 9:35 AM ET (14:35 UTC, 9 Nov) as reported by AP (as published on the BBC's results page) |
| New York's 18th district | 268,816 | 89% 89 of 100 units |
 Pat Ryan (Democrat) leading by 26 pts |
Democrat over 99% | Democrat | updated 11:51 AM ET (16:51 UTC, 6 Nov) as reported by AP (as published on the BBC's results page) |
| New York's 19th district | 293,024 | 97% 97 of 100 units |
 Josh Riley (Democrat) leading by 15 pts |
Democrat over 99% | Democrat | updated 2:32 PM ET (19:32 UTC, 6 Nov) as reported by AP (as published on the BBC's results page) |
| New York's 20th district | 286,085 | 96% 96 of 100 units |
 Paul Tonko (Democrat) leading by 27 pts |
Democrat over 99% | Democrat | updated 4:50 PM ET (21:50 UTC, 6 Nov) as reported by AP (as published on the BBC's results page) |
| New York's 22nd district | 273,549 | 96% 96 of 100 units |
 John Mannion (Democrat) leading by 17 pts |
Democrat over 99% | Democrat | updated 11:55 AM ET (16:55 UTC, 9 Nov) as reported by AP (as published on the BBC's results page) |
| New York's 23rd district | 302,515 | 98% 98 of 100 units |
 Nicholas Langworthy (Republican) leading by 20 pts |
Republican over 99% | Republican | updated 11:20 AM ET (16:20 UTC, 9 Nov) as reported by AP (as published on the BBC's results page) |
| New York's 24th district | 283,863 | 96% 96 of 100 units |
 Claudia Tenney (Republican) leading by 21 pts |
Republican over 99% | Republican | updated 11:27 AM ET (16:27 UTC, 9 Nov) as reported by AP (as published on the BBC's results page) |
| New York's 25th district | 280,606 | 98% 98 of 100 units |
 Joseph Morelle (Democrat) leading by 26 pts |
Democrat over 99% | Democrat | updated 5:22 PM ET (22:22 UTC, 5 Nov) as reported by AP (as published on the BBC's results page) |
| New York's 26th district | 248,869 | 86% 86 of 100 units |
 Timothy Kennedy (Democrat) leading by 32 pts |
Democrat over 99% | Democrat | updated 9:53 AM ET (14:53 UTC, 9 Nov) as reported by AP (as published on the BBC's results page) |
| Ohio's 1st district | 324,471 | 98% 98 of 100 units |
 Greg Landsman (Democrat) leading by 11 pts |
Democrat over 99% | Democrat | updated 2:35 PM ET (19:35 UTC, 6 Nov) as reported by AP (as published on the BBC's results page) |
| Ohio's 2nd district | 273,049 | 98% 98 of 100 units |
 David Taylor (Republican) leading by 28 pts |
Republican over 99% | Republican | updated 3:19 PM ET (20:19 UTC, 6 Nov) as reported by AP (as published on the BBC's results page) |
| Ohio's 3rd district | 300,332 | 97% 97 of 100 units |
 Joyce Beatty (Democrat) leading by 54 pts |
Democrat over 99% | Democrat | updated 2:31 PM ET (19:31 UTC, 6 Nov) as reported by AP (as published on the BBC's results page) |
| Ohio's 4th district | 305,586 | 98% 98 of 100 units |
 Jim Jordan (Republican) leading by 33 pts |
Republican over 99% | Republican | updated 4:33 PM ET (21:33 UTC, 6 Nov) as reported by AP (as published on the BBC's results page) |
| Ohio's 5th district | 301,101 | 98% 98 of 100 units |
 Bob Latta (Republican) leading by 12 pts |
Republican over 99% | Republican | updated 1:56 PM ET (18:56 UTC, 6 Nov) as reported by AP (as published on the BBC's results page) |
| Ohio's 6th district | 270,985 | 98% 98 of 100 units |
 Michael Rulli (Republican) leading by 21 pts |
Republican over 99% | Republican | updated 3:37 PM ET (20:37 UTC, 6 Nov) as reported by AP (as published on the BBC's results page) |
| Ohio's 7th district | 328,791 | 98% 98 of 100 units |
 Brian Poindexter (Democrat) leading by 9.9 pts |
Democrat over 99% | Democrat | updated 2:28 PM ET (19:28 UTC, 6 Nov) as reported by AP (as published on the BBC's results page) |
| Ohio's 8th district | 323,517 | 98% 98 of 100 units |
 Warren Davidson (Republican) leading by 4.3 pts |
Republican over 99% | Republican | updated 2:35 PM ET (19:35 UTC, 6 Nov) as reported by AP (as published on the BBC's results page) |
| Ohio's 9th district | 302,136 | 98% 98 of 100 units |
 Marcy Kaptur (Democrat) leading by 5.5 pts |
Democrat over 99% | Democrat | updated 3:07 PM ET (20:07 UTC, 6 Nov) as reported by AP (as published on the BBC's results page) |
| Ohio's 11th district | 263,344 | 98% 98 of 100 units |
 Shontel Brown (Democrat) leading by 67 pts |
Democrat over 99% | Democrat | updated 2:28 PM ET (19:28 UTC, 6 Nov) as reported by AP (as published on the BBC's results page) |
| Ohio's 12th district | 323,137 | 98% 98 of 100 units |
 Troy Balderson (Republican) leading by 19 pts |
Republican over 99% | Republican | updated 4:33 PM ET (21:33 UTC, 6 Nov) as reported by AP (as published on the BBC's results page) |
| Ohio's 13th district | 317,775 | 98% 98 of 100 units |
 Emilia Sykes (Democrat) leading by 22 pts |
Democrat over 99% | Democrat | updated 3:15 PM ET (20:15 UTC, 6 Nov) as reported by AP (as published on the BBC's results page) |
| Ohio's 14th district | 326,118 | 98% 98 of 100 units |
 David Joyce (Republican) leading by 10 pts |
Republican over 99% | Republican | updated 3:02 PM ET (20:02 UTC, 6 Nov) as reported by AP (as published on the BBC's results page) |
| Ohio's 15th district | 287,647 | 97% 97 of 100 units |
 Don Leonard (Democrat) leading by 6.6 pts |
Democrat over 99% | Democrat | updated 2:31 PM ET (19:31 UTC, 6 Nov) as reported by AP (as published on the BBC's results page) |
| Oklahoma's 1st district | 231,781 | 99% 99 of 100 units |
 Mark Tedford (Republican) leading by 4.6 pts |
Republican over 99% | Republican | updated 7:28 PM ET (00:28 UTC, 6 Nov) as reported by AP (as published on the BBC's results page) |
| Oklahoma's 2nd district | 211,874 | 99% 99 of 100 units |
 Josh Brecheen (Republican) leading by 39 pts |
Republican over 99% | Republican | updated 7:28 PM ET (00:28 UTC, 6 Nov) as reported by AP (as published on the BBC's results page) |
| Oklahoma's 3rd district | 190,925 | 99% 99 of 100 units |
 Frank Lucas (Republican) leading by 28 pts |
Republican over 99% | Republican | updated 7:28 PM ET (00:28 UTC, 6 Nov) as reported by AP (as published on the BBC's results page) |
| Oklahoma's 4th district | 218,008 | 99% 99 of 100 units |
 Tom Cole (Republican) leading by 18 pts |
Republican over 99% | Republican | updated 7:28 PM ET (00:28 UTC, 6 Nov) as reported by AP (as published on the BBC's results page) |
| Oregon's 1st district | 305,012 | 92% 92 of 100 units |
 Suzanne Bonamici (Democrat) leading by 42 pts |
Democrat over 99% | Democrat | updated 10:25 AM ET (15:25 UTC, 9 Nov) as reported by AP (as published on the BBC's results page) |
| Oregon's 2nd district | 303,369 | 95% 95 of 100 units |
 Cliff Bentz (Republican) leading by 23 pts |
Republican over 99% | Republican | updated 10:25 AM ET (15:25 UTC, 9 Nov) as reported by AP (as published on the BBC's results page) |
| Oregon's 3rd district | 301,022 | 95% 95 of 100 units |
 Maxine Dexter (Democrat) leading by 55 pts |
Democrat over 99% | Democrat | updated 10:24 AM ET (15:24 UTC, 9 Nov) as reported by AP (as published on the BBC's results page) |
| Oregon's 4th district | 334,724 | 96% 96 of 100 units |
 Val Hoyle (Democrat) leading by 11 pts |
Democrat over 99% | Democrat | updated 10:24 AM ET (15:24 UTC, 9 Nov) as reported by AP (as published on the BBC's results page) |
| Oregon's 5th district | 346,544 | 93% 93 of 100 units |
 Janelle Bynum (Democrat) leading by 11 pts |
Democrat over 99% | Democrat | updated 10:24 AM ET (15:24 UTC, 9 Nov) as reported by AP (as published on the BBC's results page) |
| Pennsylvania's 1st district | 356,633 | 99% 99 of 100 units |
 Bob Harvie (Democrat) leading by 5.5 pts |
Democrat over 99% | Democrat | updated 12:07 PM ET (17:07 UTC, 9 Nov) as reported by AP (as published on the BBC's results page) |
| Pennsylvania's 2nd district | 184,149 | 99% 99 of 100 units |
 Brendan Boyle (Democrat) leading by 62 pts |
Democrat over 99% | Democrat | updated 12:08 PM ET (17:08 UTC, 9 Nov) as reported by AP (as published on the BBC's results page) |
| Pennsylvania's 4th district | 344,921 | 99% 99 of 100 units |
 Madeleine Dean (Democrat) leading by 34 pts |
Democrat over 99% | Democrat | updated 9:10 AM ET (14:10 UTC, 9 Nov) as reported by AP (as published on the BBC's results page) |
| Pennsylvania's 5th district | 296,236 | 99% 99 of 100 units |
 Mary Scanlon (Democrat) leading by 44 pts |
Democrat over 99% | Democrat | updated 12:07 PM ET (17:07 UTC, 9 Nov) as reported by AP (as published on the BBC's results page) |
| Pennsylvania's 6th district | 310,600 | 99% 99 of 100 units |
 Chrissy Houlahan (Democrat) leading by 29 pts |
Democrat over 99% | Democrat | updated 12:09 PM ET (17:09 UTC, 9 Nov) as reported by AP (as published on the BBC's results page) |
| Pennsylvania's 7th district | 293,281 | 99% 99 of 100 units |
 Bob Brooks (Democrat) leading by 12 pts |
Democrat over 99% | Democrat | updated 12:09 PM ET (17:09 UTC, 9 Nov) as reported by AP (as published on the BBC's results page) |
| Pennsylvania's 8th district | 282,732 | 99% 99 of 100 units |
 Paige Cognetti (Democrat) leading by 8.9 pts |
Democrat over 99% | Democrat | updated 12:09 PM ET (17:09 UTC, 9 Nov) as reported by AP (as published on the BBC's results page) |
| Pennsylvania's 9th district | 269,732 | 99% 99 of 100 units |
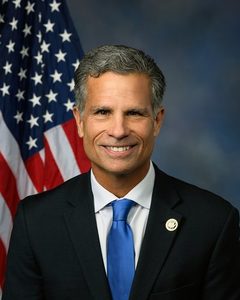 Dan Meuser (Republican) leading by 23 pts |
Republican over 99% | Republican | updated 12:08 PM ET (17:08 UTC, 9 Nov) as reported by AP (as published on the BBC's results page) |
| Pennsylvania's 10th district | 315,402 | 99% 99 of 100 units |
 Janelle Stelson (Democrat) leading by 10 pts |
Democrat over 99% | Democrat | updated 12:07 PM ET (17:07 UTC, 9 Nov) as reported by AP (as published on the BBC's results page) |
| Pennsylvania's 11th district | 301,355 | 99% 99 of 100 units |
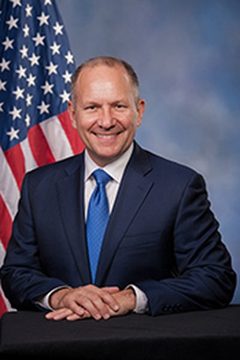 Lloyd Smucker (Republican) leading by 11 pts |
Republican over 99% | Republican | updated 12:07 PM ET (17:07 UTC, 9 Nov) as reported by AP (as published on the BBC's results page) |
| Pennsylvania's 12th district | 296,776 | 99% 99 of 100 units |
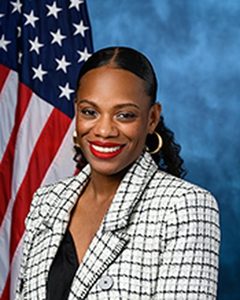 Summer Lee (Democrat) leading by 31 pts |
Democrat over 99% | Democrat | updated 12:07 PM ET (17:07 UTC, 9 Nov) as reported by AP (as published on the BBC's results page) |
| Pennsylvania's 13th district | 281,262 | 99% 99 of 100 units |
 John Joyce (Republican) leading by 35 pts |
Republican over 99% | Republican | updated 12:07 PM ET (17:07 UTC, 9 Nov) as reported by AP (as published on the BBC's results page) |
| Pennsylvania's 14th district | 276,520 | 99% 99 of 100 units |
 Guy Reschenthaler (Republican) leading by 15 pts |
Republican over 99% | Republican | updated 12:09 PM ET (17:09 UTC, 9 Nov) as reported by AP (as published on the BBC's results page) |
| Pennsylvania's 15th district | 268,035 | 99% 99 of 100 units |
 Glenn Thompson (Republican) leading by 28 pts |
Republican over 99% | Republican | updated 12:09 PM ET (17:09 UTC, 9 Nov) as reported by AP (as published on the BBC's results page) |
| Pennsylvania's 16th district | 286,605 | 99% 99 of 100 units |
 Mike Kelly (Republican) leading by 7.7 pts |
Republican over 99% | Republican | updated 12:07 PM ET (17:07 UTC, 9 Nov) as reported by AP (as published on the BBC's results page) |
| Pennsylvania's 17th district | 330,630 | 99% 99 of 100 units |
 Chris Deluzio (Democrat) leading by 26 pts |
Democrat over 99% | Democrat | updated 12:07 PM ET (17:07 UTC, 9 Nov) as reported by AP (as published on the BBC's results page) |
| Rhode Island's 1st district | 163,060 | 98% 98 of 100 units |
 Gabriel Amo (Democrat) leading by 41 pts |
Democrat over 99% | Democrat | updated 11:00 AM ET (16:00 UTC, 9 Nov) as reported by AP (as published on the BBC's results page) |
| Rhode Island's 2nd district | 195,141 | 98% 98 of 100 units |
 Seth Magaziner (Democrat) leading by 24 pts |
Democrat over 99% | Democrat | updated 11:00 AM ET (16:00 UTC, 9 Nov) as reported by AP (as published on the BBC's results page) |
| South Carolina's 3rd district | 273,192 | 99% 99 of 100 units |
 Sheri Biggs (Republican) leading by 29 pts |
Republican over 99% | Republican | updated 4:48 PM ET (21:48 UTC, 6 Nov) as reported by AP (as published on the BBC's results page) |
| South Carolina's 4th district | 284,193 | 99% 99 of 100 units |
 William Timmons (Republican) leading by 6.1 pts |
Republican over 99% | Republican | updated 4:03 PM ET (21:03 UTC, 6 Nov) as reported by AP (as published on the BBC's results page) |
| South Carolina's 5th district | 286,858 | 99% 99 of 100 units |
 Wes Climer (Republican) leading by 5.7 pts |
Republican over 99% | Republican | updated 4:50 PM ET (21:50 UTC, 6 Nov) as reported by AP (as published on the BBC's results page) |
| South Carolina's 6th district | 260,742 | 99% 99 of 100 units |
 James Clyburn (Democrat) leading by 39 pts |
Democrat over 99% | Democrat | updated 6:21 PM ET (23:21 UTC, 6 Nov) as reported by AP (as published on the BBC's results page) |
| South Carolina's 7th district | 304,088 | 99% 99 of 100 units |
 Russell Fry (Republican) leading by 13 pts |
Republican over 99% | Republican | updated 4:51 PM ET (21:51 UTC, 6 Nov) as reported by AP (as published on the BBC's results page) |
| South Dakota's at-large district | 305,585 | 99% 671 of 671 units |
 Marty Jackley (Republican) leading by 28 pts |
Republican over 99% | Republican | file made 12:25 PM ET (17:25 UTC, 9 Nov) |
| Tennessee's 1st district | 209,355 | 99% 99 of 100 units |
 Diana Harshbarger (Republican) leading by 38 pts |
Republican over 99% | Republican | updated 9:10 AM ET (14:10 UTC, 6 Nov) as reported by AP (as published on the BBC's results page) |
| Tennessee's 2nd district | 250,980 | 99% 99 of 100 units |
 Tim Burchett (Republican) leading by 17 pts |
Republican over 99% | Republican | updated 9:10 AM ET (14:10 UTC, 6 Nov) as reported by AP (as published on the BBC's results page) |
| Tennessee's 3rd district | 236,358 | 98% 98 of 100 units |
 Chuck Fleischmann (Republican) leading by 17 pts |
Republican over 99% | Republican | updated 9:10 AM ET (14:10 UTC, 6 Nov) as reported by AP (as published on the BBC's results page) |
| Tennessee's 5th district | 213,705 | 99% 99 of 100 units |
 Charlie Hatcher (Republican) leading by 4.9 pts |
Republican over 99% | Republican | updated 9:10 AM ET (14:10 UTC, 6 Nov) as reported by AP (as published on the BBC's results page) |
| Tennessee's 8th district | 220,906 | 99% 99 of 100 units |
 David Kustoff (Republican) leading by 5.3 pts |
Republican over 99% | Republican | updated 9:10 AM ET (14:10 UTC, 6 Nov) as reported by AP (as published on the BBC's results page) |
| Texas's 1st district | 263,585 | 99% 99 of 100 units |
 Nathaniel Moran (Republican) leading by 38 pts |
Republican over 99% | Republican | updated 2:38 PM ET (19:38 UTC, 6 Nov) as reported by AP (as published on the BBC's results page) |
| Texas's 3rd district | 320,910 | 99% 99 of 100 units |
 Keith Self (Republican) leading by 5.5 pts |
Republican over 99% | Republican | updated 2:36 PM ET (19:36 UTC, 6 Nov) as reported by AP (as published on the BBC's results page) |
| Texas's 4th district | 306,394 | 99% 99 of 100 units |
 Pat Fallon (Republican) leading by 12 pts |
Republican over 99% | Republican | updated 10:19 AM ET (15:19 UTC, 9 Nov) as reported by AP (as published on the BBC's results page) |
| Texas's 6th district | 268,408 | 99% 99 of 100 units |
 Jake Ellzey (Republican) leading by 4.3 pts |
Republican over 99% | Republican | updated 10:18 AM ET (15:18 UTC, 9 Nov) as reported by AP (as published on the BBC's results page) |
| Texas's 7th district | 226,493 | 99% 99 of 100 units |
 Lizzie Pannill Fletcher (Democrat) leading by 43 pts |
Democrat over 99% | Democrat | updated 10:19 AM ET (15:19 UTC, 9 Nov) as reported by AP (as published on the BBC's results page) |
| Texas's 8th district | 266,466 | 99% 99 of 100 units |
 Jessica Hart Steinmann (Republican) leading by 6.4 pts |
Republican over 99% | Republican | updated 10:19 AM ET (15:19 UTC, 9 Nov) as reported by AP (as published on the BBC's results page) |
| Texas's 9th district | 170,419 | 99% 99 of 100 units |
 Leticia Gutierrez (Democrat) leading by 15 pts |
Democrat over 99% | Democrat | updated 10:19 AM ET (15:19 UTC, 9 Nov) as reported by AP (as published on the BBC's results page) |
| Texas's 10th district | 300,257 | 99% 99 of 100 units |
Chris Gober (Republican) leading by 7.5 pts | Republican over 99% | Republican | updated 10:19 AM ET (15:19 UTC, 9 Nov) as reported by AP (as published on the BBC's results page) |
| Texas's 11th district | 232,980 | 99% 99 of 100 units |
 August Pfluger (Republican) leading by 19 pts |
Republican over 99% | Republican | updated 10:19 AM ET (15:19 UTC, 9 Nov) as reported by AP (as published on the BBC's results page) |
| Texas's 12th district | 271,894 | 99% 99 of 100 units |
 Craig Goldman (Republican) leading by 6.2 pts |
Republican over 99% | Republican | updated 2:27 PM ET (19:27 UTC, 6 Nov) as reported by AP (as published on the BBC's results page) |
| Texas's 13th district | 242,521 | 99% 99 of 100 units |
 Ronny Jackson (Republican) leading by 30 pts |
Republican over 99% | Republican | updated 10:18 AM ET (15:18 UTC, 9 Nov) as reported by AP (as published on the BBC's results page) |
| Texas's 14th district | 282,553 | 99% 99 of 100 units |
 Randy Weber (Republican) leading by 8.0 pts |
Republican over 99% | Republican | updated 2:40 PM ET (19:40 UTC, 6 Nov) as reported by AP (as published on the BBC's results page) |
| Texas's 15th district | 202,509 | 99% 99 of 100 units |
 Bobby Pulido (Democrat) leading by 25 pts |
Democrat over 99% | Democrat | updated 10:19 AM ET (15:19 UTC, 9 Nov) as reported by AP (as published on the BBC's results page) |
| Texas's 16th district | 197,117 | 99% 99 of 100 units |
 Veronica Escobar (Democrat) leading by 42 pts |
Democrat over 99% | Democrat | updated 2:23 PM ET (19:23 UTC, 6 Nov) as reported by AP (as published on the BBC's results page) |
| Texas's 17th district | 268,003 | 99% 99 of 100 units |
 Pete Sessions (Republican) leading by 7.1 pts |
Republican over 99% | Republican | updated 2:42 PM ET (19:42 UTC, 6 Nov) as reported by AP (as published on the BBC's results page) |
| Texas's 18th district | 224,483 | 98% 98 of 100 units |
 Christian Menefee (Democrat) leading by 72 pts |
Democrat over 99% | Democrat | updated 10:19 AM ET (15:19 UTC, 9 Nov) as reported by AP (as published on the BBC's results page) |
| Texas's 19th district | 221,753 | 99% 99 of 100 units |
 Tom Sell (Republican) leading by 39 pts |
Republican over 99% | Republican | updated 10:19 AM ET (15:19 UTC, 9 Nov) as reported by AP (as published on the BBC's results page) |
| Texas's 20th district | 192,494 | 99% 99 of 100 units |
 Joaquin Castro (Democrat) leading by 55 pts |
Democrat over 99% | Democrat | updated 11:34 AM ET (16:34 UTC, 9 Nov) as reported by AP (as published on the BBC's results page) |
| Texas's 21st district | 356,513 | 99% 99 of 100 units |
 Mark Teixeira (Republican) leading by 9.1 pts |
Republican over 99% | Republican | updated 11:34 AM ET (16:34 UTC, 9 Nov) as reported by AP (as published on the BBC's results page) |
| Texas's 23rd district | 272,553 | 99% 99 of 100 units |
 Katy Padilla Stout (Democrat) leading by 8.2 pts |
Democrat over 99% | Democrat | updated 11:34 AM ET (16:34 UTC, 9 Nov) as reported by AP (as published on the BBC's results page) |
| Texas's 24th district | 321,448 | 99% 99 of 100 units |
 Beth Van Duyne (Republican) leading by 6.9 pts |
Republican over 99% | Republican | updated 10:18 AM ET (15:18 UTC, 9 Nov) as reported by AP (as published on the BBC's results page) |
| Texas's 25th district | 265,575 | 99% 99 of 100 units |
 Roger Williams (Republican) leading by 7.5 pts |
Republican over 99% | Republican | updated 2:42 PM ET (19:42 UTC, 6 Nov) as reported by AP (as published on the BBC's results page) |
| Texas's 26th district | 335,798 | 99% 99 of 100 units |
 Brandon Gill (Republican) leading by 10 pts |
Republican over 99% | Republican | updated 10:18 AM ET (15:18 UTC, 9 Nov) as reported by AP (as published on the BBC's results page) |
| Texas's 28th district | 172,312 | 99% 99 of 100 units |
 Henry Cuellar (Democrat) leading by 36 pts |
Democrat over 99% | Democrat | updated 10:19 AM ET (15:19 UTC, 9 Nov) as reported by AP (as published on the BBC's results page) |
| Texas's 29th district | 167,608 | 99% 99 of 100 units |
 Sylvia Garcia (Democrat) leading by 60 pts |
Democrat over 99% | Democrat | updated 10:19 AM ET (15:19 UTC, 9 Nov) as reported by AP (as published on the BBC's results page) |
| Texas's 30th district | 226,118 | 99% 99 of 100 units |
 Frederick Haynes (Democrat) leading by 65 pts |
Democrat over 99% | Democrat | updated 10:18 AM ET (15:18 UTC, 9 Nov) as reported by AP (as published on the BBC's results page) |
| Texas's 31st district | 304,973 | 99% 99 of 100 units |
 John Carter (Republican) leading by 8.9 pts |
Republican over 99% | Republican | updated 2:46 PM ET (19:46 UTC, 6 Nov) as reported by AP (as published on the BBC's results page) |
| Texas's 33rd district | 192,048 | 99% 99 of 100 units |
 Colin Allred (Democrat) leading by 57 pts |
Democrat over 99% | Democrat | updated 10:18 AM ET (15:18 UTC, 9 Nov) as reported by AP (as published on the BBC's results page) |
| Texas's 34th district | 202,645 | 99% 99 of 100 units |
 Vicente Gonzalez (Democrat) leading by 16 pts |
Democrat over 99% | Democrat | updated 2:43 PM ET (19:43 UTC, 6 Nov) as reported by AP (as published on the BBC's results page) |
| Texas's 35th district | 252,558 | 99% 99 of 100 units |
Johnny Garcia (Democrat) leading by 11 pts | Democrat over 99% | Democrat | updated 11:34 AM ET (16:34 UTC, 9 Nov) as reported by AP (as published on the BBC's results page) |
| Texas's 36th district | 257,689 | 99% 99 of 100 units |
 Brian Babin (Republican) leading by 7.1 pts |
Republican over 99% | Republican | updated 10:19 AM ET (15:19 UTC, 9 Nov) as reported by AP (as published on the BBC's results page) |
| Texas's 37th district | 304,426 | 99% 99 of 100 units |
 Greg Casar (Democrat) leading by 68 pts |
Democrat over 99% | Democrat | updated 10:19 AM ET (15:19 UTC, 9 Nov) as reported by AP (as published on the BBC's results page) |
| Texas's 38th district | 305,101 | 99% 99 of 100 units |
Jon Bonck (Republican) leading by 4.2 pts | Republican over 99% | Republican | updated 10:19 AM ET (15:19 UTC, 9 Nov) as reported by AP (as published on the BBC's results page) |
| Utah's 1st district | 249,058 | 96% 1 of 1 units |
 Ben Mcadams (Other) leading by 44 pts |
Democrat over 99% | Democrat | updated 11:53 AM ET (16:53 UTC, 9 Nov) |
| Utah's 2nd district | 253,386 | 97% 5 of 5 units |
 Blake D. Moore (Other) leading by 7.9 pts |
Republican over 99% | Republican | updated 11:53 AM ET (16:53 UTC, 9 Nov) |
| Utah's 3rd district | 252,425 | 96% 19 of 19 units |
 Celeste Maloy (Other) leading by 22 pts |
Republican over 99% | Republican | updated 11:53 AM ET (16:53 UTC, 9 Nov) |
| Utah's 4th district | 264,912 | 97% 7 of 7 units |
 Mike Kennedy (Other) leading by 15 pts |
Republican over 99% | Republican | updated 11:53 AM ET (16:53 UTC, 9 Nov) |
| Virginia's 2nd district | 337,779 | 98% 8 of 8 units |
 Elaine G. Luria (Democrat) leading by 8.5 pts |
Democrat over 99% | Democrat | updated 12:24 PM ET (17:24 UTC, 9 Nov) |
| Virginia's 3rd district | 248,677 | 98% 5 of 5 units |
 Robert C. Bobby Scott (Democrat) leading by 49 pts |
Democrat over 99% | Democrat | updated 12:24 PM ET (17:24 UTC, 9 Nov) |
| Virginia's 4th district | 310,007 | 98% 15 of 15 units |
 Jennifer L. McClellan (Democrat) leading by 46 pts |
Democrat over 99% | Democrat | updated 12:24 PM ET (17:24 UTC, 9 Nov) |
| Virginia's 6th district | 317,531 | 98% 23 of 23 units |
 Ben L. Cline (Republican) leading by 11 pts |
Republican over 99% | Republican | updated 12:24 PM ET (17:24 UTC, 9 Nov) |
| Virginia's 7th district | 322,758 | 99% 11 of 11 units |
 Eugene S. Vindman (Democrat) leading by 22 pts |
Democrat over 99% | Democrat | updated 12:24 PM ET (17:24 UTC, 9 Nov) |
| Virginia's 8th district | 319,399 | 98% 4 of 4 units |
 Donald S. Beyer, Jr. (Democrat) leading by 62 pts |
Democrat over 99% | Democrat | updated 12:24 PM ET (17:24 UTC, 9 Nov) |
| Virginia's 9th district | 294,914 | 99% 28 of 28 units |
 H. Morgan Griffith (Republican) leading by 32 pts |
Republican over 99% | Republican | updated 12:24 PM ET (17:24 UTC, 9 Nov) |
| Virginia's 10th district | 332,146 | 98% 7 of 7 units |
 Suhas Subramanyam (Democrat) leading by 25 pts |
Democrat over 99% | Democrat | updated 12:24 PM ET (17:24 UTC, 9 Nov) |
| Virginia's 11th district | 339,447 | 98% 2 of 2 units |
 James R. Walkinshaw (Democrat) leading by 50 pts |
Democrat over 99% | Democrat | updated 12:24 PM ET (17:24 UTC, 9 Nov) |
| Vermont's at-large district | 304,429 | 99% 283 of 283 units |
 Becca Balint (Democrat) leading by 34 pts |
Democrat over 99% | Democrat | file made 7:23 AM ET (12:23 UTC, 9 Nov) |
| Washington's 1st district | 281,694 | 95% 2 of 2 units |
 Suzan DelBene (Democrat) leading by 35 pts |
Democrat over 99% | Democrat | updated 8:04 PM ET (01:04 UTC, 7 Nov) |
| Washington's 2nd district | 327,295 | 92% 4 of 5 units |
 Rick Larsen (Democrat) leading by 34 pts |
Democrat over 99% | Democrat | updated 8:04 PM ET (01:04 UTC, 7 Nov) |
| Washington's 3rd district | 349,381 | 97% 7 of 7 units |
 Marie Gluesenkamp Perez (Democrat) leading by 8.1 pts |
Democrat over 99% | Democrat | updated 8:04 PM ET (01:04 UTC, 7 Nov) |
| Washington's 6th district | 316,708 | 86% 5 of 6 units |
 Emily Randall (Democrat) leading by 27 pts |
Democrat over 99% | Democrat | updated 8:04 PM ET (01:04 UTC, 7 Nov) |
| Washington's 7th district | 347,899 | 93% 1 of 1 units |
 Pramila Jayapal (Democrat) leading by 75 pts |
Democrat over 99% | Democrat | updated 8:04 PM ET (01:04 UTC, 7 Nov) |
| Washington's 8th district | 328,856 | 94% 6 of 6 units |
 Kim Schrier (Democrat) leading by 14 pts |
Democrat over 99% | Democrat | updated 8:04 PM ET (01:04 UTC, 7 Nov) |
| Washington's 9th district | 233,801 | 93% 1 of 1 units |
 Adam Smith (Democrat) leading by 52 pts |
Democrat over 99% | Democrat | updated 8:04 PM ET (01:04 UTC, 7 Nov) |
| Washington's 10th district | 260,449 | 93% 2 of 2 units |
 Marilyn Strickland (Democrat) leading by 28 pts |
Democrat over 99% | Democrat | updated 8:04 PM ET (01:04 UTC, 7 Nov) |
| Wisconsin's 3rd district | 329,464 | 99% 99 of 100 units |
 Rebecca Cooke (Democrat) leading by 6.6 pts |
Democrat over 99% | Democrat | updated 9:25 AM ET (14:25 UTC, 9 Nov) as reported by AP (as published on the BBC's results page) |
| Wisconsin's 4th district | 264,932 | 99% 99 of 100 units |
 Gwen Moore (Democrat) leading by 63 pts |
Democrat over 99% | Democrat | updated 9:25 AM ET (14:25 UTC, 9 Nov) as reported by AP (as published on the BBC's results page) |
| Wisconsin's 5th district | 374,269 | 99% 99 of 100 units |
 Scott Fitzgerald (Republican) leading by 18 pts |
Republican over 99% | Republican | updated 9:25 AM ET (14:25 UTC, 9 Nov) as reported by AP (as published on the BBC's results page) |
| Wisconsin's 6th district | 326,136 | 99% 99 of 100 units |
 Glenn Grothman (Republican) leading by 9.4 pts |
Republican over 99% | Republican | updated 9:25 AM ET (14:25 UTC, 9 Nov) as reported by AP (as published on the BBC's results page) |
| Wisconsin's 7th district | 339,994 | 99% 99 of 100 units |
 Michael Alfonso (Republican) leading by 13 pts |
Republican over 99% | Republican | updated 9:52 AM ET (14:52 UTC, 9 Nov) as reported by AP (as published on the BBC's results page) |
| Wisconsin's 8th district | 328,729 | 99% 99 of 100 units |
 Tony Wied (Republican) leading by 7.8 pts |
Republican over 99% | Republican | updated 9:25 AM ET (14:25 UTC, 9 Nov) as reported by AP (as published on the BBC's results page) |
| West Virginia's 1st district | 208,015 | 99% 99 of 100 units |
 Carol Miller (Republican) leading by 17 pts |
Republican over 99% | Republican | updated 12:22 PM ET (17:22 UTC, 9 Nov) as reported by AP (as published on the BBC's results page) |
| West Virginia's 2nd district | 241,996 | 99% 99 of 100 units |
 Riley Moore (Republican) leading by 19 pts |
Republican over 99% | Republican | updated 12:07 PM ET (17:07 UTC, 9 Nov) as reported by AP (as published on the BBC's results page) |
| Wyoming's at-large district | 183,200 | 97% 97 of 100 units |
 Chuck Gray (Republican) leading by 21 pts |
Republican over 99% | Republican | updated 3:16 AM ET (08:16 UTC, 8 Nov) as reported by AP (as published on the BBC's results page) |
| Arizona's 3rd district | 147,637 | – 99 of 100 units |
 Yassamin Ansari (Democrat) leading by 81 pts |
– | Democrat | updated 10:15 AM ET (15:15 UTC, 9 Nov) as reported by AP (as published on the BBC's results page) |
| California's 4th district | 149,811 | – 500 of 500 units |
Eric Jones (Democrat) leading by 5.1 pts | – | Democrat | updated 10:43 AM ET (15:43 UTC, 9 Nov) |
| California's 6th district | 184,378 | – 309 of 309 units |
 Richard Pan (Democrat) leading by 17 pts |
– | Democrat | updated 10:43 AM ET (15:43 UTC, 9 Nov) |
| California's 7th district | 175,659 | – 414 of 414 units |
 Doris Matsui (Democrat) leading by 11 pts |
– | Democrat | updated 10:43 AM ET (15:43 UTC, 9 Nov) |
| California's 11th district | 293,829 | – 453 of 453 units |
 Scott Wiener (Democrat) leading by 7.1 pts |
– | Democrat | updated 10:43 AM ET (15:43 UTC, 9 Nov) |
| California's 12th district | 196,652 | – 190 of 190 units |
 Lateefah Simon (Democrat) leading by 61 pts |
– | Democrat | updated 10:43 AM ET (15:43 UTC, 9 Nov) |
| California's 14th district | 159,728 | – 351 of 351 units |
 Aisha Wahab (Democrat) leading by 15 pts |
– | Democrat | updated 10:43 AM ET (15:43 UTC, 9 Nov) |
| California's 29th district | 171,678 | – 115 of 115 units |
 Luz Maria Rivas (Democrat) leading by 15 pts |
– | Democrat | updated 10:43 AM ET (15:43 UTC, 9 Nov) |
| California's 34th district | 170,293 | – 116 of 116 units |
 Angela Gonzales-Torres (Democrat) leading by 24 pts |
– | Democrat | updated 10:43 AM ET (15:43 UTC, 9 Nov) |
| California's 37th district | 178,986 | – 140 of 140 units |
 Sydney Kamlager-Dove (Democrat) leading by 22 pts |
– | Democrat | updated 10:43 AM ET (15:43 UTC, 9 Nov) |
| California's 40th district | 174,655 | – 558 of 558 units |
 Ken Calvert (Republican) leading by 7.6 pts |
– | Republican | updated 10:43 AM ET (15:43 UTC, 9 Nov) |
| Massachusetts's 1st district | 270,974 | – 99 of 100 units |
 Richard Neal (Democrat) leading by 31 pts |
– | Democrat | updated 10:22 AM ET (15:22 UTC, 9 Nov) as reported by AP (as published on the BBC's results page) |
| Massachusetts's 2nd district | 198,782 | – 63 of 100 units |
 James McGovern (Democrat) leading by 100 pts |
– | Democrat | updated 10:22 AM ET (15:22 UTC, 9 Nov) as reported by AP (as published on the BBC's results page) |
| Massachusetts's 5th district | 206,925 | – 89 of 100 units |
 Katherine Clark (Democrat) leading by 100 pts |
– | Democrat | updated 10:14 AM ET (15:14 UTC, 9 Nov) as reported by AP (as published on the BBC's results page) |
| Massachusetts's 7th district | 158,384 | – 62 of 100 units |
 Ayanna Pressley (Democrat) leading by 100 pts |
– | Democrat | updated 10:10 AM ET (15:10 UTC, 9 Nov) as reported by AP (as published on the BBC's results page) |
| New Jersey's 8th district | 123,250 | – 95 of 100 units |
 Rob Menendez (Democrat) leading by 84 pts |
– | Democrat | updated 5:33 PM ET (22:33 UTC, 6 Nov) as reported by AP (as published on the BBC's results page) |
| Pennsylvania's 3rd district | 271,872 | – 99 of 100 units |
 Chris Rabb (Democrat) leading by 87 pts |
– | Democrat | updated 12:07 PM ET (17:07 UTC, 9 Nov) as reported by AP (as published on the BBC's results page) |
| Wisconsin's 2nd district | 317,125 | – 99 of 100 units |
 Mark Pocan (Democrat) leading by 100 pts |
– | Democrat | updated 9:25 AM ET (14:25 UTC, 9 Nov) as reported by AP (as published on the BBC's results page) |
Statewide ballot measures 65
| State | Measure (as the feed names it) | Yes | No | Feed time |
|---|---|---|---|---|
| Arkansas | ISSUE NO. 1 | 0.0% | 30.9% | updated 11:43 AM ET (16:43 UTC, 9 Nov) |
| Arkansas | ISSUE NO. 2 | 0.0% | 29.2% | updated 11:43 AM ET (16:43 UTC, 9 Nov) |
| Arkansas | ISSUE NO. 3 | 0.0% | 50.7% | updated 11:43 AM ET (16:43 UTC, 9 Nov) |
| Arkansas | ISSUE NO. 4 | 0.0% | 43.6% | updated 11:43 AM ET (16:43 UTC, 9 Nov) |
| Colorado | Amendment 81 (CONSTITUTIONAL) | 44.7% | 55.3% | updated 8:11 PM ET (01:11 UTC, 7 Nov) |
| Colorado | Amendment 82 (CONSTITUTIONAL) | 46.3% | 53.7% | updated 8:11 PM ET (01:11 UTC, 7 Nov) |
| Colorado | Amendment 83 (CONSTITUTIONAL) | 45.1% | 54.9% | updated 8:11 PM ET (01:11 UTC, 7 Nov) |
| Colorado | Amendment 84 (CONSTITUTIONAL) | 36.6% | 63.4% | updated 8:11 PM ET (01:11 UTC, 7 Nov) |
| Colorado | Amendment 85 (CONSTITUTIONAL) | 51.1% | 48.9% | updated 8:11 PM ET (01:11 UTC, 7 Nov) |
| Colorado | Amendment 86 (CONSTITUTIONAL) | 46.9% | 53.1% | updated 8:11 PM ET (01:11 UTC, 7 Nov) |
| Colorado | Amendment 87 (CONSTITUTIONAL) | 51.6% | 48.4% | updated 8:11 PM ET (01:11 UTC, 7 Nov) |
| Colorado | Proposition 132 (STATUTORY) | 52.6% | 47.4% | updated 8:11 PM ET (01:11 UTC, 7 Nov) |
| Colorado | Proposition 133 (STATUTORY) | 62.1% | 37.9% | updated 8:11 PM ET (01:11 UTC, 7 Nov) |
| Colorado | Proposition 134 (STATUTORY) | 52.2% | 47.8% | updated 8:11 PM ET (01:11 UTC, 7 Nov) |
| Colorado | Proposition 135 (STATUTORY) | 51.9% | 48.1% | updated 8:11 PM ET (01:11 UTC, 7 Nov) |
| Colorado | Proposition 136 (STATUTORY) | 47.2% | 52.8% | updated 8:11 PM ET (01:11 UTC, 7 Nov) |
| Colorado | Proposition 137 (STATUTORY) | 51.9% | 48.1% | updated 8:11 PM ET (01:11 UTC, 7 Nov) |
| Colorado | Proposition NN (STATUTORY) | 56.9% | 43.1% | updated 8:11 PM ET (01:11 UTC, 7 Nov) |
| Georgia | Proposed Constitutional Amendment 1 | 53.8% | 46.2% | updated 8:50 AM ET (13:50 UTC, 9 Nov) |
| Georgia | Proposed Constitutional Amendment 2 | 68.4% | 31.6% | updated 8:50 AM ET (13:50 UTC, 9 Nov) |
| Georgia | Proposed Constitutional Amendment 3 | 77.7% | 22.3% | updated 8:50 AM ET (13:50 UTC, 9 Nov) |
| Iowa | Constitutional Amendment 1 | 56.3% | 43.7% | updated 1:25 PM ET (18:25 UTC, 4 Nov) |
| Idaho | Advisory Question: House Bill 932 | 0.0% | 0.0% | updated 12:11 PM ET (17:11 UTC, 9 Nov) |
| Idaho | Idaho Constitutional Amendment: House Joint Resolution 4 | 33.7% | 66.3% | updated 12:11 PM ET (17:11 UTC, 9 Nov) |
| Idaho | Idaho Constitutional Amendment: House Joint Resolution 6 | 63.2% | 36.8% | updated 12:11 PM ET (17:11 UTC, 9 Nov) |
| Idaho | Proposition 1: Reproductive Freedom & Privacy Act | 44.1% | 55.9% | updated 12:11 PM ET (17:11 UTC, 9 Nov) |
| North Carolina | CONSTITUTIONAL AMENDMENT - MAXIMUM INCOME TAX RATE OF 3.5% | 61.9% | 38.1% | updated 12:10 PM ET (17:10 UTC, 9 Nov) |
| North Carolina | CONSTITUTIONAL AMENDMENT - PROPERTY TAX LEVY LIMIT | 60.4% | 39.6% | updated 12:10 PM ET (17:10 UTC, 9 Nov) |
| North Carolina | CONSTITUTIONAL AMENDMENT - REQUIRE PHOTO ID FOR VOTING | 59.6% | 40.4% | updated 12:10 PM ET (17:10 UTC, 9 Nov) |
| North Dakota | Related to constitutional amendments | 43.6% | 56.4% | file made 11:55 AM ET (16:55 UTC, 4 Nov) |
| North Dakota | Related to prohibiting all political subdivisions from levying any tax on real property except for bonded indebtedness until paid | 36.5% | 63.5% | file made 11:55 AM ET (16:55 UTC, 4 Nov) |
| New Mexico | Bond Question 1: The 2026 Capital Projects General Obligation Bond Act authorizes the issuance and sale of senior citizen facility improvement, construction and equipment acquisition bonds. Shall the state be authorized to issue general obligation bonds in an amount not to exceed twenty-one million | 69.6% | 30.4% | fetched (the feed gives no time) 12:27 PM ET (17:27 UTC, 9 Nov) |
| New Mexico | City of Las Cruces General Obligation Library Bond: Shall the City of Las Cruces be authorized to issue general obligation bonds, payable from property taxes, in an amount up to $26,000, 000 to acquire, plan, design, develop, construct, improve, renovate, modernize, automate, furnish, and equip the | 68.9% | 31.1% | fetched (the feed gives no time) 12:27 PM ET (17:27 UTC, 9 Nov) |
| New Mexico | CITY OF RUIDOSO DOWNS GENERAL OBLIGATION BOND : Shall the City of Ruidoso Downs issue up to $2,500,000 in general obligation bonds payable from general (ad valorem) taxes to design, acquire, construct, renovate, expand, furnish, eqmp, enhance, and otherwise improve public infrastructure and building | – | – | fetched (the feed gives no time) 12:27 PM ET (17:27 UTC, 9 Nov) |
| New Mexico | COUNTY BOND QUESTION 2: Shall Valencia County issue up to $4,000,000 of its general obligation bonds, to be repaid from property taxes, to construct, rehabilitate, enhance and otherwise improve public roads, including purchasing capital equipment for such projects? - Valencia - Valencia | 64.7% | 35.3% | fetched (the feed gives no time) 12:27 PM ET (17:27 UTC, 9 Nov) |
| New Mexico | COUNTY BOND QUESTION 3: Shall Valencia County issue up to $2,000,000 of its general obligation bonds, to be repaid from property taxes, to construct, equip, renovate, enhance and otherwise improve and to acquire equipment for park and recreational facilities including public parks, splash pads, spor | 61.2% | 38.8% | fetched (the feed gives no time) 12:27 PM ET (17:27 UTC, 9 Nov) |
| New Mexico | COUNTY BOND QUESTION 4: Shall Valencia County issue up to $2,000,000 of its general obligation bonds, to be repaid from property taxes, to construct, equip, renovate, enhance and otherwise improve County owned community centers, including those for families, youth and senior citizens? - Valencia - V | 61.8% | 38.2% | fetched (the feed gives no time) 12:27 PM ET (17:27 UTC, 9 Nov) |
| New Mexico | COUNTY QUESTION AMENDMENT TO THE CHARTER OF THE INCORPORATED COUNTY (COUNTY) OF LOS ALAMOS, PURSUANT TO COUNTY ORDINANCE NO. 758, TO AMEND THE PRIORITY OF THE DEPARTMENT OF PUBLIC UTILITIES (DPU) BUDGETED EXPENDITURES QUESTION NO. 3: Shall Article V, Section 509, of the Charter of the Incorporated | 52.9% | 47.1% | fetched (the feed gives no time) 12:27 PM ET (17:27 UTC, 9 Nov) |
| New Mexico | County Tax Authorization Question: Shall the County of Chaves impose a countywide one-eighth of one percent (0.125%, or 12.5 cents per $100 of taxable gross receipts) Local Economic Development Act local option gross receipts tax, with the revenue being dedicated to furthering or implementing econom | 31.7% | 68.3% | fetched (the feed gives no time) 12:27 PM ET (17:27 UTC, 9 Nov) |
| New Mexico | GENERAL OBLIGATION BOND QUESTION 1: Shall Santa Fe County issue up to $14,035,000 in general obligation bonds payable from general (ad valorem) taxes to acquire, construct, design, equip, and improve roads within the County? - Santa Fe - Santa Fe | 84.7% | 15.3% | fetched (the feed gives no time) 12:27 PM ET (17:27 UTC, 9 Nov) |
| New Mexico | GENERAL OBLIGATION BOND QUESTION 2: Shall Santa Fe County issue up to $6,500,000 in general obligation bonds payable from general (ad valorem) taxes to acquire real property and necessary water rights for, and to construct, design, equip, rehabilitate, and improve water and wastewater projects withi | 83.9% | 16.1% | fetched (the feed gives no time) 12:27 PM ET (17:27 UTC, 9 Nov) |
| New Mexico | GENERAL OBLIGATION BOND QUESTION 3: Shall Santa Fe County issue up to $7,010,000 in general obligation bonds payable from general (ad valorem) taxes to acquire, design, construct, improve, equip, and restore open space, trails, and parks within the County? - Santa Fe - Santa Fe | 80.6% | 19.4% | fetched (the feed gives no time) 12:27 PM ET (17:27 UTC, 9 Nov) |
| New Mexico | GENERAL OBLIGATION BOND QUESTION 4: Shall Santa Fe County issue up to $17,455,000 in general obligation bonds payable from general (ad valorem) taxes to acquire real property for, and to construct, design, equip, rehabilitate, and improve fire stations within the County? - Santa Fe - Santa Fe | 82.7% | 17.3% | fetched (the feed gives no time) 12:27 PM ET (17:27 UTC, 9 Nov) |
| New Mexico | GENERAL OBLIGATION FLOOD CONTROL BONDS: Shall the Albuquerque Metropolitan Arroyo Flood Control Authority be authorized to issue its general obligation bonds in principal amount- not exceeding $30,000 000 for the extension betterment, alteration, reconstruction, repair and other improvements of the | 79.4% | 20.6% | fetched (the feed gives no time) 12:27 PM ET (17:27 UTC, 9 Nov) |
| New Mexico | GENERAL OBLIGATION MIDTOWN CAPITAL IMPROVEMENT BONDS: Shall the City of Santa Fe issue up to $5,000,000 in general obligation bonds, to be repaid from property taxes, to plan, design, prepare, demolish, construct, reconstruct, renovate, equip, furnish, manage, and improve public facilities, infrastr | 73.7% | 26.3% | fetched (the feed gives no time) 12:27 PM ET (17:27 UTC, 9 Nov) |
| New Mexico | GENERAL OBLIGATION MUNICIPAL RECREATION COMPLEX SOCCER VALLEY BONDS : Shall the City of Santa Fe issue up to $4,500,000 in general obligation bonds, to be repaid from property taxes, to plan, design, construct, equip, furnish, improve, and expand athletic fields and related public recreational facil | 69.0% | 31.0% | fetched (the feed gives no time) 12:27 PM ET (17:27 UTC, 9 Nov) |
| New Mexico | GENERAL OBLIGATION STREET, SIDEWALK, AND PEDESTRIAN ACCESSIBILITY BONDS: Shall the City of Santa Fe issue up to $11,250,000 in general obligation bonds, to be repaid from property taxes, to plan, design, construct, equip, reconstruct, rehabilitate, preserve, repair, replace, and improve streets, sid | 85.2% | 14.8% | fetched (the feed gives no time) 12:27 PM ET (17:27 UTC, 9 Nov) |
| New Mexico | GENERAL OBLIGATION SWAN PARK IMPROVEMENT BONDS : Shall the City of Santa Fe issue up to $4,250,000 in general obligation bonds, to be repaid from property taxes, to plan, design, construct, equip, furnish, and improve a splash pad and related public recreational facilities and infrastructure at SWAN | 68.6% | 31.4% | fetched (the feed gives no time) 12:27 PM ET (17:27 UTC, 9 Nov) |
| New Mexico | Local Economic Development Act GRT Question: Shall the County of Otero impose a countywide one-eighth of one percent (0.125%, or 12.5 cents per $100 of taxable gross receipts) Local Economic Development Act local option gross receipts tax, with the revenue being dedicated to furthering or implementi | 37.1% | 62.9% | fetched (the feed gives no time) 12:27 PM ET (17:27 UTC, 9 Nov) |
| New Mexico | MILL LEVY QUESTION: For the purpose of providing continued operating revenues for medical services including trauma care and behavioral health services including substance abuse treatment, shall Sandoval County, New Mexico continue to impose a mill levy of one and ninety hundredths (1.90) mills each | 72.9% | 27.1% | fetched (the feed gives no time) 12:27 PM ET (17:27 UTC, 9 Nov) |
| New Mexico | SAN JUAN COLLEGE GENERAL OBLIGATION BOND QUESTION: Shall San Juan College District, issue general obligation bonds of the College District, in one series or more, in the aggregate principal amount not to exceed $7,500,000, for the purpose of any, all or a combination of: erecting, furnishing, constr | 64.0% | 36.0% | fetched (the feed gives no time) 12:27 PM ET (17:27 UTC, 9 Nov) |
| New Mexico | Village of Angel Fire Economic Development Tax Question: Shall the Village of Angel Fire impose an Economic Development Tax at a rate of 0.25% to fund incentives, provide public support for projects, and improve the community's economic well-being and overall quality of life? ANGEL FIRE MUNICIPALITY | 51.9% | 48.1% | fetched (the feed gives no time) 12:27 PM ET (17:27 UTC, 9 Nov) |
| Utah | Constitutional Amendment A | 61.2% | 38.8% | updated 11:53 AM ET (16:53 UTC, 9 Nov) |
| Utah | Constitutional Amendment B | 38.7% | 61.3% | updated 11:53 AM ET (16:53 UTC, 9 Nov) |
| Virginia | Proposed Constitutional Amendment Question 1 | 62.6% | 37.4% | updated 12:24 PM ET (17:24 UTC, 9 Nov) |
| Virginia | Proposed Constitutional Amendment Question 2 | 57.6% | 42.4% | updated 12:24 PM ET (17:24 UTC, 9 Nov) |
| Virginia | Proposed Constitutional Amendment Question 3 | 56.7% | 43.3% | updated 12:24 PM ET (17:24 UTC, 9 Nov) |
| Washington | City of Bothell - Proposition No. 1 | 82.9% | 17.1% | updated 8:04 PM ET (01:04 UTC, 7 Nov) |
| Washington | City of Milton - Proposition No. 1 | 58.8% | 41.2% | updated 8:04 PM ET (01:04 UTC, 7 Nov) |
| Washington | Fire Protection District No. 1 - Proposition 1 | 0.0% | 0.0% | updated 8:04 PM ET (01:04 UTC, 7 Nov) |
| Washington | Initiative Measure No. IL26-001 | 47.5% | 52.5% | updated 8:04 PM ET (01:04 UTC, 7 Nov) |
| Washington | Initiative Measure No. IL26-638 | 56.0% | 44.0% | updated 8:04 PM ET (01:04 UTC, 7 Nov) |
| Washington | Initiative Measure No. IP26-645 | 42.0% | 58.0% | updated 8:04 PM ET (01:04 UTC, 7 Nov) |
| Washington | Prescott Joint Park and Recreation District - Proposition No. 1 | 0.0% | 0.0% | updated 8:04 PM ET (01:04 UTC, 7 Nov) |
| Washington | Public Hospital District No. 1 - Public Hospital District No. 1, Proposition 1 | 0.0% | 0.0% | updated 8:04 PM ET (01:04 UTC, 7 Nov) |
"Of expected vote": votes counted as a share of the votes we expect in the race, from each county's 2022 turnout (or its 2024 presidential turnout scaled to a midterm); House districts take their state's expected vote divided equally, so treat theirs as rough. "Units": the precincts or counties the state says have reported. Feed time is the race's own time in the state's feed; where a feed gives none we say when we fetched it.
Photo credits
346 official portraits from the Biographical Directory of the United States Congress (US government work, public domain): Aaron Bean, Abraham Hamadeh, Adam Gray, Adam Smith, Adelita Grijalva, Adrian Smith, Aisha Wahab, Alexandria Ocasio-Cortez, Alma Adams, Ami Bera, Analilia Mejia, André Carson, Andrea Salinas, Andrew Clyde, Andrew Garbarino, Andy Barr, Andy Harris, Anna Paulina Luna, April McClain Delaney, Ashley Moody, August Pfluger, Austin Scott, Ayanna Pressley, Barry Moore, Becca Balint, Ben Cline, Ben Ray Luján, Bennie Thompson, Beth Van Duyne, Betty McCollum, Bill Foster, Bill Hagerty, Bill Keating, Blake Moore, Bob Latta, Bob Onder, Bobby Scott, Brad Schneider, Brad Sherman, Brandon Gill, Brendan Boyle, Brett Guthrie, Brian Babin, Brian Jack, Brian Mast, Brittany Pettersen, Bruce Westerman, Carlos Giménez, Carol Miller, Celeste Maloy, Chellie Pingree, Chris Coons, Chris Deluzio, Chris Pappas, Chris Smith, Chrissy Houlahan, Christian Menefee, Chuck Fleischmann, Claudia Tenney, Clay Fuller, Clay Higgins, Cliff Bentz, Cory Booker, Craig Goldman, Dale Strong, Dan Meuser, Darin LaHood, Darren Soto, Dave Min, David Joyce, David Kustoff, David Rouzer, David Taylor, Debbie Dingell, Debbie Wasserman Schultz, Deborah Ross, Delia Ramirez, Derek Schmidt, Derek Tran, Diana Harshbarger, Dina Titus, Don Beyer, Don Davis, Donald Norcross, Doris Matsui, Ed Case, Ed Markey, Eli Crane, Emanuel Cleaver, Emilia Sykes, Emily Randall, Eric Burlison, Eric Sorensen, Erin Houchin, Eugene Vindman, Frank Lucas, Frank Mrvan, Frank Pallone, French Hill, Gabe Amo, Gabe Vasquez, Gary Palmer, George Latimer, George Whitesides, Gil Cisneros, Glenn Grothman, Glenn Ivey, Glenn Thompson, Grace Meng, Greg Casar, Greg Landsman, Greg Murphy, Greg Stanton, Greg Steube, Gregory Meeks, Gus Bilirakis, Guy Reschenthaler, Gwen Moore, Hakeem Jeffries, Hal Rogers, Hank Johnson, Harriet Hageman, Henry Cuellar, Herb Conaway, Hillary Scholten, Ilhan Omar, Jack Bergman, Jack Reed, Jahana Hayes, Jake Auchincloss, Jake Ellzey, James Comer, James Walkinshaw, Jamie Raskin, Janelle Bynum, Jared Huffman, Jared Moskowitz, Jason Crow, Jason Smith, Jay Obernolte, Jeff Hurd, Jeff Merkley, Jefferson Shreve, Jennifer McClellan, Jill Tokuda, Jim Baird, Jim Clyburn, Jim Costa, Jim Himes, Jim Jordan, Jim McGovern, Jim Risch, Jimmy Panetta, Jimmy Patronis, Joaquin Castro, Joe Courtney, Joe Neguse, Joe Wilson, John Carter, John Garamendi, John Hickenlooper, John Joyce, John Mannion, John McGuire, John Moolenaar, John Rutherford, Johnny Olszewski, Jon Ossoff, Jonathan Jackson, Joseph Morelle, Josh Brecheen, Josh Gottheimer, Josh Harder, Josh Riley, Joyce Beatty, Juan Vargas, Judy Chu, Julia Letlow, Julie Fedorchak, Kat Cammack, Katherine Clark, Kathy Castor, Keith Self, Kelly Ayotte, Kelly Morrison, Ken Calvert, Kevin Hern, Kevin Mullin, Kim Schrier, Kristen McDonald Rivet, Kweisi Mfume, LaMonica McIver, Lance Gooden, Lateefah Simon, Laura Friedman, Laura Gillen, Laurel Lee, Lauren Underwood, Lisa McClain, Lizzie Fletcher, Lloyd Smucker, Lois Frankel, Lori Trahan, Lou Correa, Lucy McBath, Luz Rivas, Madeleine Dean, Maggie Goodlander, Marcy Kaptur, María Elvira Salazar, Marie Gluesenkamp Perez, Marilyn Strickland, Mario Díaz-Balart, Mark Alford, Mark DeSaulnier, Mark Harris, Mark Messmer, Mark Pocan, Mark Takano, Mark Warner, Marlin Stutzman, Mary Gay Scanlon, Mary Miller, Matt Van Epps, Maxine Dexter, Maxine Waters, Melanie Stansbury, Michael Baumgartner, Michael Cloud, Michael Guest, Michael Rulli, Michelle Fischbach, Mike Bost, Mike Ezell, Mike Flood, Mike Haridopolos, Mike Johnson, Mike Kelly, Mike Kennedy, Mike Levin, Mike Quigley, Mike Rogers, Mike Rounds, Mike Simpson, Morgan Griffith, Morgan McGarvey, Nanette Barragán, Nathaniel Moran, Nellie Pou, Nick Begich III, Nick LaLota, Nick Langworthy, Nicole Malliotakis, Nikema Williams, Nikki Budzinski, Norma Torres, Pat Fallon, Pat Harrigan, Pat Ryan, Patty Garcia, Paul Gosar, Paul Tonko, Pete Aguilar, Pete Ricketts, Pete Sessions, Pete Stauber, Pramila Jayapal, Randy Fine, Randy Weber, Rashida Tlaib, Raul Ruiz, Rich McCormick, Richard Neal, Rick Allen, Rick Crawford, Rick Larsen, Riley Moore, Ritchie Torres, Ro Khanna, Rob Menendez, Robert Aderholt, Robert Garcia, Roger Williams, Ron Estes, Ronny Jackson, Rosa DeLauro, Rudy Yakym, Russ Fulcher, Russell Fry, Salud Carbajal, Sam Liccardo, Sanford Bishop, Sara Jacobs, Sarah Elfreth, Sarah McBride, Scott Fitzgerald, Scott Franklin, Scott Peters, Sean Casten, Seth Magaziner, Sharice Davids, Shelley Moore Capito, Sheri Biggs, Shomari Figures, Shontel Brown, Stephanie Bice, Stephen Lynch, Steve Scalise, Steve Womack, Steven Horsford, Suhas Subramanyam, Summer Lee, Susie Lee, Suzan DelBene, Suzanne Bonamici, Sydney Kamlager-Dove, Sylvia Garcia, Ted Lieu, Teresa Leger Fernández, Terri Sewell, Tim Burchett, Tim Kennedy, Tim Walberg, Tom Cole, Tom Cotton, Tom Emmer, Tom McClintock, Tom Suozzi, Tony Wied, Tracey Mann, Trent Kelly, Trever Nehls, Troy Balderson, Troy Carter, Troy Downing, Val Hoyle, Valerie Foushee, Veronica Escobar, Vicente Gonzalez, Vince Fong, Warren Davidson, Wesley Bell, William Timmons, Yassamin Ansari, Yvette Clarke, Zoe Lofgren.
- Abdul El-Sayed: Photo: Conlan Houston, CC BY-SA 4.0, via Wikimedia Commons (https://commons.wikimedia.org/wiki/File:Abdul_El-Sayed_meet-and-greet_by_Conlan_Houston_5_(cropped).jpg)
- Adam Hamawy: Photo: Office of Congresswoman Bonnie Watson Coleman, Public domain, via Wikimedia Commons (https://commons.wikimedia.org/wiki/File:Adam_Hamawy_in_2025.jpg)
- Adam Hamilton: Photo: Adam Hamilton for Kansas
- Adrian Boafo: Photo: Maryland GovPics, CC BY 2.0, via Wikimedia Commons (https://commons.wikimedia.org/wiki/File:Adrian_Boafo_Feb2023.jpg)
- Alan Wilson: Photo: U.S. House of Representatives, Public domain, via Wikimedia Commons (https://commons.wikimedia.org/wiki/File:Alan_Wilson_in_August_2025.jpg)
- Amanda McKinney: Photo: Gage Skidmore from Surprise, AZ, United States of America, CC BY-SA 4.0, via Wikimedia Commons (https://commons.wikimedia.org/wiki/File:Amanda_McKinney_(55022651563).jpg)
- Amish Shah: Photo: Gage Skidmore, CC BY-SA 3.0, via Wikimedia Commons (https://commons.wikimedia.org/wiki/File:Amish_Shah_by_Gage_Skidmore_2.jpg)
- Amy Acton: Photo: Patricio101, CC0, via Wikimedia Commons (https://commons.wikimedia.org/wiki/File:Amy_Acton_2025.jpg)
- Amy Klobuchar: Photo: United States Senate, Public domain, via Wikimedia Commons (https://commons.wikimedia.org/wiki/File:Amy_Klobuchar,_official_portrait,_113th_Congress.jpg)
- Angela Gonzales-Torres: Photo: Angela Gonzales-Torres for Congress
- Annie Andrews: Photo: Stimpus1, CC0, via Wikimedia Commons (https://commons.wikimedia.org/wiki/File:Annie_Andrews_Greenville_(cropped).jpg)
- Ben McAdams: Photo: United States Congress, Public domain, via Wikimedia Commons (https://commons.wikimedia.org/wiki/File:Ben_McAdams,_official_portrait,_116th_Congress.jpg)
- Bob Brooks: Photo: Bob Brooks for Congress
- Bob Harvie: Photo: Governor Tom Wolf from Harrisburg, PA, CC BY 2.0, via Wikimedia Commons (https://commons.wikimedia.org/wiki/File:Gov._Wolf_and_Bucks_County_Officials_Celebrate_$7_Million_in_COVID_Relief_Funding_to_Bucks_County_Restaurants_(51316796294).jpg)
- Bobby Pulido: Photo: Kim Alaniz, CC BY 2.0, via Wikimedia Commons (https://commons.wikimedia.org/wiki/File:Bobby_Pulido,_Houston,_Texas.jpg)
- Brad Lander: Photo: Tessa Bury, CC BY 4.0, via Wikimedia Commons (https://commons.wikimedia.org/wiki/File:Brad_Lander.jpg)
- Brad Little: Photo: Phil White/Office of the Governor of Idaho., CC BY-SA 4.0, via Wikimedia Commons (https://commons.wikimedia.org/wiki/File:Brad_Little_official_photo.jpg)
- Brent Taylor: Photo: GatewayPolitics, CC BY-SA 4.0, via Wikimedia Commons (https://commons.wikimedia.org/wiki/File:Brent_Taylor_(Tennessee_politician).jpg)
- Brian Poindexter: Photo: Poindexter for Congress
- Byron Donalds: Photo: United States Congress, Public domain, via Wikimedia Commons (https://commons.wikimedia.org/wiki/File:Rep._Byron_Donalds_official_photo,_117th_Congress.jpg)
- Cait Conley: Photo: DHSgov, Public domain, via Wikimedia Commons (https://commons.wikimedia.org/wiki/File:DHS_Secretary_Alejandro_Mayorkas_Gives_Opening_Remarks_During_CISA_National_Election_Exercise_in_Arlington,_Virginia_on_22_August_2024_-_6_Cait_Conley_(cropped).jpg)
- Charlie Hatcher: Photo: Charlie Hatcher for Congress
- Chris McGowan: Photo: McGowan for Iowa
- Chris Rabb: Photo: Yolanda Cheers, CC0, via Wikimedia Commons (https://commons.wikimedia.org/wiki/File:Rep._Chris_Rabb_speaks_at_a_fundraiser.jpg)
- Chris Stigall: Photo: Jared Hart, CC BY-SA 4.0, via Wikimedia Commons (https://commons.wikimedia.org/wiki/File:Chris_Stigall_2017_(cropped).jpg)
- Christina Bohannan: Photo: Iowa General Assembly, Free use (Iowa General Assembly), via Wikimedia Commons (https://commons.wikimedia.org/wiki/File:ChristinaBohannan.jpg)
- Christina Hines: Photo: Christina Hines for Congress
- Chuck Gray: Photo: Gage Skidmore, CC BY-SA 2.0, via Wikimedia Commons (https://commons.wikimedia.org/wiki/File:Chuck_Gray_in_2025_(cropped).jpg)
- Chuck Hubbard: Photo: Chuck Hubbard for Congress
- Cindy Holscher: Photo: Mtcat101, CC BY 4.0, via Wikimedia Commons (https://commons.wikimedia.org/wiki/File:Cindy_Holscher_2026_in_Manhattan_(cropped).jpg)
- Claire Valdez: Photo: Metropolitan Transportation Authority, CC BY 4.0, via Wikimedia Commons (https://commons.wikimedia.org/wiki/File:Queens_Bus_Network_Redesign_Claire_Valdez_(cropped).jpg)
- Colin Allred: Photo: Ike Hayman, Public domain, via Wikimedia Commons (https://commons.wikimedia.org/wiki/File:Colin_Allred,_official_portrait,_117th_Congress.jpg)
- Cyril Jefferson: Photo: City of High Point
- Dan Koh: Photo: Executive Office of the President of the United States, Public domain, via Wikimedia Commons (https://commons.wikimedia.org/wiki/File:Daniel_Koh,_White_House_Deputy_Cabinet_Secretary.jpg)
- Daniel Biss: Photo: Paul Goyette, CC BY 4.0, via Wikimedia Commons (https://commons.wikimedia.org/wiki/File:Biss_2026.jpg)
- Darializa Avila Chevalier: Photo: A LO CLARO and Indhira Baez, CC BY 4.0, via Wikimedia Commons (https://commons.wikimedia.org/wiki/File:Darializa_Avila_Chevalier_during_interview_on_Secretos_CEO.jpg)
- David Crowley: Photo: LaShawnda Jones, CC BY-SA 4.0, via Wikimedia Commons (https://commons.wikimedia.org/wiki/File:David_Crowley,_Milwaukee_County_Executive_and_WI_gubernatorial_candidate,_February_26,_2026.jpg)
- Deb Haaland: Photo: Department of the Interior, Public domain, via Wikimedia Commons (https://commons.wikimedia.org/wiki/File:Secretary_Deb_Haaland,_official_headshot.jpg)
- Denise Powell: Photo: Denise Powell for Congress
- Don Leonard: Photo: Don Leonard for Congress
- Donavan McKinney: Photo: City of Detroit, Public domain, via Wikimedia Commons (https://commons.wikimedia.org/wiki/File:State_Rep_Donavan_McKinney_Swearing_In_12.12.22_(52565631658)_(cropped).jpg)
- Donna Miller: Photo: Paul Goyette, CC BY 2.0, via Wikimedia Commons (https://commons.wikimedia.org/wiki/File:Cook_County_Commissioner_Donna_Miller_at_May_Day_2025.jpg)
- Ed Gallrein: Photo: Gage Skidmore, CC BY-SA 4.0, via Wikimedia Commons (https://commons.wikimedia.org/wiki/File:Ed_Gallrein_(55505179851)_(cropped).jpg)
- Eileen Laubacher: Photo: U.S. Navy, Public domain, via Wikimedia Commons (https://commons.wikimedia.org/wiki/File:Eileen_H._Laubacher_(3).jpg)
- Elaine Luria: Photo: U.S. House of Representatives, Public domain, via Wikimedia Commons (https://commons.wikimedia.org/wiki/File:Rep._Elaine_Luria_official_photo,_117th_Congress.jpg)
- Eric Barlow: Photo: Barlow for Wyoming Governor
- Fred Wellman: Photo: Fred Wellman for Congress
- Frederick Haynes III: Photo: Calvary Baptist Church Jamaica, NY, CC BY 3.0, via Wikimedia Commons (https://commons.wikimedia.org/wiki/File:Frederick_Haynes_III_at_Calvary_Baptist_Church.png)
- Gina Hinojosa: Photo: RRC1701, CC0, via Wikimedia Commons (https://commons.wikimedia.org/wiki/File:Gina_Hinojosa_at_the_AFL-CIO_COPE_convention_in_2024.jpg)
- Hannah Pingree: Photo: Hannah Pingree for Governor, CC BY 4.0, via Wikimedia Commons (https://commons.wikimedia.org/wiki/File:Headshot_of_Hannah_Pingree_in_February_2026.jpg)
- Helena Foulkes: Photo: Digitas Photos, CC BY 2.0, via Wikimedia Commons (https://commons.wikimedia.org/wiki/File:HelenaFoulkes_CROP.jpg)
- Hilda Solis: Photo: Los Angeles County Board of Supervisors, Public domain, via Wikimedia Commons (https://commons.wikimedia.org/wiki/File:Hilda_Solis,_2025.jpg)
- Houston Gaines: Photo: Georgia House of Representatives, Public domain, via Wikimedia Commons (https://commons.wikimedia.org/wiki/File:Official_headshot_of_Houston_Gaines.jpg)
- J. D. Ford: Photo: Dominic, CC0, via Wikimedia Commons (https://commons.wikimedia.org/wiki/File:JD_Ford,_Indy_Pride_Parade_2023_(2)_(cropped).jpg)
- Jace Yarbrough: Photo: Lt.Cmdr. Jim Remington, Public domain, via Wikimedia Commons (https://commons.wikimedia.org/wiki/File:Joint_Base_Commander_visits_the_US_Air_Force_Honor_Guard_-_Jace_Yarbrough_(cropped).jpg)
- Jacqui Irwin: Photo: California National Guard, CC BY 2.0, via Wikimedia Commons (https://commons.wikimedia.org/wiki/File:150302-Z-WQ610-_(16698067641)_(cropped).jpg)
- Jake Johnson: Photo: Jake Johnson for Congress
- James Talarico: Photo: Antonioaesparza, CC BY-SA 4.0, via Wikimedia Commons (https://commons.wikimedia.org/wiki/File:James_Talarico_Press_Conference_(cropped).jpg)
- Jamie Ager: Photo: Jamie Ager for US Congress
- Janelle Stelson: Photo: James Newton / jnewt-maps on Bluesky, CC BY-SA 4.0, via Wikimedia Commons (https://commons.wikimedia.org/wiki/File:Janelle_Stelson_08-29-2026.jpg)
- Jasmine Clark: Photo: Georgia House of Representatives, Public domain, via Wikimedia Commons (https://commons.wikimedia.org/wiki/File:Member_of_the_Georgia_House_of_Representatives_Jasmine_Michelle_Clark.jpg)
- JB Pritzker: Photo: Oscar Garza, CC BY-SA 4.0, via Wikimedia Commons (https://commons.wikimedia.org/wiki/File:JB_Pritzker_2026_(less_cropped).jpg)
- Jeremy Moss: Photo: Anmanwell, CC BY-SA 4.0, via Wikimedia Commons (https://commons.wikimedia.org/wiki/File:Michigan_Senator_Jeremy_Moss_2019.jpg)
- Jerry Carl: Photo: United States Congress, Public domain, via Wikimedia Commons (https://commons.wikimedia.org/wiki/File:Rep._Jerry_Carl_official_photo.jpg)
- Jessica Hart Steinmann: Photo: CassidySchoettelkotte, CC0, via Wikimedia Commons (https://commons.wikimedia.org/wiki/File:Jessica_Hart_Steinmann.png)
- Jessica Killin: Photo: Jessica Killin for Colorado
- Jim Kingston: Photo: Jim Kingston for Congress
- Jim Pillen: Photo: Maryland GovPics, CC BY 4.0, via Wikimedia Commons (https://commons.wikimedia.org/wiki/File:Jim_Pillen_SelectUSA_(55251574792).jpg)
- JoAnna Mendoza: Photo: Lance Cpl. Shaltiel Dominguez, Public domain, via Wikimedia Commons (https://commons.wikimedia.org/wiki/File:JoAnna_Mendoza,_2013.jpg)
- Jocelyn Benson: Photo: JFM Photo 73, CC BY 4.0, via Wikimedia Commons (https://commons.wikimedia.org/wiki/File:SOS_Jocelyn_Benson_web.jpg)
- Joe Strada: Photo: Joe Strada for Congress
- John Cowan: Photo: Dr. John Cowan for Congress
- Johnny Garrett: Photo: Tennessee General Assembly
- Jonathan Kreiss-Tomkins: Photo: Unknown authorUnknown author, CC BY-SA 4.0, via Wikimedia Commons (https://commons.wikimedia.org/wiki/File:JKTphoto_(cropped).jpg)
- Josh Green: Photo: Aloha102, CC BY-SA 4.0, via Wikimedia Commons (https://commons.wikimedia.org/wiki/File:Josh_Green_Official_Photo_2022_(cropped)_1cropped).jpg)
- Josh Shapiro: Photo: Maryland GovPics, CC BY 2.0, via Wikimedia Commons (https://commons.wikimedia.org/wiki/File:Gov._Shapiro.jpg)
- Josh Turek: Photo: Iowa General Assembly, Free use (Iowa General Assembly), via Wikimedia Commons (https://commons.wikimedia.org/wiki/File:Joshua_Turek_(cropped).jpg)
- Juliana Stratton: Photo: Sgt. Trenton Fouche, Public domain, via Wikimedia Commons (https://commons.wikimedia.org/wiki/File:Juliana_Stratton_2023_(cropped).jpg)
- Kathy Hochul: Photo: Metropolitan Transportation Authority, CC BY 4.0, via Wikimedia Commons (https://commons.wikimedia.org/wiki/File:World_Cup_Transportation_and_Safety_(cropped).jpg)
- Katie Hobbs: Photo: Gage Skidmore from Surprise, AZ, United States of America, CC BY-SA 4.0, via Wikimedia Commons (https://commons.wikimedia.org/wiki/File:Katie_Hobbs_2026.jpg)
- Katy Padilla Stout: Photo: DivaaNut, CC0, via Wikimedia Commons (https://commons.wikimedia.org/wiki/File:Katy_Padilla_Stout_Cropped.jpg)
- Keisha Lance Bottoms: Photo: Executive Office of the President of the United States, Public domain, via Wikimedia Commons (https://commons.wikimedia.org/wiki/File:Keisha_Lance_Bottoms.jpg)
- Kristina Knickerbocker: Photo: Kristina Knickerbocker for Congress
- Kurt Alme: Photo: United States Department of Justice, Public domain, via Wikimedia Commons (https://commons.wikimedia.org/wiki/File:Kurt_G._Alme_official_photo.jpg)
- La Shawn Ford: Photo: US Department of Education, CC BY 2.0, via Wikimedia Commons (https://commons.wikimedia.org/wiki/File:La_Shawn_K._Ford_on_11_December_2023_-_8_(cropped).jpg)
- Larry Rhoden: Photo: U.S. Embassy Jerusalem, CC BY 2.0, via Wikimedia Commons (https://commons.wikimedia.org/wiki/File:Larry_Rhoden_2025_(cropped).jpg)
- Leticia Gutierrez: Photo: Leticia Gutierrez for Congress
- Lindsay James: Photo: Iowa General Assembly, Free use (Iowa General Assembly), via Wikimedia Commons (https://commons.wikimedia.org/wiki/File:Lindsay_James_-_Official_Portrait_-_88th_GA.png)
- Luke Bronin: Photo: Dannel Malloy, CC BY 2.0, via Wikimedia Commons (https://commons.wikimedia.org/wiki/File:Luke_Bronin_(42831415392).jpg)
- Manny Rutinel: Photo: Andybosselman, CC BY-SA 4.0, via Wikimedia Commons (https://commons.wikimedia.org/wiki/File:Manny_Rutinel_at_2024_YIMBY_Denver_Legislative_Kickoff_(cropped).jpg)
- Mark Lamb: Photo: Gage Skidmore from Surprise, AZ, United States of America, CC BY-SA 4.0, via Wikimedia Commons (https://commons.wikimedia.org/wiki/File:Mark_Lamb_(55021585032)_(cropped).jpg)
- Mark Tedford: Photo: State of Oklahoma’s Legislative Service Bureau, Photo Division, Public domain, via Wikimedia Commons (https://commons.wikimedia.org/wiki/File:Tedford_Mark_OKHouse.jpg)
- Mark Teixeira: Photo: Keith Allison, CC BY-SA 2.0, via Wikimedia Commons (https://commons.wikimedia.org/wiki/File:Mark_Teixeira_basepaths_2011.jpg)
- Marni von Wilpert: Photo: City of San Diego, Public domain, via Wikimedia Commons (https://commons.wikimedia.org/wiki/File:Marni_von_Wilpert.jpg)
- Marsha Blackburn: Photo: United States Senate Photographic Studio, Public domain, via Wikimedia Commons (https://commons.wikimedia.org/wiki/File:Sen._Marsha_Blackburn_(R-TN)_official_headshot_-_116th_Congress.jpg)
- Marty Jackley: Photo: Department of Justice, Public domain, via Wikimedia Commons (https://commons.wikimedia.org/wiki/File:Marty_Jackley_US_Attorney.jpg)
- Mary Peltola: Photo: Leah Herman, House Creative Services, Public domain, via Wikimedia Commons (https://commons.wikimedia.org/wiki/File:Mary_Peltola_Congressional_Member_Portrait_(2).jpeg)
- Matt Little: Photo: Travellers & Tinkers, CC BY-SA 4.0, via Wikimedia Commons (https://commons.wikimedia.org/wiki/File:2026Little.jpg)
- Maura Healey: Photo: Governors office, Public domain, via Wikimedia Commons (https://commons.wikimedia.org/wiki/File:Maura_Healey,_official_portrait,_governor.jpg)
- Melat Kiros: Photo: Andra Turner, CC BY-SA 4.0, via Wikimedia Commons (https://commons.wikimedia.org/wiki/File:Melat_Kiros_Portrait.jpg)
- Melissa Bean: Photo: House of Represenatatives, Public domain, via Wikimedia Commons (https://commons.wikimedia.org/wiki/File:Melissa_Bean_Official.jpg)
- Micah Lasher: Photo: Lance Cpl. Steven Wells, Public domain, via Wikimedia Commons (https://commons.wikimedia.org/wiki/File:FWNY25;_U.S._Marines_and_Sailors_hold_wreath_laying_ceremony_Micah_Lasher_(cropped).jpg)
- Michael Alfonso: Photo: Gage Skidmore from Surprise, AZ, United States of America, CC BY-SA 4.0, via Wikimedia Commons (https://commons.wikimedia.org/wiki/File:Michael_Alfonso_(55022725354).jpg)
- Mike Mazzei: Photo: Oklahoma State Senate, Public domain, via Wikimedia Commons (https://commons.wikimedia.org/wiki/File:Mike_Mazzei_OK_Senate_Headshot.jpg)
- Mike McGuire: Photo: State of California, Public domain, via Wikimedia Commons (https://commons.wikimedia.org/wiki/File:State_Senator_Mike_McGuire.jpg)
- Mitchell Berman: Photo: Mitchell Berman for Congress
- Nancy Lacore: Photo: U.S. Navy, Public domain, via Wikimedia Commons (https://commons.wikimedia.org/wiki/File:VADM_Nancy_S._Lacore_(2).jpg)
- Ned Lamont: Photo: The Office of Governor Ned Lamont, CC BY-SA 4.0, via Wikimedia Commons (https://commons.wikimedia.org/wiki/File:Governor_Ned_Lamont_of_Connecticut,_official_portrait.jpg)
- Oliver Gilbert: Photo: DeveryR7, CC BY-SA 4.0, via Wikimedia Commons (https://commons.wikimedia.org/wiki/File:OG3_High_Res_headshot.jpg)
- Paige Cognetti: Photo: US Department of Labor, CC BY 2.0, via Wikimedia Commons (https://commons.wikimedia.org/wiki/File:Paige_Cognetti_(52165104986)_(3x4a).jpg)
- Paul Barringer: Photo: Unknown authorUnknown author, Public domain, via Wikimedia Commons (https://commons.wikimedia.org/wiki/File:Paul_Barringer.png)
- Paul LePage: Photo: Gage Skidmore, CC BY-SA 3.0, via Wikimedia Commons (https://commons.wikimedia.org/wiki/File:Paul_LePage_by_Gage_Skidmore.jpg)
- Peggy Flanagan: Photo: Travellers & Tinkers, CC BY-SA 4.0, via Wikimedia Commons (https://commons.wikimedia.org/wiki/File:2026PeggyFlanagan_(newcropped).jpg)
- Phil Scott: Photo: Master Sgt. Sarah Mattison, U.S. Air National Guard, Public domain, via Wikimedia Commons (https://commons.wikimedia.org/wiki/File:Phil_Scott_2019.png)
- Phil Weiser: Photo: Phil Photos, Public domain, via Wikimedia Commons (https://commons.wikimedia.org/wiki/File:AG_Phil_Weiser.jpg)
- Pia Dandiya: Photo: Executive Office of the President, White House Office, White House Fellows, Public domain, via Wikimedia Commons (https://commons.wikimedia.org/wiki/File:Pia_Dandiya_WHF_(cropped).png)
- Randy Villegas: Photo: Maremoto Fund, CC BY 4.0, via Wikimedia Commons (https://commons.wikimedia.org/wiki/File:Randy_Villegas_at_Vota_Palooza_in_2024_(cropped).jpg)
- Rebecca Bennett: Photo: Rebecca Bennett for Congress
- Rebecca Cooke: Photo: UpNorthNews, CC BY 3.0, via Wikimedia Commons (https://commons.wikimedia.org/wiki/File:Rebecca_Cooke_on_UpNorthNews_March_2025_(cropped).jpg)
- Richard Ojeda: Photo: Richard Ojeda, campaign Flickr account, CC BY-SA 4.0, via Wikimedia Commons (https://commons.wikimedia.org/wiki/File:Richard_Ojeda_shirt.jpg)
- Richard Pan: Photo: Dr. Richard Pan from Sacramento, CA, USA, CC BY-SA 2.0, via Wikimedia Commons (https://commons.wikimedia.org/wiki/File:Richard_Pan_2010.jpg)
- Rob Sand: Photo: Rob Sand for Governor, CC0, via Wikimedia Commons (https://commons.wikimedia.org/wiki/File:Rob_Sand_campaign_headshot_(cropped_1).jpg)
- Roy Cooper: Photo: NCDOTcommunications, CC BY 2.0, via Wikimedia Commons (https://commons.wikimedia.org/wiki/File:Roy_Cooper_in_November_2023_(cropped2).jpg)
- Ryan Elijah: Photo: Ryan Elijah for Congress
- Sam Forstag: Photo: Conorhogan16, CC0, via Wikimedia Commons (https://commons.wikimedia.org/wiki/File:Sam_Forstag_Portrait_(cropped).jpg)
- Sarah Huckabee Sanders: Photo: Gage Skidmore, CC BY-SA 4.0, via Wikimedia Commons (https://commons.wikimedia.org/wiki/File:Governor_Sarah_Huckabee_Sanders_2026.jpg)
- Sarah Trone Garriott: Photo: Iowa General Assembly, Free use (Iowa General Assembly), via Wikimedia Commons (https://commons.wikimedia.org/wiki/File:Sarah_Trone_Garriott.jpg)
- Scott Colom: Photo: Scott Colom for Senate
- Scott Wiener: Photo: California State Senate, Public domain, via Wikimedia Commons (https://commons.wikimedia.org/wiki/File:Scott_Wiener_Official_Biography_Portrait.jpg)
- Sean McCann: Photo: Sean McCann for Congress
- Shannon Taylor: Photo: Shannon Taylor for Congress
- Sherrod Brown: Photo: U.S. Senate Photographic Services; Rebecca Hammel, Public domain, via Wikimedia Commons (https://commons.wikimedia.org/wiki/File:Sherrod_Brown_117th_Congress_(2).jpg)
- Stefany Shaheen: Photo: Jeanne Shaheen, Public domain, via Wikimedia Commons (https://commons.wikimedia.org/wiki/File:Stefany_Shaheen,_2015_(cropped).jpg)
- Steve Toth: Photo: LiwenAristodemos, CC0, via Wikimedia Commons (https://commons.wikimedia.org/wiki/File:SteveToth--EagleForum--TX2Debate--GraceChurch--SpringTX--08Jan2026_(cropped).jpg)
- Teresa Benitez-Thompson: Photo: Nevada Legislature
- Tina Kotek: Photo: Tony Miller, Public domain, via Wikimedia Commons (https://commons.wikimedia.org/wiki/File:Tina_Kotek_official_portrait_2021(3x4_cropped).jpg)
- Tom Sell: Photo: Tom Sell for Congress
- Tommy Tuberville: Photo: United States Senate, Public domain, via Wikimedia Commons (https://commons.wikimedia.org/wiki/File:Sen._Tommy_Tuberville_Official_Portrait,_118th_Congress_(cropped).jpg)
- Troy Jackson: Photo: ArenLeBrun, CC0, via Wikimedia Commons (https://commons.wikimedia.org/wiki/File:Troy_Jackson_in_the_Senate_Chamber_(cropped).jpg)
- Victoria Broderick: Photo: Victoria Broderick for U.S. Congress
- Wes Climer: Photo: South Carolina General Assembly
- Wes Moore: Photo: Maryland State Government, CC BY-SA 4.0, via Wikimedia Commons (https://commons.wikimedia.org/wiki/File:Wes_Moore_Official_Governor_Portrait.jpg)
- William Lawrence: Photo: Sabio117, CC0, via Wikimedia Commons (https://commons.wikimedia.org/wiki/File:William_Lawrence_2026_(cropped).jpg)
- Xavier Becerra: Photo: United States Department of Health and Human Services, Public domain, via Wikimedia Commons (https://commons.wikimedia.org/wiki/File:HHS_Xavier_Becerra.jpg)
- Zach Dembo: Photo: Zach Dembo for Congress
- Zack Mullock: Photo: Zack Mullock for Congress
Every vote counted so far in the states we can read, added up across the country: the House and the Senate apart, since only some states had a Senate race. These are the states' own unofficial counts, and they will move for days as late ballots are counted.
A state whose results feed we cannot read (Texas, Kentucky, Alaska, New Mexico, and the Clarity states Colorado, Iowa, South Carolina and West Virginia since election night) adds nothing, and some states we read only through a few counties. So these totals are a large sample of the country, not all of it; each table says how much it covers. Unopposed candidates often have no count at all. Counts as of 12:27 pm ET.
House of Representatives
From 434 of 435 districts in 50 of 50 states; about 92.2% of the votes we expect in those races are counted. Our published forecast for the whole country's House vote was Democrats 53.3%, Republicans 45.8%.
State by state
| State | Races read | Democrats | Republicans | Others | Margin |
|---|---|---|---|---|---|
| Alaska | 1 of 1 | 15,550 | 105,647 | 91,812 | R+42.3 |
| Alabama | 7 of 7 | 763,464 | 914,968 | 0 | R+9.0 |
| Arkansas | 4 of 4 | 348,659 | 513,184 | 15,361 | R+18.8 |
| Arizona | 9 of 9 | 1,376,612 | 1,104,341 | 44,142 | D+10.8 |
| California | 52 of 52 | 7,047,210 | 3,011,892 | 76,313 | D+39.8 |
| Colorado | 8 of 8 | 1,588,704 | 959,686 | 96,468 | D+23.8 |
| Connecticut | 5 of 5 | 807,159 | 460,150 | 17,106 | D+27.0 |
| Delaware | 1 of 1 | 243,467 | 134,966 | 0 | D+28.7 |
| Florida | 27 of 28 | 3,866,760 | 4,041,390 | 94,624 | R+2.2 |
| Georgia | 14 of 14 | 2,343,334 | 1,826,193 | 0 | D+12.4 |
| Hawaii | 2 of 2 | 255,550 | 105,424 | 9,318 | D+40.5 |
| Iowa | 4 of 4 | 668,875 | 651,081 | 29,620 | D+1.3 |
| Idaho | 2 of 2 | 242,052 | 414,366 | 53,028 | R+24.3 |
| Illinois | 17 of 17 | 2,524,229 | 1,512,080 | 20,185 | D+25.0 |
| Indiana | 9 of 9 | 993,856 | 924,357 | 16,338 | D+3.6 |
| Kansas | 4 of 4 | 522,206 | 545,079 | 29,173 | R+2.1 |
| Kentucky | 6 of 6 | 622,448 | 765,229 | 34,692 | R+10.0 |
| Louisiana | 6 of 6 | 645,814 | 789,454 | 23,905 | R+9.8 |
| Massachusetts | 9 of 9 | 1,722,858 | 507,905 | 110,672 | D+51.9 |
| Maryland | 8 of 8 | 1,400,387 | 622,932 | 19,487 | D+38.1 |
| Maine | 2 of 2 | 415,297 | 299,882 | 6,146 | D+16.0 |
| Michigan | 13 of 13 | 2,532,673 | 2,108,425 | 102,601 | D+8.9 |
| Minnesota | 8 of 8 | 1,574,312 | 1,214,759 | 27,742 | D+12.8 |
| Missouri | 8 of 8 | 1,008,286 | 1,023,204 | 59,639 | R+0.7 |
| Mississippi | 4 of 4 | 442,496 | 488,946 | 18,980 | R+4.9 |
| Montana | 2 of 2 | 202,434 | 250,040 | 28,604 | R+9.9 |
| North Carolina | 14 of 14 | 2,385,601 | 1,752,629 | 52,646 | D+15.1 |
| North Dakota | 1 of 1 | 85,892 | 134,477 | 13,886 | R+20.7 |
| Nebraska | 3 of 3 | 310,846 | 404,557 | 37,595 | R+12.4 |
| New Hampshire | 2 of 2 | 366,138 | 258,250 | 7,478 | D+17.1 |
| New Jersey | 12 of 12 | 1,824,143 | 1,015,145 | 44,009 | D+28.1 |
| New Mexico | 3 of 3 | 444,863 | 277,531 | 0 | D+23.2 |
| Nevada | 4 of 4 | 615,436 | 429,832 | 36,056 | D+17.2 |
| New York | 26 of 26 | 3,716,188 | 2,256,651 | 40,687 | D+24.3 |
| Ohio | 15 of 15 | 2,318,450 | 2,178,153 | 53,402 | D+3.1 |
| Oklahoma | 5 of 5 | 454,345 | 643,929 | 18,961 | R+17.0 |
| Oregon | 6 of 6 | 1,082,887 | 743,769 | 21,677 | D+18.3 |
| Pennsylvania | 17 of 17 | 2,806,337 | 2,143,024 | 17,380 | D+13.4 |
| Rhode Island | 2 of 2 | 232,582 | 118,688 | 6,931 | D+31.8 |
| South Carolina | 7 of 7 | 978,160 | 1,030,974 | 23,026 | R+2.6 |
| South Dakota | 1 of 1 | 109,997 | 195,588 | 0 | R+28.0 |
| Tennessee | 9 of 9 | 896,349 | 1,095,895 | 39,360 | R+9.8 |
| Texas | 38 of 38 | 5,147,937 | 4,591,917 | 43,589 | D+5.7 |
| Utah | 4 of 4 | 0 | 0 | 1,019,781 | level |
| Virginia | 11 of 11 | 2,115,766 | 1,433,530 | 59,130 | D+18.9 |
| Vermont | 1 of 1 | 198,758 | 94,078 | 11,593 | D+34.4 |
| Washington | 10 of 10 | 1,866,055 | 1,068,775 | 12,695 | D+27.0 |
| Wisconsin | 8 of 8 | 1,454,885 | 1,106,269 | 25,219 | D+13.5 |
| West Virginia | 2 of 2 | 180,597 | 262,510 | 6,904 | R+18.2 |
| Wyoming | 1 of 1 | 61,684 | 99,891 | 21,625 | R+20.9 |
Senate
From 35 of 35 races in 35 of 35 states; about 99.1% of the votes we expect in those races are counted.
State by state
| State | Races read | Democrats | Republicans | Others | Margin |
|---|---|---|---|---|---|
| Alaska | 1 of 1 | 102,962 | 107,171 | 3,600 | R+2.0 |
| Alabama | 1 of 1 | 759,321 | 917,338 | 0 | R+9.4 |
| Arkansas | 1 of 1 | 375,852 | 480,817 | 29,490 | R+11.8 |
| Colorado | 1 of 1 | 1,609,163 | 932,741 | 120,149 | D+25.4 |
| Delaware | 1 of 1 | 240,347 | 137,764 | 0 | D+27.1 |
| Florida | 1 of 1 | 3,972,098 | 4,210,247 | 94,608 | R+2.9 |
| Georgia | 1 of 1 | 2,467,109 | 1,713,166 | 0 | D+18.0 |
| Iowa | 1 of 1 | 688,295 | 631,227 | 42,122 | D+4.2 |
| Idaho | 1 of 1 | 0 | 401,778 | 308,946 | R+56.5 |
| Illinois | 1 of 1 | 2,501,456 | 1,510,968 | 64,555 | D+24.3 |
| Kansas | 1 of 1 | 561,143 | 505,558 | 33,195 | D+5.1 |
| Kentucky | 1 of 1 | 612,357 | 784,869 | 29,892 | R+12.1 |
| Louisiana | 1 of 1 | 720,116 | 745,971 | 0 | R+1.8 |
| Massachusetts | 1 of 1 | 1,650,779 | 837,156 | 116,368 | D+31.2 |
| Maine | 1 of 1 | 376,913 | 332,293 | 359 | D+6.3 |
| Michigan | 1 of 1 | 2,520,388 | 2,180,541 | 96,062 | D+7.1 |
| Minnesota | 1 of 1 | 1,520,608 | 1,233,468 | 77,382 | D+10.1 |
| Mississippi | 1 of 1 | 467,930 | 465,356 | 20,028 | D+0.3 |
| Montana | 1 of 1 | 58,555 | 232,916 | 190,543 | R+36.2 |
| North Carolina | 1 of 1 | 2,467,962 | 1,643,094 | 92,112 | D+19.6 |
| Nebraska | 1 of 1 | 0 | 378,244 | 376,123 | R+50.1 |
| New Hampshire | 1 of 1 | 355,539 | 268,518 | 12,068 | D+13.7 |
| New Jersey | 1 of 1 | 1,822,397 | 1,024,279 | 75,787 | D+27.3 |
| New Mexico | 1 of 1 | 458,756 | 266,434 | 0 | D+26.5 |
| Ohio | 1 of 1 | 2,301,042 | 2,077,748 | 222,781 | D+4.9 |
| Oklahoma | 1 of 1 | 439,109 | 639,510 | 39,313 | R+17.9 |
| Oregon | 1 of 1 | 1,081,831 | 719,976 | 60,827 | D+19.4 |
| Rhode Island | 1 of 1 | 240,069 | 105,346 | 14,230 | D+37.5 |
| South Carolina | 1 of 1 | 1,043,719 | 951,904 | 45,305 | D+4.5 |
| South Dakota | 1 of 1 | 0 | 184,589 | 120,513 | R+60.5 |
| Tennessee | 1 of 1 | 886,974 | 1,138,457 | 41,459 | R+12.2 |
| Texas | 1 of 1 | 5,447,069 | 4,250,664 | 190,323 | D+12.1 |
| Virginia | 1 of 1 | 2,204,231 | 1,381,511 | 9,546 | D+22.9 |
| West Virginia | 1 of 1 | 172,935 | 266,088 | 17,139 | R+20.4 |
| Wyoming | 1 of 1 | 65,097 | 122,157 | 0 | R+30.5 |
How far each place has moved since the 2024 presidential election: the margin counted now against the 2024 margin for president in the same place. A midterm is not a presidential race, so this is a guide to the mood, not a like-for-like swing; the counts are unofficial until certified.
By kind of county
Every county in the Senate and governor races we read county by county, sorted by how densely they vote and cut into four groups with a quarter of the 2024 vote each. A county counts once its count is at least half of the votes we expect there, weighted by its votes. Races with an independent as the main challenger are left out.
Big cities
the densest counties, a quarter of the vote
93 of 93 counties so far
Dense suburbs
the next quarter of the vote
142 of 142 counties so far
Smaller cities and towns
the next quarter
328 of 329 counties so far
Rural
the least dense counties, the last quarter of the vote
2023 of 2027 counties so far
Senate 32 with half or more counted; 30 moved towards the Democrats, 2 towards the Republicans
Governors 36 with half or more counted; 32 moved towards the Democrats, 4 towards the Republicans
House districts 416 with half or more counted; 411 moved towards the Democrats, 5 towards the Republicans
The 48 biggest shifts of 416. The map's "Shift since 2024" shows every district.
Every Senate, governor and House race with a result so far, against the favourite in the forecast we published before the polls closed. A race has a result here once we have called it (97% sure on the count, after its polls close) or its count is in (95% of the votes we expect). Our calls are our judgement until the states certify, so this page will change as the last races are settled.
Our ratings against the results: Senate and governors
Each race sits in the column of the rating our forecast gave it, coloured by who has it now: solid when won, pale when only leading, hatched when the seat changed hands, grey when nothing is counted. A red race in a blue column is an upset.
Were our chances honest?
A forecast that says 70% should see its favourite lose about three times in ten. Each band below compares how often the favourite won with how often we said they would.
| Our favourite's chance | Races | We expected the favourite to win | The favourite won |
|---|---|---|---|
| 50 to 65% | 24 | 58% | 67% |
| 65 to 85% | 46 | 76% | 93% |
| 85 to 99% | 124 | 94% | 95% |
| 99% or more | 274 | 100% | 100% |
Where our favourite lost (17)
| Race | We had | Won | How we know |
|---|---|---|---|
| North Carolina's 9th district | Republican 93% | Democrat | our call |
| North Carolina's 13th district | Republican 92% | Democrat | our call |
| North Carolina's 6th district | Republican 90% | Democrat | our call |
| North Carolina's 14th district | Republican 88% | Democrat | our call |
| New Jersey's 2nd district | Republican 87% | Democrat | our call |
| Indiana's 5th district | Republican 85% | Democrat | our call |
| Texas's 9th district | Republican 78% | Democrat | our call |
| Nevada's 2nd district | Republican 74% | Democrat | our call |
| Texas's 23rd district | Republican 68% | Democrat | our call |
| Texas governor | Republican 63% | Democrat | our call |
| South Carolina Senate | Republican 62% | Democrat | our call |
| South Carolina's 1st district | Republican 59% | Democrat | our call |
| Colorado's 5th district | Republican 58% | Democrat | our call |
| Vermont governor | Democrat 58% | Republican | our call |
| Alabama's 2nd district | Republican 57% | Democrat | our call |
| Ohio's 7th district | Republican 55% | Democrat | our call |
| Ohio's 15th district | Republican 52% | Democrat | our call |
Every race without a result yet: not called by us and not fully counted. Some will take days: California counts for weeks, Alaska's ranked-choice count waits for late ballots, and Louisiana's races where nobody reached 50% go to a runoff on 12 December. States whose feed we cannot read stay here until we can confirm the count another way.
| Race | Our forecast | Counted | Leading | Margin | Status |
|---|---|---|---|---|---|
| Alaska Senate | Democrat 71% | 74% | Republican | R+0.2 | too close to call |
| Mississippi Senate | Republican 85% | 97% | Democrat | D+0.3 | too close to call |
| Kansas governor | Democrat 51% | 99% | Democrat | D+0.7 | too close to call |
| Alaska governor | Democrat 69% | 74% | Democrat | D+15.4 | too close to call |
| Florida's 7th district | Republican 58% | 99% | Republican | R+0.5 | call withdrawn |
| Minnesota's 1st district | Republican 64% | 99% | Democrat | D+0.1 | call withdrawn |
| Florida's 9th district | Republican 66% | 99% | Democrat | D+0.5 | call withdrawn |
| Maine's 2nd district | Democrat 72% | 98% | Republican | R+1.6 | too close to call |
| Washington's 5th district | Republican 72% | 82% | Republican | R+3.4 | call withdrawn |
| Florida's 27th district | Republican 72% | 99% | Republican | R+0.4 | call withdrawn |
| Florida's 13th district | Republican 76% | 99% | Republican | R+0.8 | call withdrawn |
| North Carolina's 3rd district | Republican 78% | 99% | Republican | R+0.1 | too close to call |
| Florida's 26th district | Republican 80% | 99% | Republican | R+0.7 | call withdrawn |
| North Carolina's 7th district | Republican 85% | 99% | Republican | R+0.8 | call withdrawn |
| California's 23rd district | Republican 91% | 85% | Republican | R+2.8 | call withdrawn |
| North Carolina's 5th district | Republican 91% | 99% | Democrat | level | call withdrawn |
| Colorado's 4th district | Republican 93% | 97% | Democrat | D+0.8 | call withdrawn |
| Tennessee's 4th district | Republican 97% | 99% | Democrat | D+0.1 | too close to call |
| Alaska's at-large district | Republican 100% | 74% | Republican | R+5.2 | too close to call |
The night forecast is switched off (admin settings, "Show the night forecast"), or the forecast isn't loaded.
Early returns against what we expect
Each county's benchmark is its 2024 presidential margin, moved by the same amount everywhere so the state adds up to our forecast, with the votes we expect from its 2022 turnout.
Like with like. Mail ballots lean Democratic and Election Day votes Republican, and states count them in different orders, so a first batch of mail can look like a Democratic night when it isn't. Where a state's feed splits its count by method (North Carolina, Georgia, Virginia, Iowa, and Kent, Ingham, Cuyahoga and Lancaster counties), each method is compared with how that method voted in the same county in 2024, from the state's own 2024 results. Where a feed gives totals only, a county counts towards the race's read only once it looks complete (95% of the votes we expect). This assumes every method moves by the same amount since 2024; who votes by mail and who votes on the day shifts between a presidential year and a midterm, so one method running ahead of the others can be a change in the mix rather than a miss in the polls.
"If the rest runs the same" moves our forecast by that like-for-like gap; it's a plain read, not the live model's projection. Unofficial results from the states' own feeds.
Kansas governor Cindy Holscher v Ty Masterson · our forecast Even, 51% Democrat · totals only
| County | 2024 president | Expected tonight | Expected votes | Counted | Counted margin | Gap |
|---|---|---|---|---|---|---|
| Johnson ✓ | D+8.5 | D+24.8 | 262,697 | 295,428 (112%) | D+22.8 | −2.0 |
| Sedgwick ✓ | R+13.8 | D+2.4 | 155,206 | 181,679 (117%) | D+4.7 | +2.2 |
| Shawnee ✓ | D+0.5 | D+16.8 | 65,914 | 69,600 (106%) | D+14.2 | −2.6 |
| Douglas ✓ | D+38.0 | D+54.3 | 47,396 | 50,732 (107%) | D+52.2 | −2.1 |
| Wyandotte ✓ | D+23.9 | D+40.1 | 35,035 | 42,904 (122%) | D+45.8 | +5.7 |
| Leavenworth ✓ | R+22.8 | R+6.5 | 26,893 | 28,286 (105%) | R+6.6 | −0.1 |
| Butler ✓ | R+41.2 | R+24.9 | 23,756 | 25,933 (109%) | R+26.0 | −1.1 |
| Reno ✓ | R+34.5 | R+18.2 | 20,776 | 21,644 (104%) | R+20.1 | −1.9 |
| Riley ✓ | D+1.8 | D+18.1 | 18,195 | 19,946 (110%) | D+17.4 | −0.6 |
| Saline ✓ | R+31.6 | R+15.3 | 17,731 | 19,520 (110%) | R+17.7 | −2.4 |
| Miami ✓ | R+39.5 | R+23.2 | 13,494 | 14,042 (104%) | R+23.8 | −0.5 |
| Harvey ✓ | R+21.1 | R+4.8 | 12,917 | 13,653 (106%) | R+7.6 | −2.8 |
| Crawford ✓ | R+25.3 | R+9.0 | 11,834 | 12,188 (103%) | R+7.9 | +1.1 |
| McPherson ✓ | R+41.1 | R+24.8 | 11,154 | 11,482 (103%) | R+28.6 | −3.8 |
| Lyon ✓ | R+14.7 | D+1.6 | 10,128 | 11,216 (111%) | D+2.5 | +1.0 |
| Pottawatomie ✓ | R+47.6 | R+31.4 | 10,503 | 10,798 (103%) | R+33.6 | −2.3 |
| Ellis ✓ | R+46.1 | R+29.9 | 10,552 | 10,623 (101%) | R+27.9 | +2.0 |
| Cowley ✓ | R+40.3 | R+24.0 | 10,671 | 10,453 (98%) | R+24.9 | −0.8 |
| Franklin ✓ | R+40.1 | R+23.8 | 9,535 | 9,758 (102%) | R+23.5 | +0.3 |
| Finney ✓ | R+34.7 | R+18.4 | 7,191 | 9,191 (128%) | R+0.9 | +17.5 |
| Montgomery | R+51.1 | R+34.8 | 9,611 | 9,016 (94%) | R+34.1 | +0.7 * |
| Barton ✓ | R+56.7 | R+40.5 | 8,095 | 8,429 (104%) | R+42.0 | −1.5 |
| Sumner ✓ | R+50.1 | R+33.8 | 7,890 | 8,083 (102%) | R+33.0 | +0.8 |
| Jefferson ✓ | R+36.9 | R+20.6 | 7,622 | 7,880 (103%) | R+23.7 | −3.0 |
| Ford ✓ | R+38.4 | R+22.1 | 5,994 | 7,183 (120%) | R+2.0 | +20.1 |
| Dickinson ✓ | R+55.0 | R+38.7 | 6,943 | 7,160 (103%) | R+41.5 | −2.9 |
| Geary ✓ | R+17.6 | R+1.3 | 6,075 | 6,716 (111%) | D+0.1 | +1.4 |
| Osage ✓ | R+48.0 | R+31.8 | 6,285 | 6,062 (96%) | R+34.2 | −2.5 |
| Cherokee | R+52.9 | R+36.7 | 6,433 | 6,027 (94%) | R+40.0 | −3.3 * |
| Labette ✓ | R+38.2 | R+21.9 | 5,932 | 5,819 (98%) | R+23.7 | −1.8 |
| Jackson ✓ | R+42.6 | R+26.3 | 5,105 | 5,270 (103%) | R+27.8 | −1.5 |
| Atchison | R+37.4 | R+21.1 | 5,486 | 5,168 (94%) | R+21.1 | −0.0 * |
| Neosho ✓ | R+48.1 | R+31.9 | 5,106 | 4,895 (96%) | R+33.0 | −1.1 |
| Marion ✓ | R+49.1 | R+32.8 | 4,815 | 4,681 (97%) | R+36.9 | −4.1 |
| Bourbon | R+54.2 | R+37.9 | 4,839 | 4,578 (95%) | R+42.4 | −4.5 * |
| Nemaha ✓ | R+67.0 | R+50.8 | 4,609 | 4,466 (97%) | R+59.7 | −8.9 |
| Seward ✓ | R+39.0 | R+22.7 | 2,944 | 4,174 (142%) | D+9.0 | +31.7 |
| Allen ✓ | R+46.1 | R+29.9 | 4,138 | 4,067 (98%) | R+29.3 | +0.6 |
| Marshall ✓ | R+49.1 | R+32.8 | 3,899 | 3,885 (100%) | R+39.9 | −7.1 |
| Linn ✓ | R+64.6 | R+48.3 | 3,723 | 3,620 (97%) | R+53.3 | −5.0 |
| Coffey ✓ | R+55.7 | R+39.4 | 3,443 | 3,359 (98%) | R+45.6 | −6.2 |
| Brown ✓ | R+47.9 | R+31.7 | 3,367 | 3,355 (100%) | R+37.8 | −6.1 |
| Clay ✓ | R+55.5 | R+39.2 | 3,301 | 3,314 (100%) | R+45.5 | −6.3 |
| Pratt ✓ | R+51.4 | R+35.2 | 3,128 | 3,280 (105%) | R+36.4 | −1.2 |
| Wabaunsee ✓ | R+48.8 | R+32.5 | 3,353 | 3,246 (97%) | R+38.1 | −5.6 |
| Rice ✓ | R+56.7 | R+40.4 | 3,112 | 3,215 (103%) | R+42.3 | −1.9 |
| Cloud ✓ | R+60.6 | R+44.3 | 3,209 | 3,147 (98%) | R+47.1 | −2.8 |
| Kingman ✓ | R+59.9 | R+43.7 | 3,100 | 3,095 (100%) | R+46.9 | −3.2 |
| Anderson ✓ | R+59.8 | R+43.5 | 2,908 | 2,845 (98%) | R+45.7 | −2.2 |
| Thomas ✓ | R+65.8 | R+49.5 | 2,888 | 2,834 (98%) | R+53.0 | −3.5 |
| Wilson | R+62.4 | R+46.1 | 3,322 | 2,764 (83%) | R+52.2 | −6.2 * |
| Doniphan ✓ | R+63.5 | R+47.3 | 2,644 | 2,558 (97%) | R+54.0 | −6.8 |
| Russell | R+61.3 | R+45.0 | 2,717 | 2,535 (93%) | R+50.3 | −5.3 * |
| Mitchell ✓ | R+65.6 | R+49.3 | 2,375 | 2,480 (104%) | R+55.3 | −6.0 |
| Ottawa ✓ | R+66.6 | R+50.3 | 2,388 | 2,434 (102%) | R+57.9 | −7.6 |
| Morris ✓ | R+46.6 | R+30.3 | 2,244 | 2,315 (103%) | R+29.2 | +1.0 |
| Ellsworth ✓ | R+52.3 | R+36.0 | 2,244 | 2,229 (99%) | R+38.0 | −2.0 |
| Greenwood ✓ | R+61.0 | R+44.7 | 2,320 | 2,216 (96%) | R+48.6 | −3.9 |
| Washington ✓ | R+69.1 | R+52.9 | 2,257 | 2,159 (96%) | R+63.8 | −10.9 |
| Pawnee | R+51.5 | R+35.2 | 2,155 | 2,047 (95%) | R+39.0 | −3.8 * |
| Phillips | R+73.7 | R+57.4 | 2,199 | 1,971 (90%) | R+66.8 | −9.4 * |
| Republic ✓ | R+65.7 | R+49.4 | 1,970 | 1,941 (99%) | R+55.3 | −5.9 |
| Rooks | R+71.2 | R+54.9 | 2,104 | 1,931 (92%) | R+59.0 | −4.1 * |
| Sherman | R+68.7 | R+52.5 | 2,052 | 1,893 (92%) | R+58.1 | −5.6 * |
| Harper | R+64.0 | R+47.7 | 1,979 | 1,847 (93%) | R+51.8 | −4.1 * |
| Norton ✓ | R+67.7 | R+51.4 | 1,799 | 1,798 (100%) | R+58.2 | −6.8 |
| Barber | R+72.2 | R+55.9 | 1,745 | 1,655 (95%) | R+61.1 | −5.2 * |
| Scott ✓ | R+74.7 | R+58.4 | 1,703 | 1,649 (97%) | R+58.8 | −0.3 |
| Gray ✓ | R+69.0 | R+52.7 | 1,718 | 1,647 (96%) | R+55.6 | −2.8 |
| Grant ✓ | R+63.0 | R+46.7 | 1,613 | 1,644 (102%) | R+40.9 | +5.8 |
| Smith | R+68.5 | R+52.3 | 1,645 | 1,519 (92%) | R+60.9 | −8.6 * |
| Stafford ✓ | R+64.0 | R+47.7 | 1,571 | 1,507 (96%) | R+50.1 | −2.4 |
| Stevens ✓ | R+75.5 | R+59.2 | 1,401 | 1,358 (97%) | R+57.3 | +1.9 |
| Meade ✓ | R+69.6 | R+53.3 | 1,312 | 1,356 (103%) | R+56.0 | −2.7 |
| Trego ✓ | R+71.0 | R+54.7 | 1,263 | 1,347 (107%) | R+59.3 | −4.6 |
| Osborne | R+68.5 | R+52.3 | 1,440 | 1,293 (90%) | R+59.5 | −7.2 * |
| Rush ✓ | R+65.4 | R+49.2 | 1,334 | 1,287 (96%) | R+51.2 | −2.0 |
| Lincoln ✓ | R+65.2 | R+49.0 | 1,204 | 1,278 (106%) | R+56.2 | −7.2 |
| Jewell ✓ | R+75.9 | R+59.6 | 1,208 | 1,199 (99%) | R+71.0 | −11.4 |
| Chase ✓ | R+50.8 | R+34.5 | 1,185 | 1,145 (97%) | R+37.1 | −2.6 |
| Woodson | R+61.3 | R+45.0 | 1,185 | 1,113 (94%) | R+50.0 | −5.0 * |
| Chautauqua | R+71.3 | R+55.0 | 1,182 | 1,109 (94%) | R+61.2 | −6.2 * |
| Logan ✓ | R+71.6 | R+55.4 | 1,105 | 1,103 (100%) | R+62.8 | −7.5 |
| Decatur ✓ | R+69.0 | R+52.7 | 1,132 | 1,089 (96%) | R+63.3 | −10.5 |
| Rawlins | R+72.6 | R+56.3 | 1,155 | 1,073 (93%) | R+60.7 | −4.4 * |
| Ness | R+78.9 | R+62.7 | 1,157 | 1,071 (93%) | R+68.3 | −5.6 * |
| Cheyenne ✓ | R+68.8 | R+52.6 | 1,039 | 1,065 (103%) | R+63.0 | −10.4 |
| Sheridan ✓ | R+80.3 | R+64.1 | 1,112 | 1,061 (95%) | R+74.9 | −10.9 |
| Kearny ✓ | R+68.4 | R+52.1 | 957 | 1,030 (108%) | R+54.0 | −1.8 |
| Edwards | R+65.3 | R+49.1 | 1,093 | 1,019 (93%) | R+51.3 | −2.3 * |
| Graham ✓ | R+65.7 | R+49.4 | 1,033 | 1,012 (98%) | R+53.8 | −4.4 |
| Haskell ✓ | R+64.5 | R+48.2 | 994 | 1,010 (102%) | R+50.1 | −1.9 |
| Elk | R+69.7 | R+53.4 | 1,076 | 997 (93%) | R+60.1 | −6.7 * |
| Gove | R+77.1 | R+60.9 | 1,161 | 952 (82%) | R+66.2 | −5.3 * |
| Kiowa | R+71.4 | R+55.1 | 944 | 881 (93%) | R+61.6 | −6.5 * |
| Morton | R+73.4 | R+57.1 | 808 | 761 (94%) | R+62.9 | −5.8 * |
| Clark | R+72.8 | R+56.5 | 854 | 747 (87%) | R+56.4 | +0.2 * |
| Hodgeman | R+70.5 | R+54.2 | 807 | 727 (90%) | R+58.7 | −4.5 * |
| Wichita ✓ | R+73.6 | R+57.3 | 713 | 692 (97%) | R+63.3 | −6.0 |
| Lane ✓ | R+70.9 | R+54.7 | 681 | 649 (95%) | R+61.5 | −6.8 |
| Comanche | R+68.3 | R+52.0 | 744 | 630 (85%) | R+54.9 | −2.9 * |
| Wallace | R+84.8 | R+68.5 | 672 | 592 (88%) | R+76.7 | −8.2 * |
| Hamilton | R+66.3 | R+50.0 | 605 | 568 (94%) | R+49.3 | +0.7 * |
| Stanton ✓ | R+63.6 | R+47.3 | 517 | 524 (101%) | R+53.8 | −6.5 |
| Greeley ✓ | R+73.4 | R+57.1 | 453 | 440 (97%) | R+54.5 | +2.5 |
Gap: + is better for the Democrat than we expected, − better for the Republican. ≡ compared method by method; * whole county, not yet complete (skewed by count order, left out of the race's read).
Nebraska Senate Dan Osborn v Pete Ricketts · our forecast R+0.9, 57% Republican · totals only
| County | 2024 president | Expected tonight | Expected votes | Counted | Counted margin | Gap |
|---|---|---|---|---|---|---|
| Douglas ✓ | D+10.1 | I+30.2 | 190,746 | 219,335 (115%) | I+21.1 | −9.1 |
| Lancaster ✓ | D+4.3 | I+24.4 | 114,001 | 127,622 (112%) | I+20.0 | −4.4 |
| Sarpy ✓ | R+11.6 | I+8.5 | 64,436 | 79,640 (124%) | I+4.4 | −4.1 |
| Buffalo ✓ | R+44.7 | R+24.6 | 15,897 | 19,252 (121%) | R+28.8 | −4.2 |
| Hall ✓ | R+37.6 | R+17.5 | 15,167 | 18,115 (119%) | R+19.9 | −2.4 |
| Dodge ✓ | R+32.4 | R+12.4 | 11,515 | 12,936 (112%) | R+15.5 | −3.2 |
| Lincoln ✓ | R+54.9 | R+34.8 | 12,052 | 12,838 (107%) | R+40.7 | −5.9 |
| Platte ✓ | R+58.0 | R+38.0 | 11,106 | 12,274 (111%) | R+43.0 | −5.1 |
| Madison ✓ | R+55.7 | R+35.6 | 11,617 | 12,131 (104%) | R+41.2 | −5.5 |
| Cass ✓ | R+37.0 | R+16.9 | 11,336 | 12,016 (106%) | R+21.4 | −4.5 |
| Scotts Bluff ✓ | R+47.5 | R+27.4 | 9,816 | 11,673 (119%) | R+28.4 | −1.0 |
| Adams ✓ | R+41.4 | R+21.3 | 10,254 | 11,034 (108%) | R+26.5 | −5.1 |
| Saunders ✓ | R+46.2 | R+26.1 | 9,606 | 10,791 (112%) | R+31.2 | −5.1 |
| Washington ✓ | R+42.2 | R+22.1 | 8,803 | 9,679 (110%) | R+28.8 | −6.7 |
| Gage ✓ | R+39.0 | R+18.9 | 7,991 | 8,617 (108%) | R+21.7 | −2.8 |
| Seward ✓ | R+46.3 | R+26.3 | 6,721 | 7,529 (112%) | R+32.9 | −6.6 |
| Dawson ✓ | R+49.3 | R+29.3 | 5,618 | 6,904 (123%) | R+27.8 | +1.5 |
| Otoe ✓ | R+38.7 | R+18.6 | 5,751 | 6,476 (113%) | R+22.1 | −3.4 |
| York ✓ | R+51.1 | R+31.0 | 5,011 | 5,395 (108%) | R+38.1 | −7.1 |
| Dakota ✓ | R+29.7 | R+9.6 | 3,603 | 4,971 (138%) | R+13.0 | −3.4 |
| Custer ✓ | R+71.9 | R+51.9 | 4,326 | 4,661 (108%) | R+61.8 | −10.0 |
| Saline ✓ | R+33.1 | R+13.0 | 3,755 | 4,539 (121%) | R+9.7 | +3.3 |
| Hamilton ✓ | R+60.1 | R+40.0 | 4,068 | 4,347 (107%) | R+46.6 | −6.6 |
| Red Willow ✓ | R+68.1 | R+48.0 | 3,986 | 4,257 (107%) | R+54.0 | −6.0 |
| Holt ✓ | R+73.6 | R+53.5 | 3,750 | 4,206 (112%) | R+60.7 | −7.1 |
| Cedar ✓ | R+69.6 | R+49.6 | 3,738 | 3,911 (105%) | R+59.5 | −9.9 |
| Phelps ✓ | R+68.1 | R+48.0 | 3,675 | 3,821 (104%) | R+55.8 | −7.8 |
| Knox ✓ | R+62.9 | R+42.9 | 3,648 | 3,711 (102%) | R+53.6 | −10.7 |
| Box Butte ✓ | R+56.2 | R+36.1 | 3,345 | 3,591 (107%) | R+33.3 | +2.8 |
| Butler ✓ | R+59.3 | R+39.3 | 3,492 | 3,585 (103%) | R+46.2 | −6.9 |
| Merrick ✓ | R+64.6 | R+44.6 | 3,302 | 3,521 (107%) | R+49.3 | −4.8 |
| Cheyenne ✓ | R+63.8 | R+43.7 | 3,313 | 3,392 (102%) | R+48.8 | −5.1 |
| Keith ✓ | R+63.6 | R+43.5 | 2,891 | 3,371 (117%) | R+50.8 | −7.3 |
| Wayne ✓ | R+49.0 | R+28.9 | 3,023 | 3,321 (110%) | R+33.0 | −4.1 |
| Cuming ✓ | R+59.7 | R+39.6 | 3,194 | 3,312 (104%) | R+51.2 | −11.5 |
| Pierce ✓ | R+75.9 | R+55.8 | 2,851 | 3,099 (109%) | R+64.7 | −8.9 |
| Dawes ✓ | R+46.8 | R+26.7 | 3,099 | 3,098 (100%) | R+29.8 | −3.0 |
| Richardson ✓ | R+51.2 | R+31.1 | 2,918 | 3,061 (105%) | R+36.9 | −5.8 |
| Burt ✓ | R+44.9 | R+24.8 | 2,790 | 2,993 (107%) | R+29.7 | −4.9 |
| Kearney ✓ | R+57.7 | R+37.7 | 2,536 | 2,912 (115%) | R+46.7 | −9.0 |
| Colfax ✓ | R+50.7 | R+30.6 | 2,413 | 2,889 (120%) | R+27.1 | +3.5 |
| Clay ✓ | R+63.1 | R+43.0 | 2,714 | 2,866 (106%) | R+50.7 | −7.6 |
| Jefferson ✓ | R+45.1 | R+25.0 | 2,665 | 2,764 (104%) | R+29.5 | −4.5 |
| Nemaha ✓ | R+44.5 | R+24.4 | 2,335 | 2,759 (118%) | R+29.5 | −5.1 |
| Antelope ✓ | R+76.1 | R+56.0 | 2,347 | 2,740 (117%) | R+64.0 | −8.0 |
| Howard ✓ | R+62.4 | R+42.3 | 2,422 | 2,739 (113%) | R+51.2 | −8.9 |
| Stanton ✓ | R+66.4 | R+46.3 | 2,441 | 2,656 (109%) | R+52.4 | −6.2 |
| Boone ✓ | R+65.7 | R+45.7 | 2,576 | 2,463 (96%) | R+53.2 | −7.6 |
| Cherry ✓ | R+75.8 | R+55.7 | 2,369 | 2,446 (103%) | R+64.6 | −8.8 |
| Fillmore ✓ | R+54.6 | R+34.5 | 2,428 | 2,378 (98%) | R+39.7 | −5.2 |
| Dixon ✓ | R+58.4 | R+38.3 | 2,209 | 2,267 (103%) | R+48.3 | −10.1 |
| Thayer ✓ | R+60.5 | R+40.4 | 2,160 | 2,239 (104%) | R+47.8 | −7.4 |
| Polk ✓ | R+63.3 | R+43.3 | 2,052 | 2,130 (104%) | R+51.6 | −8.3 |
| Morrill ✓ | R+68.1 | R+48.0 | 1,923 | 2,025 (105%) | R+55.0 | −7.0 |
| Sheridan ✓ | R+69.7 | R+49.6 | 1,678 | 2,011 (120%) | R+57.1 | −7.5 |
| Furnas ✓ | R+69.5 | R+49.4 | 1,859 | 1,990 (107%) | R+56.1 | −6.8 |
| Johnson ✓ | R+40.3 | R+20.2 | 1,615 | 1,820 (113%) | R+22.1 | −1.9 |
| Valley ✓ | R+63.6 | R+43.5 | 1,770 | 1,811 (102%) | R+51.3 | −7.8 |
| Nuckolls ✓ | R+63.3 | R+43.2 | 1,558 | 1,716 (110%) | R+52.0 | −8.8 |
| Thurston ✓ | R+6.9 | I+13.2 | 1,290 | 1,547 (120%) | R+2.2 | −15.4 |
| Chase ✓ | R+77.0 | R+56.9 | 1,525 | 1,537 (101%) | R+62.7 | −5.8 |
| Harlan ✓ | R+67.7 | R+47.6 | 1,417 | 1,406 (99%) | R+57.3 | −9.7 |
| Webster ✓ | R+65.1 | R+45.0 | 1,283 | 1,348 (105%) | R+53.6 | −8.6 |
| Nance ✓ | R+60.1 | R+40.0 | 1,251 | 1,341 (107%) | R+44.7 | −4.7 |
| Sherman ✓ | R+59.9 | R+39.8 | 1,220 | 1,311 (107%) | R+43.6 | −3.8 |
| Kimball ✓ | R+66.6 | R+46.6 | 1,333 | 1,288 (97%) | R+51.6 | −5.0 |
| Brown ✓ | R+74.3 | R+54.2 | 1,154 | 1,275 (110%) | R+63.3 | −9.1 |
| Franklin ✓ | R+69.3 | R+49.3 | 1,186 | 1,222 (103%) | R+61.9 | −12.7 |
| Perkins ✓ | R+72.3 | R+52.2 | 1,098 | 1,162 (106%) | R+55.2 | −2.9 |
| Pawnee ✓ | R+57.8 | R+37.7 | 1,081 | 1,148 (106%) | R+36.4 | +1.3 |
| Frontier ✓ | R+72.5 | R+52.5 | 1,077 | 1,121 (104%) | R+61.4 | −8.9 |
| Hitchcock ✓ | R+77.5 | R+57.4 | 1,014 | 1,071 (106%) | R+59.2 | −1.8 |
| Greeley ✓ | R+67.5 | R+47.4 | 1,011 | 1,010 (100%) | R+50.8 | −3.4 |
| Gosper ✓ | R+62.6 | R+42.6 | 834 | 901 (108%) | R+54.5 | −11.9 |
| Garden ✓ | R+70.1 | R+50.0 | 881 | 893 (101%) | R+58.5 | −8.5 |
| Boyd ✓ | R+74.6 | R+54.5 | 878 | 887 (101%) | R+65.3 | −10.8 |
| Garfield ✓ | R+76.2 | R+56.1 | 726 | 824 (113%) | R+65.8 | −9.7 |
| Deuel ✓ | R+68.0 | R+48.0 | 731 | 779 (107%) | R+59.8 | −11.9 |
| Rock ✓ | R+78.8 | R+58.7 | 585 | 715 (122%) | R+68.7 | −10.0 |
| Dundy | R+78.5 | R+58.4 | 753 | 683 (91%) | R+63.4 | −5.0 * |
| Sioux ✓ | R+76.2 | R+56.2 | 501 | 500 (100%) | R+63.8 | −7.6 |
| Keya Paha ✓ | R+83.4 | R+63.3 | 378 | 427 (113%) | R+76.3 | −13.1 |
| Wheeler ✓ | R+75.1 | R+55.0 | 280 | 391 (140%) | R+61.6 | −6.7 |
| Hayes ✓ | R+91.1 | R+71.1 | 387 | 384 (99%) | R+81.3 | −10.2 |
| Loup ✓ | R+65.3 | R+45.3 | 324 | 339 (105%) | R+57.2 | −12.0 |
| Hooker | R+73.2 | R+53.1 | 373 | 336 (90%) | R+61.6 | −8.5 * |
| Logan ✓ | R+86.9 | R+66.8 | 324 | 327 (101%) | R+76.8 | −10.0 |
| Thomas ✓ | R+77.0 | R+56.9 | 306 | 320 (105%) | R+64.7 | −7.8 |
| Banner | R+80.9 | R+60.9 | 365 | 314 (86%) | R+71.3 | −10.5 * |
| Grant ✓ | R+91.3 | R+71.2 | 279 | 285 (102%) | R+84.6 | −13.3 |
| Blaine ✓ | R+72.7 | R+52.6 | 204 | 236 (116%) | R+68.6 | −16.0 |
| McPherson ✓ | R+89.5 | R+69.4 | 221 | 230 (104%) | R+80.4 | −11.0 |
| Arthur | R+87.3 | R+67.2 | 244 | 226 (93%) | R+73.5 | −6.2 * |
Gap: + is better for the independent than we expected, − better for the Republican. ≡ compared method by method; * whole county, not yet complete (skewed by count order, left out of the race's read).
Nevada governor Aaron Ford v Joe Lombardo · our forecast D+1.1, 57% Democrat · totals only
| County | 2024 president | Expected tonight | Expected votes | Counted | Counted margin | Gap |
|---|---|---|---|---|---|---|
| Clark ✓ | D+2.7 | D+7.5 | 673,398 | 741,428 (110%) | D+18.2 | +10.8 |
| Washoe ✓ | D+1.0 | D+5.8 | 192,071 | 205,200 (107%) | D+11.5 | +5.7 |
| Douglas ✓ | R+33.4 | R+28.6 | 28,877 | 28,945 (100%) | R+33.2 | −4.6 |
| Carson City ✓ | R+11.5 | R+6.6 | 23,386 | 24,937 (107%) | R+3.2 | +3.4 |
| Lyon ✓ | R+45.0 | R+40.2 | 23,304 | 24,335 (104%) | R+33.6 | +6.6 |
| Nye ✓ | R+42.6 | R+37.8 | 20,433 | 20,902 (102%) | R+32.3 | +5.6 |
| Elko | R+57.4 | R+52.6 | 15,966 | 15,022 (94%) | R+41.6 | +11.0 * |
| Churchill ✓ | R+51.1 | R+46.2 | 9,727 | 9,642 (99%) | R+42.1 | +4.1 |
| Humboldt | R+56.1 | R+51.2 | 5,980 | 5,533 (93%) | R+43.1 | +8.2 * |
| White Pine | R+57.9 | R+53.1 | 3,387 | 3,068 (91%) | R+46.3 | +6.9 * |
| Storey | R+39.1 | R+34.3 | 2,508 | 2,224 (89%) | R+32.4 | +1.9 * |
| Lander | R+63.2 | R+58.4 | 2,154 | 1,996 (93%) | R+49.8 | +8.6 * |
| Lincoln | R+73.5 | R+68.7 | 2,095 | 1,943 (93%) | R+67.7 | +1.0 * |
| Pershing ✓ | R+55.7 | R+50.9 | 1,736 | 1,689 (97%) | R+47.8 | +3.1 |
| Mineral | R+36.2 | R+31.4 | 1,830 | 1,611 (88%) | R+21.5 | +9.9 * |
| Eureka ✓ | R+78.7 | R+73.9 | 764 | 770 (101%) | R+74.7 | −0.8 |
| Esmeralda | R+66.7 | R+61.8 | 431 | 391 (91%) | R+50.4 | +11.5 * |
Gap: + is better for the Democrat than we expected, − better for the Republican. ≡ compared method by method; * whole county, not yet complete (skewed by count order, left out of the race's read).
Vermont governor Amanda Janoo v Phil Scott · our forecast D+1.4, 58% Democrat · totals only
| County | 2024 president | Expected tonight | Expected votes | Counted | Counted margin | Gap |
|---|---|---|---|---|---|---|
| Chittenden ✓ | D+53.1 | D+22.7 | 76,146 | 84,113 (110%) | D+6.6 | −16.0 |
| Washington ✓ | D+43.0 | D+12.5 | 28,055 | 31,092 (111%) | D+1.1 | −11.4 |
| Windsor ✓ | D+35.3 | D+4.9 | 27,021 | 28,336 (105%) | R+2.1 | −7.0 |
| Rutland ✓ | D+5.2 | R+25.2 | 26,323 | 26,827 (102%) | R+31.1 | −5.9 |
| Windham ✓ | D+42.3 | D+11.9 | 20,009 | 21,420 (107%) | D+20.1 | +8.2 |
| Franklin ✓ | D+3.0 | R+27.5 | 19,762 | 21,315 (108%) | R+36.1 | −8.6 |
| Addison ✓ | D+35.6 | D+5.1 | 18,054 | 19,745 (109%) | R+2.7 | −7.8 |
| Bennington ✓ | D+22.4 | R+8.1 | 15,884 | 16,484 (104%) | R+6.6 | +1.5 |
| Orange ✓ | D+20.0 | R+10.4 | 13,917 | 14,890 (107%) | R+12.9 | −2.4 |
| Caledonia ✓ | D+12.3 | R+18.1 | 12,765 | 13,832 (108%) | R+20.1 | −1.9 |
| Lamoille ✓ | D+35.6 | D+5.1 | 11,530 | 12,506 (108%) | R+11.5 | −16.6 |
| Orleans ✓ | R+1.5 | R+32.0 | 10,708 | 11,605 (108%) | R+33.4 | −1.4 |
| Grand Isle ✓ | D+20.9 | R+9.5 | 3,960 | 4,278 (108%) | R+28.6 | −19.1 |
| Essex ✓ | R+15.9 | R+46.4 | 2,409 | 2,580 (107%) | R+44.3 | +2.1 |
Gap: + is better for the Democrat than we expected, − better for the Republican. ≡ compared method by method; * whole county, not yet complete (skewed by count order, left out of the race's read).
Georgia governor Keisha Lance Bottoms v Rick Jackson · our forecast D+1.8, 62% Democrat · count split by method
| How cast | Counted | Counted margin | Same method, expected | Gap |
|---|---|---|---|---|
| Early in person | 2,684,826 | D+16.8 | D+4.4 | +12.4 |
| 135,609 | D+26.5 | D+32.0 | −5.5 | |
| Election Day | 1,358,142 | R+9.2 | R+4.1 | −5.1 |
| Provisional | 655 | D+26.4 | D+17.9 | +8.5 |
| County | 2024 president | Expected tonight | Expected votes | Counted | Counted margin | Gap |
|---|---|---|---|---|---|---|
| Fulton ✓ | D+44.9 | D+47.8 | 419,884 | 456,186 (109%) | D+47.8 | +0.5 ≡ |
| Gwinnett ✓ | D+16.5 | D+19.5 | 299,482 | 343,946 (115%) | D+32.5 | +14.1 ≡ |
| Cobb ✓ | D+14.9 | D+17.8 | 312,215 | 336,220 (108%) | D+22.4 | +5.8 ≡ |
| DeKalb ✓ | D+64.8 | D+67.7 | 298,229 | 320,755 (108%) | D+69.6 | +2.9 ≡ |
| Cherokee ✓ | R+39.0 | R+36.0 | 120,374 | 126,945 (105%) | R+32.7 | +3.8 ≡ |
| Chatham ✓ | D+18.0 | D+21.0 | 106,329 | 111,516 (105%) | D+25.9 | +5.4 ≡ |
| Henry ✓ | D+29.7 | D+32.6 | 95,568 | 109,698 (115%) | D+46.4 | +14.5 ≡ |
| Forsyth ✓ | R+33.1 | R+30.1 | 102,446 | 107,132 (105%) | R+27.1 | +3.0 ≡ |
| Clayton ✓ | D+69.2 | D+72.2 | 84,136 | 95,858 (114%) | D+79.3 | +7.3 ≡ |
| Hall ✓ | R+43.8 | R+40.8 | 73,516 | 78,834 (107%) | R+32.4 | +7.8 ≡ |
| Paulding ✓ | R+24.1 | R+21.2 | 67,004 | 74,580 (111%) | R+9.1 | +12.4 ≡ |
| Columbia ✓ | R+25.6 | R+22.7 | 64,572 | 67,538 (105%) | R+17.2 | +6.2 ≡ |
| Coweta ✓ | R+33.9 | R+30.9 | 63,726 | 66,838 (105%) | R+26.0 | +5.5 ≡ |
| Richmond ✓ | D+36.1 | D+39.1 | 64,156 | 66,620 (104%) | D+45.2 | +7.1 ≡ |
| Houston ✓ | R+11.3 | R+8.3 | 59,210 | 64,924 (110%) | D+0.8 | +8.8 ≡ |
| Fayette ✓ | R+3.2 | R+0.2 | 60,346 | 62,278 (103%) | D+3.6 | +4.9 ≡ |
| Muscogee ✓ | D+23.4 | D+26.3 | 59,462 | 62,202 (105%) | D+33.2 | +8.0 ≡ |
| Douglas ✓ | D+31.5 | D+34.4 | 52,930 | 59,399 (112%) | D+46.9 | +13.1 ≡ |
| Bibb ✓ | D+22.4 | D+25.4 | 54,200 | 55,303 (102%) | D+30.5 | +5.6 ≡ |
| Newton ✓ | D+15.1 | D+18.1 | 42,876 | 47,853 (112%) | D+30.9 | +14.7 ≡ |
| Carroll ✓ | R+41.2 | R+38.2 | 43,727 | 44,982 (103%) | R+30.2 | +9.1 ≡ |
| Walton ✓ | R+45.9 | R+42.9 | 42,452 | 44,723 (105%) | R+36.8 | +6.5 ≡ |
| Clarke ✓ | D+38.3 | D+41.3 | 40,316 | 42,657 (106%) | D+47.6 | +7.3 ≡ |
| Bartow ✓ | R+51.0 | R+48.0 | 39,997 | 42,313 (106%) | R+39.3 | +9.2 ≡ |
| Rockdale ✓ | D+47.5 | D+50.5 | 34,908 | 38,801 (111%) | D+59.2 | +9.8 ≡ |
| Jackson ✓ | R+55.1 | R+52.1 | 31,881 | 35,978 (113%) | R+45.3 | +6.4 ≡ |
| Lowndes ✓ | R+18.0 | R+15.0 | 34,760 | 35,587 (102%) | R+6.7 | +8.5 ≡ |
| Glynn ✓ | R+26.0 | R+23.0 | 33,279 | 33,449 (101%) | R+21.9 | +1.0 ≡ |
| Barrow ✓ | R+40.5 | R+37.5 | 29,430 | 32,954 (112%) | R+24.4 | +13.1 ≡ |
| Floyd ✓ | R+42.0 | R+39.0 | 32,078 | 32,276 (101%) | R+31.0 | +8.9 ≡ |
| Whitfield ✓ | R+44.4 | R+41.5 | 27,014 | 29,875 (111%) | R+23.3 | +18.7 ≡ |
| Dougherty ✓ | D+41.1 | D+44.1 | 26,709 | 27,210 (102%) | D+48.0 | +4.5 ≡ |
| Spalding ✓ | R+16.7 | R+13.7 | 24,395 | 25,682 (105%) | R+4.9 | +8.9 ≡ |
| Effingham ✓ | R+49.1 | R+46.1 | 25,398 | 25,420 (100%) | R+38.1 | +8.6 ≡ |
| Bulloch ✓ | R+29.0 | R+26.0 | 23,591 | 24,604 (104%) | R+19.1 | +8.3 ≡ |
| Catoosa ✓ | R+55.5 | R+52.5 | 24,503 | 23,630 (96%) | R+48.4 | +4.6 ≡ |
| Troup ✓ | R+24.4 | R+21.4 | 23,256 | 23,206 (100%) | R+12.8 | +7.5 ≡ |
| Oconee ✓ | R+35.9 | R+33.0 | 22,478 | 22,678 (101%) | R+36.4 | −2.0 ≡ |
| Walker ✓ | R+59.3 | R+56.3 | 22,117 | 21,290 (96%) | R+52.3 | +4.3 ≡ |
| Camden ✓ | R+35.7 | R+32.7 | 17,945 | 18,984 (106%) | R+27.5 | +5.7 ≡ |
| Gordon ✓ | R+63.4 | R+60.5 | 18,907 | 18,920 (100%) | R+51.6 | +9.2 ≡ |
| Laurens ✓ | R+32.7 | R+29.7 | 18,550 | 18,120 (98%) | R+24.8 | +5.7 ≡ |
| Bryan ✓ | R+36.3 | R+33.4 | 17,006 | 17,993 (106%) | R+24.7 | +9.4 ≡ |
| Habersham ✓ | R+64.9 | R+61.9 | 16,990 | 17,447 (103%) | R+58.2 | +3.5 ≡ |
| Harris ✓ | R+46.1 | R+43.1 | 17,039 | 17,130 (101%) | R+39.7 | +4.2 ≡ |
| Liberty ✓ | D+17.4 | D+20.4 | 15,415 | 16,937 (110%) | D+32.7 | +13.6 ≡ |
| Thomas ✓ | R+24.1 | R+21.1 | 17,287 | 16,884 (98%) | R+18.5 | +1.8 ≡ |
| Pickens ✓ | R+65.8 | R+62.8 | 15,086 | 15,347 (102%) | R+62.9 | +1.2 ≡ |
| Baldwin ✓ | R+2.2 | D+0.8 | 15,002 | 15,085 (101%) | D+3.5 | +2.2 ≡ |
| Dawson ✓ | R+65.2 | R+62.2 | 13,978 | 14,436 (103%) | R+60.0 | +2.6 ≡ |
| Union ✓ | R+62.5 | R+59.5 | 14,312 | 14,278 (100%) | R+63.1 | −2.5 ≡ |
| Monroe ✓ | R+46.7 | R+43.7 | 13,718 | 14,118 (103%) | R+42.1 | +1.9 ≡ |
| Gilmer ✓ | R+62.6 | R+59.6 | 14,086 | 13,999 (99%) | R+58.2 | +2.6 ≡ |
| Tift ✓ | R+35.7 | R+32.7 | 13,044 | 13,322 (102%) | R+27.4 | +4.7 ≡ |
| Polk ✓ | R+60.5 | R+57.6 | 13,640 | 13,280 (97%) | R+50.1 | +7.1 ≡ |
| Lee ✓ | R+43.5 | R+40.6 | 13,587 | 13,275 (98%) | R+32.4 | +7.6 ≡ |
| Lumpkin ✓ | R+61.7 | R+58.7 | 12,737 | 12,929 (102%) | R+57.8 | +1.7 ≡ |
| White ✓ | R+68.5 | R+65.5 | 12,730 | 12,588 (99%) | R+66.2 | −0.1 ≡ |
| Madison ✓ | R+54.8 | R+51.8 | 12,554 | 12,487 (99%) | R+46.3 | +5.2 ≡ |
| Colquitt ✓ | R+50.2 | R+47.2 | 12,598 | 12,434 (99%) | R+39.1 | +8.7 ≡ |
| Jones ✓ | R+38.0 | R+35.1 | 12,312 | 11,977 (97%) | R+28.2 | +7.3 ≡ |
| Coffee ✓ | R+45.1 | R+42.2 | 11,905 | 11,863 (100%) | R+30.6 | +10.7 ≡ |
| Fannin | R+64.8 | R+61.8 | 12,637 | 11,609 (92%) | R+61.5 | +2.1 ≡ |
| Murray ✓ | R+71.6 | R+68.6 | 11,533 | 11,360 (98%) | R+60.8 | +7.1 ≡ |
| Haralson ✓ | R+74.4 | R+71.4 | 11,651 | 11,333 (97%) | R+70.5 | +1.3 ≡ |
| Greene ✓ | R+28.9 | R+26.0 | 10,508 | 11,177 (106%) | R+34.0 | −10.1 ≡ |
| Hart ✓ | R+54.8 | R+51.8 | 10,560 | 10,814 (102%) | R+49.0 | +2.6 ≡ |
| Peach ✓ | R+6.0 | R+3.1 | 10,039 | 10,654 (106%) | D+4.8 | +7.4 ≡ |
| Putnam ✓ | R+42.2 | R+39.3 | 10,237 | 10,633 (104%) | R+41.6 | −2.8 ≡ |
| Morgan ✓ | R+45.9 | R+43.0 | 10,326 | 10,521 (102%) | R+43.2 | +0.4 ≡ |
| Ware ✓ | R+43.2 | R+40.2 | 10,752 | 10,232 (95%) | R+35.8 | +6.1 ≡ |
| Wayne ✓ | R+59.8 | R+56.8 | 10,025 | 9,795 (98%) | R+51.1 | +5.7 ≡ |
| Upson ✓ | R+39.7 | R+36.8 | 10,135 | 9,793 (97%) | R+32.2 | +3.3 ≡ |
| Sumter ✓ | D+2.2 | D+5.2 | 9,605 | 9,615 (100%) | D+8.0 | +3.5 ≡ |
| Butts ✓ | R+45.2 | R+42.2 | 9,695 | 9,595 (99%) | R+35.8 | +5.5 ≡ |
| Stephens ✓ | R+62.8 | R+59.8 | 9,400 | 9,304 (99%) | R+56.9 | +2.2 ≡ |
| Pike ✓ | R+73.4 | R+70.5 | 9,431 | 9,111 (97%) | R+69.5 | +0.4 ≡ |
| Meriwether ✓ | R+25.5 | R+22.5 | 8,908 | 9,027 (101%) | R+20.2 | +1.1 ≡ |
| Burke ✓ | R+9.3 | R+6.4 | 8,467 | 8,679 (103%) | D+1.3 | +7.2 ≡ |
| Franklin ✓ | R+72.6 | R+69.6 | 8,739 | 8,505 (97%) | R+67.9 | +1.5 ≡ |
| Decatur ✓ | R+24.0 | R+21.0 | 8,883 | 8,494 (96%) | R+15.6 | +5.2 ≡ |
| McDuffie ✓ | R+24.9 | R+21.9 | 8,317 | 8,270 (99%) | R+16.1 | +4.7 ≡ |
| Grady ✓ | R+38.2 | R+35.2 | 8,341 | 8,014 (96%) | R+30.9 | +5.4 ≡ |
| Washington ✓ | R+1.9 | D+1.1 | 7,794 | 7,945 (102%) | D+1.7 | +0.9 ≡ |
| Lamar ✓ | R+45.9 | R+42.9 | 7,755 | 7,874 (102%) | R+38.0 | +3.6 ≡ |
| Toombs | R+50.7 | R+47.7 | 8,486 | 7,767 (92%) | R+40.9 | +5.6 ≡ |
| Rabun | R+56.9 | R+53.9 | 8,262 | 7,745 (94%) | R+53.5 | +0.8 ≡ |
| Emanuel ✓ | R+44.1 | R+41.2 | 7,562 | 7,328 (97%) | R+36.8 | +5.0 ≡ |
| Banks ✓ | R+78.2 | R+75.2 | 7,326 | 7,291 (100%) | R+72.5 | +2.0 ≡ |
| Towns ✓ | R+62.3 | R+59.3 | 7,180 | 7,122 (99%) | R+62.7 | −2.3 ≡ |
| Elbert ✓ | R+43.4 | R+40.4 | 7,324 | 7,079 (97%) | R+33.9 | +7.8 ≡ |
| Chattooga | R+64.2 | R+61.2 | 7,712 | 7,075 (92%) | R+56.0 | +5.8 ≡ |
| Pierce ✓ | R+77.5 | R+74.5 | 7,177 | 7,024 (98%) | R+73.9 | +0.2 ≡ |
| Jasper ✓ | R+58.4 | R+55.4 | 6,574 | 6,888 (105%) | R+53.5 | +2.4 ≡ |
| Oglethorpe ✓ | R+42.4 | R+39.4 | 6,811 | 6,834 (100%) | R+32.9 | +5.9 ≡ |
| Worth | R+50.4 | R+47.4 | 7,395 | 6,798 (92%) | R+44.0 | +4.6 ≡ |
| Mitchell ✓ | R+16.3 | R+13.4 | 7,052 | 6,721 (95%) | R+9.1 | +5.7 ≡ |
| Crisp ✓ | R+25.9 | R+23.0 | 6,322 | 6,322 (100%) | R+23.0 | −1.2 ≡ |
| Dodge | R+49.9 | R+46.9 | 6,630 | 6,266 (95%) | R+43.3 | +4.1 ≡ |
| Tattnall ✓ | R+53.4 | R+50.5 | 6,527 | 6,244 (96%) | R+45.8 | +4.8 ≡ |
| Appling | R+62.4 | R+59.4 | 6,703 | 6,194 (92%) | R+55.6 | +4.8 ≡ |
| Jefferson ✓ | R+1.2 | D+1.7 | 6,278 | 5,995 (95%) | D+4.5 | +2.5 ≡ |
| Berrien ✓ | R+69.8 | R+66.8 | 6,019 | 5,825 (97%) | R+63.2 | +3.0 ≡ |
| McIntosh ✓ | R+28.6 | R+25.6 | 5,517 | 5,704 (103%) | R+24.2 | +1.7 ≡ |
| Brantley | R+82.4 | R+79.5 | 5,859 | 5,498 (94%) | R+79.3 | +0.3 ≡ |
| Cook ✓ | R+46.5 | R+43.5 | 5,557 | 5,472 (98%) | R+36.3 | +4.5 ≡ |
| Brooks ✓ | R+26.8 | R+23.8 | 5,642 | 5,455 (97%) | R+19.2 | +5.7 ≡ |
| Dade | R+66.6 | R+63.6 | 5,844 | 5,383 (92%) | R+59.7 | +5.2 ≡ |
| Screven ✓ | R+25.2 | R+22.2 | 5,313 | 5,199 (98%) | R+18.4 | +4.0 ≡ |
| Long ✓ | R+29.5 | R+26.5 | 4,426 | 4,979 (112%) | R+8.7 | +19.1 ≡ |
| Ben Hill ✓ | R+32.0 | R+29.1 | 5,118 | 4,907 (96%) | R+20.5 | +7.0 ≡ |
| Crawford ✓ | R+49.8 | R+46.9 | 4,835 | 4,665 (96%) | R+43.1 | +5.5 ≡ |
| Bleckley ✓ | R+55.4 | R+52.4 | 4,805 | 4,652 (97%) | R+51.8 | −0.9 ≡ |
| Heard ✓ | R+72.1 | R+69.1 | 4,463 | 4,432 (99%) | R+66.7 | +2.6 ≡ |
| Jeff Davis | R+68.3 | R+65.3 | 4,543 | 4,168 (92%) | R+58.3 | +6.6 ≡ |
| Wilkes ✓ | R+16.8 | R+13.9 | 4,148 | 4,095 (99%) | R+9.5 | +4.7 ≡ |
| Lincoln ✓ | R+44.8 | R+41.8 | 3,982 | 3,861 (97%) | R+41.1 | −0.9 ≡ |
| Macon ✓ | D+17.9 | D+20.9 | 3,778 | 3,746 (99%) | D+22.1 | −1.4 ≡ |
| Wilkinson | R+17.8 | R+14.9 | 4,056 | 3,714 (92%) | R+9.0 | +8.3 ≡ |
| Early | R+11.5 | R+8.5 | 3,908 | 3,585 (92%) | R+7.2 | −0.3 ≡ |
| Bacon | R+73.2 | R+70.2 | 3,721 | 3,521 (95%) | R+68.5 | −1.0 ≡ |
| Terrell | D+4.1 | D+7.1 | 3,656 | 3,445 (94%) | D+7.1 | +0.7 ≡ |
| Hancock ✓ | D+35.4 | D+38.3 | 3,402 | 3,409 (100%) | D+37.8 | −0.1 ≡ |
| Candler ✓ | R+47.5 | R+44.5 | 3,562 | 3,396 (95%) | R+37.5 | +4.5 ≡ |
| Twiggs ✓ | R+14.7 | R+11.7 | 3,540 | 3,366 (95%) | R+3.3 | +9.8 ≡ |
| Pulaski ✓ | R+40.5 | R+37.5 | 3,374 | 3,341 (99%) | R+38.6 | −4.2 ≡ |
| Dooly ✓ | R+7.7 | R+4.7 | 3,286 | 3,308 (101%) | R+4.6 | −0.6 ≡ |
| Irwin ✓ | R+54.2 | R+51.2 | 3,418 | 3,290 (96%) | R+52.0 | −1.6 ≡ |
| Charlton | R+56.2 | R+53.2 | 3,405 | 3,223 (95%) | R+50.1 | +3.8 ≡ |
| Telfair | R+39.3 | R+36.3 | 3,413 | 3,167 (93%) | R+33.4 | +2.7 ≡ |
| Evans | R+42.3 | R+39.4 | 3,361 | 3,119 (93%) | R+37.2 | +1.1 ≡ |
| Johnson | R+46.4 | R+43.4 | 3,383 | 3,054 (90%) | R+42.4 | +1.4 ≡ |
| Taylor | R+31.0 | R+28.0 | 3,216 | 2,997 (93%) | R+25.5 | −0.9 ≡ |
| Turner ✓ | R+28.5 | R+25.5 | 3,099 | 2,974 (96%) | R+18.8 | +5.7 ≡ |
| Montgomery | R+53.0 | R+50.0 | 3,226 | 2,970 (92%) | R+45.8 | +4.7 ≡ |
| Seminole | R+40.4 | R+37.5 | 3,045 | 2,892 (95%) | R+35.1 | +1.9 ≡ |
| Marion ✓ | R+30.2 | R+27.3 | 2,846 | 2,771 (97%) | R+22.3 | +7.4 ≡ |
| Talbot ✓ | D+12.0 | D+15.0 | 2,864 | 2,729 (95%) | D+16.1 | +2.0 ≡ |
| Lanier ✓ | R+46.3 | R+43.4 | 2,638 | 2,659 (101%) | R+38.1 | +4.4 ≡ |
| Jenkins | R+30.4 | R+27.5 | 2,774 | 2,519 (91%) | R+23.4 | +2.3 ≡ |
| Wilcox | R+49.2 | R+46.2 | 2,621 | 2,476 (94%) | R+44.6 | +0.2 ≡ |
| Randolph | D+7.6 | D+10.6 | 2,565 | 2,360 (92%) | D+7.9 | −4.1 ≡ |
| Atkinson ✓ | R+54.0 | R+51.0 | 2,246 | 2,240 (100%) | R+38.2 | +11.3 ≡ |
| Treutlen | R+44.4 | R+41.4 | 2,449 | 2,238 (91%) | R+35.7 | +4.9 ≡ |
| Warren ✓ | D+4.7 | D+7.7 | 2,157 | 2,093 (97%) | D+9.5 | +0.1 ≡ |
| Clinch | R+51.5 | R+48.6 | 2,114 | 1,978 (94%) | R+47.5 | −0.3 ≡ |
| Miller | R+50.5 | R+47.5 | 2,164 | 1,966 (91%) | R+49.9 | −2.4 * |
| Wheeler ✓ | R+45.1 | R+42.1 | 1,826 | 1,800 (99%) | R+40.7 | +1.7 ≡ |
| Schley | R+62.5 | R+59.5 | 1,876 | 1,748 (93%) | R+58.9 | +0.3 ≡ |
| Calhoun ✓ | D+12.3 | D+15.3 | 1,715 | 1,633 (95%) | D+17.1 | −0.5 ≡ |
| Stewart | D+16.3 | D+19.2 | 1,573 | 1,439 (91%) | D+21.6 | +2.5 ≡ |
| Glascock | R+83.9 | R+80.9 | 1,305 | 1,217 (93%) | R+83.6 | −2.6 * |
| Baker | R+19.9 | R+16.9 | 1,258 | 1,140 (91%) | R+16.5 | +2.8 ≡ |
| Clay ✓ | D+7.5 | D+10.5 | 1,126 | 1,107 (98%) | D+11.7 | +1.7 ≡ |
| Chattahoochee ✓ | R+16.5 | R+13.5 | 1,020 | 1,087 (107%) | R+1.9 | +12.1 ≡ |
| Webster | R+18.4 | R+15.4 | 1,136 | 1,054 (93%) | R+15.7 | −3.1 ≡ |
| Echols | R+82.1 | R+79.1 | 1,065 | 945 (89%) | R+72.3 | +6.6 ≡ |
| Quitman ✓ | R+15.4 | R+12.5 | 906 | 872 (96%) | R+13.5 | −3.2 ≡ |
| Taliaferro ✓ | D+14.9 | D+17.9 | 807 | 804 (100%) | D+19.4 | +0.3 ≡ |
Gap: + is better for the Democrat than we expected, − better for the Republican. ≡ compared method by method; * whole county, not yet complete (skewed by count order, left out of the race's read). 1 smaller counties with no votes yet not shown.
South Carolina Senate Annie Andrews v Darline Graham · our forecast R+1.7, 62% Republican · totals only
| County | 2024 president | Expected tonight | Expected votes | Counted | Counted margin | Gap |
|---|---|---|---|---|---|---|
| Greenville ✓ | R+22.2 | R+6.5 | 176,990 | 215,533 (122%) | D+2.2 | +8.7 |
| Charleston ✓ | D+5.7 | D+21.4 | 152,799 | 175,121 (115%) | D+26.1 | +4.7 |
| Horry ✓ | R+38.5 | R+22.8 | 133,493 | 164,151 (123%) | R+21.5 | +1.3 |
| Richland ✓ | D+34.6 | D+50.3 | 127,016 | 161,725 (127%) | D+53.2 | +2.9 |
| Spartanburg ✓ | R+33.6 | R+17.9 | 96,625 | 119,644 (124%) | R+4.7 | +13.2 |
| York ✓ | R+19.1 | R+3.4 | 95,325 | 116,035 (122%) | D+3.5 | +6.9 |
| Lexington ✓ | R+33.5 | R+17.7 | 99,171 | 115,893 (117%) | R+7.7 | +10.0 |
| Berkeley ✓ | R+16.3 | R+0.6 | 71,374 | 90,990 (127%) | D+9.4 | +10.0 |
| Beaufort ✓ | R+14.5 | D+1.2 | 71,283 | 86,168 (121%) | R+2.7 | −4.0 |
| Anderson ✓ | R+47.4 | R+31.6 | 63,047 | 73,906 (117%) | R+23.4 | +8.2 |
| Aiken ✓ | R+25.9 | R+10.2 | 54,663 | 67,826 (124%) | R+4.5 | +5.7 |
| Dorchester ✓ | R+14.6 | D+1.1 | 49,782 | 62,281 (125%) | D+9.6 | +8.4 |
| Florence ✓ | R+8.0 | D+7.7 | 41,414 | 48,963 (118%) | D+14.7 | +7.0 |
| Pickens ✓ | R+52.7 | R+37.0 | 39,941 | 44,795 (112%) | R+29.3 | +7.7 |
| Lancaster ✓ | R+24.8 | R+9.0 | 34,412 | 42,803 (124%) | R+5.3 | +3.8 |
| Sumter ✓ | D+4.9 | D+20.6 | 30,651 | 36,466 (119%) | D+26.9 | +6.3 |
| Oconee ✓ | R+51.5 | R+35.8 | 28,903 | 32,493 (112%) | R+31.8 | +4.0 |
| Georgetown ✓ | R+19.5 | R+3.8 | 27,487 | 30,967 (113%) | R+3.8 | −0.0 |
| Orangeburg ✓ | D+24.6 | D+40.3 | 26,176 | 30,882 (118%) | D+43.9 | +3.6 |
| Kershaw ✓ | R+28.2 | R+12.5 | 22,386 | 25,905 (116%) | R+1.1 | +11.4 |
| Greenwood ✓ | R+29.0 | R+13.3 | 21,657 | 24,618 (114%) | R+5.2 | +8.1 |
| Darlington ✓ | R+13.3 | D+2.4 | 20,028 | 23,558 (118%) | D+9.7 | +7.3 |
| Laurens ✓ | R+40.8 | R+25.1 | 19,735 | 23,410 (119%) | R+16.3 | +8.9 |
| Cherokee ✓ | R+51.4 | R+35.6 | 16,071 | 17,648 (110%) | R+28.8 | +6.9 |
| Jasper ✓ | R+9.6 | D+6.1 | 11,118 | 17,426 (157%) | D+2.0 | −4.0 |
| Newberry ✓ | R+34.3 | R+18.6 | 12,821 | 14,398 (112%) | R+12.1 | +6.5 |
| Chesterfield ✓ | R+28.1 | R+12.4 | 12,555 | 13,822 (110%) | R+5.4 | +6.9 |
| Colleton ✓ | R+18.2 | R+2.5 | 12,544 | 13,717 (109%) | D+4.3 | +6.7 |
| Clarendon ✓ | R+12.3 | D+3.5 | 11,424 | 13,599 (119%) | D+5.6 | +2.1 |
| Chester ✓ | R+17.2 | R+1.5 | 9,583 | 12,049 (126%) | D+6.2 | +7.7 |
| Williamsburg ✓ | D+21.7 | D+37.4 | 9,780 | 11,700 (120%) | D+38.8 | +1.4 |
| Marion ✓ | D+10.5 | D+26.2 | 8,386 | 11,263 (134%) | D+27.1 | +0.8 |
| Edgefield ✓ | R+31.8 | R+16.1 | 8,787 | 10,821 (123%) | R+12.7 | +3.4 |
| Fairfield ✓ | D+13.2 | D+29.0 | 8,404 | 9,678 (115%) | D+28.0 | −0.9 |
| Union ✓ | R+32.7 | R+17.0 | 8,611 | 9,420 (109%) | R+11.3 | +5.7 |
| Abbeville ✓ | R+42.4 | R+26.7 | 8,592 | 9,026 (105%) | R+21.6 | +5.1 |
| Dillon ✓ | R+10.8 | D+4.9 | 7,898 | 8,820 (112%) | D+9.9 | +5.1 |
| Barnwell ✓ | R+15.5 | D+0.2 | 6,253 | 7,675 (123%) | D+3.8 | +3.6 |
| Marlboro ✓ | D+2.4 | D+18.1 | 6,524 | 7,221 (111%) | D+23.4 | +5.3 |
| Saluda ✓ | R+44.4 | R+28.6 | 6,556 | 7,023 (107%) | R+23.8 | +4.8 |
| Hampton ✓ | D+6.4 | D+22.1 | 5,622 | 6,657 (118%) | D+18.7 | −3.4 |
| Lee ✓ | D+17.7 | D+33.4 | 5,253 | 6,329 (120%) | D+36.5 | +3.1 |
| Calhoun ✓ | R+14.3 | D+1.4 | 5,608 | 5,893 (105%) | D+7.1 | +5.7 |
| McCormick ✓ | R+17.1 | R+1.4 | 4,553 | 5,470 (120%) | R+5.7 | −4.3 |
| Bamberg ✓ | D+15.3 | D+31.0 | 3,980 | 4,633 (116%) | D+32.3 | +1.3 |
| Allendale ✓ | D+44.7 | D+60.4 | 1,819 | 2,507 (138%) | D+56.6 | −3.8 |
Gap: + is better for the Democrat than we expected, − better for the Republican. ≡ compared method by method; * whole county, not yet complete (skewed by count order, left out of the race's read).
Texas governor Gina Hinojosa v Greg Abbott · our forecast R+2.4, 63% Republican · totals only
| County | 2024 president | Expected tonight | Expected votes | Counted | Counted margin | Gap |
|---|---|---|---|---|---|---|
| Harris ✓ | D+5.5 | D+16.6 | 1,097,892 | 1,383,128 (126%) | D+28.6 | +12.0 |
| Dallas ✓ | D+22.1 | D+33.2 | 623,883 | 784,122 (126%) | D+39.3 | +6.1 |
| Tarrant ✓ | R+5.1 | D+5.9 | 589,567 | 729,141 (124%) | D+14.2 | +8.3 |
| Bexar ✓ | D+9.7 | D+20.8 | 538,522 | 659,522 (122%) | D+31.0 | +10.2 |
| Travis ✓ | D+39.1 | D+50.2 | 461,264 | 548,591 (119%) | D+52.5 | +2.3 |
| Collin ✓ | R+11.1 | R+0.1 | 364,138 | 458,423 (126%) | D+4.5 | +4.5 |
| Denton ✓ | R+13.2 | R+2.1 | 317,007 | 396,672 (125%) | D+2.1 | +4.2 |
| Fort Bend ✓ | D+1.6 | D+12.6 | 249,051 | 331,449 (133%) | D+22.6 | +10.0 |
| Williamson ✓ | R+2.4 | D+8.6 | 225,064 | 279,139 (124%) | D+13.7 | +5.1 |
| Montgomery ✓ | R+45.5 | R+34.5 | 207,554 | 258,819 (125%) | R+26.7 | +7.8 |
| El Paso ✓ | D+15.1 | D+26.1 | 164,311 | 220,257 (134%) | D+42.2 | +16.0 |
| Hidalgo ✓ | R+2.9 | D+8.2 | 140,343 | 203,361 (145%) | D+42.0 | +33.9 |
| Brazoria ✓ | R+19.7 | R+8.7 | 109,618 | 141,901 (129%) | D+1.7 | +10.4 |
| Galveston ✓ | R+27.4 | R+16.4 | 110,374 | 134,628 (122%) | R+9.7 | +6.7 |
| Hays ✓ | D+5.6 | D+16.7 | 89,376 | 119,950 (134%) | D+26.9 | +10.3 |
| Bell ✓ | R+16.2 | R+5.2 | 87,631 | 110,831 (126%) | R+0.6 | +4.6 |
| Lubbock ✓ | R+39.6 | R+28.5 | 83,560 | 104,417 (125%) | R+20.5 | +8.1 |
| Cameron ✓ | R+5.8 | D+5.2 | 76,574 | 102,690 (134%) | D+34.6 | +29.3 |
| Nueces ✓ | R+11.5 | R+0.5 | 88,881 | 100,020 (113%) | D+6.8 | +7.3 |
| Comal ✓ | R+45.6 | R+34.5 | 74,602 | 89,286 (120%) | R+33.5 | +1.0 |
| Smith ✓ | R+45.0 | R+34.0 | 76,067 | 89,181 (117%) | R+29.0 | +5.0 |
| Ellis ✓ | R+31.0 | R+20.0 | 67,630 | 88,686 (131%) | R+8.3 | +11.7 |
| McLennan ✓ | R+30.9 | R+19.9 | 72,406 | 83,426 (115%) | R+14.1 | +5.7 |
| Brazos ✓ | R+24.9 | R+13.8 | 59,810 | 79,997 (134%) | D+0.7 | +14.6 |
| Parker ✓ | R+66.5 | R+55.4 | 63,355 | 76,264 (120%) | R+54.0 | +1.5 |
| Jefferson ✓ | R+8.9 | D+2.2 | 62,174 | 72,970 (117%) | D+9.1 | +6.9 |
| Guadalupe ✓ | R+29.5 | R+18.4 | 57,027 | 71,208 (125%) | R+10.0 | +8.4 |
| Johnson ✓ | R+51.4 | R+40.3 | 55,757 | 70,039 (126%) | R+30.7 | +9.7 |
| Kaufman ✓ | R+27.8 | R+16.8 | 42,702 | 62,342 (146%) | R+2.5 | +14.3 |
| Webb ✓ | R+2.1 | D+8.9 | 43,936 | 58,766 (134%) | D+39.6 | +30.7 |
| Grayson ✓ | R+54.2 | R+43.2 | 44,926 | 53,887 (120%) | R+41.4 | +1.8 |
| Rockwall ✓ | R+40.8 | R+29.7 | 42,790 | 53,642 (125%) | R+26.5 | +3.3 |
| Randall ✓ | R+60.4 | R+49.4 | 47,934 | 53,396 (111%) | R+45.2 | +4.2 |
| Midland ✓ | R+60.4 | R+49.4 | 39,957 | 44,161 (111%) | R+41.7 | +7.7 |
| Taylor ✓ | R+49.8 | R+38.8 | 39,292 | 42,729 (109%) | R+34.8 | +4.0 |
| Gregg ✓ | R+42.3 | R+31.2 | 33,139 | 38,102 (115%) | R+24.1 | +7.2 |
| Hunt ✓ | R+55.6 | R+44.5 | 30,484 | 37,612 (123%) | R+37.6 | +6.9 |
| Bastrop ✓ | R+18.3 | R+7.3 | 29,123 | 37,093 (127%) | D+5.4 | +12.7 |
| Tom Green ✓ | R+48.1 | R+37.0 | 31,742 | 36,245 (114%) | R+30.7 | +6.3 |
| Wichita ✓ | R+44.0 | R+33.0 | 31,518 | 34,560 (110%) | R+28.8 | +4.2 |
| Henderson ✓ | R+63.5 | R+52.4 | 27,966 | 31,211 (112%) | R+50.2 | +2.2 |
| Wise ✓ | R+70.1 | R+59.1 | 25,769 | 31,032 (120%) | R+55.1 | +4.0 |
| Hood ✓ | R+66.1 | R+55.1 | 27,196 | 30,330 (112%) | R+55.6 | −0.5 |
| Ector ✓ | R+52.9 | R+41.8 | 25,374 | 29,505 (116%) | R+22.9 | +19.0 |
| Victoria ✓ | R+42.6 | R+31.5 | 25,176 | 28,311 (112%) | R+27.3 | +4.3 |
| Bowie ✓ | R+48.7 | R+37.6 | 26,496 | 27,719 (105%) | R+35.7 | +2.0 |
| Angelina ✓ | R+52.0 | R+41.0 | 24,509 | 27,412 (112%) | R+34.4 | +6.6 |
| Orange ✓ | R+66.7 | R+55.7 | 25,060 | 26,444 (106%) | R+53.3 | +2.5 |
| Kendall ✓ | R+55.8 | R+44.7 | 22,460 | 26,159 (116%) | R+47.8 | −3.0 |
| Potter ✓ | R+44.5 | R+33.4 | 21,719 | 25,807 (119%) | R+23.8 | +9.6 |
| Liberty ✓ | R+61.7 | R+50.6 | 19,734 | 25,515 (129%) | R+30.4 | +20.2 |
| Burnet ✓ | R+55.8 | R+44.7 | 21,068 | 24,362 (116%) | R+43.7 | +1.1 |
| Harrison ✓ | R+50.6 | R+39.6 | 21,303 | 24,108 (113%) | R+37.7 | +1.9 |
| Waller ✓ | R+25.1 | R+14.0 | 16,664 | 23,748 (143%) | R+5.5 | +8.5 |
| Kerr ✓ | R+54.4 | R+43.4 | 22,427 | 23,507 (105%) | R+43.2 | +0.1 |
| Van Zandt ✓ | R+74.9 | R+63.9 | 20,533 | 22,236 (108%) | R+63.3 | +0.5 |
| Wilson ✓ | R+53.7 | R+42.7 | 19,415 | 22,049 (114%) | R+40.2 | +2.4 |
| Walker ✓ | R+40.0 | R+29.0 | 17,342 | 21,697 (125%) | R+22.8 | +6.2 |
| Nacogdoches ✓ | R+38.8 | R+27.8 | 18,926 | 21,569 (114%) | R+17.0 | +10.8 |
| Medina ✓ | R+42.8 | R+31.7 | 17,312 | 21,246 (123%) | R+25.4 | +6.3 |
| Hardin ✓ | R+75.9 | R+64.9 | 19,594 | 20,986 (107%) | R+64.2 | +0.6 |
| San Patricio ✓ | R+36.5 | R+25.4 | 17,818 | 20,155 (113%) | R+17.1 | +8.3 |
| Wood ✓ | R+69.8 | R+58.8 | 18,150 | 19,826 (109%) | R+62.9 | −4.1 |
| Chambers ✓ | R+65.7 | R+54.7 | 15,682 | 19,472 (124%) | R+48.3 | +6.3 |
| Coryell ✓ | R+40.7 | R+29.6 | 16,312 | 18,861 (116%) | R+24.9 | +4.7 |
| Polk ✓ | R+59.0 | R+47.9 | 16,743 | 17,546 (105%) | R+49.1 | −1.1 |
| Rusk ✓ | R+59.4 | R+48.4 | 15,572 | 17,406 (112%) | R+43.2 | +5.3 |
| Cooke ✓ | R+66.9 | R+55.9 | 15,293 | 17,218 (113%) | R+54.4 | +1.5 |
| Cherokee ✓ | R+62.8 | R+51.7 | 14,444 | 16,631 (115%) | R+47.4 | +4.4 |
| Lamar ✓ | R+61.0 | R+50.0 | 15,344 | 16,438 (107%) | R+47.0 | +3.0 |
| Navarro ✓ | R+51.8 | R+40.8 | 14,099 | 16,165 (115%) | R+32.2 | +8.5 |
| Washington ✓ | R+54.6 | R+43.6 | 13,949 | 15,536 (111%) | R+45.0 | −1.4 |
| Upshur ✓ | R+71.1 | R+60.1 | 14,254 | 15,531 (109%) | R+59.1 | +1.0 |
| Anderson ✓ | R+61.8 | R+50.8 | 14,415 | 15,344 (106%) | R+48.0 | +2.7 |
| Caldwell ✓ | R+14.4 | R+3.4 | 11,288 | 14,831 (131%) | D+11.4 | +14.8 |
| Gillespie ✓ | R+61.0 | R+49.9 | 13,366 | 14,634 (109%) | R+52.0 | −2.0 |
| Atascosa ✓ | R+43.3 | R+32.3 | 12,634 | 14,588 (115%) | R+19.3 | +13.0 |
| Erath ✓ | R+67.9 | R+56.9 | 13,077 | 14,167 (108%) | R+49.3 | +7.6 |
| Starr ✓ | R+16.0 | R+5.0 | 10,986 | 13,625 (124%) | D+48.9 | +53.8 |
| Hopkins ✓ | R+64.7 | R+53.6 | 12,324 | 13,327 (108%) | R+49.1 | +4.5 |
| Hill ✓ | R+64.4 | R+53.4 | 11,361 | 13,168 (116%) | R+49.5 | +3.9 |
| Fannin ✓ | R+67.4 | R+56.4 | 11,597 | 12,990 (112%) | R+55.2 | +1.3 |
| Brown ✓ | R+74.0 | R+63.0 | 12,254 | 12,989 (106%) | R+63.4 | −0.4 |
| Maverick ✓ | R+18.5 | R+7.5 | 9,483 | 12,934 (136%) | D+35.1 | +42.6 |
| Austin ✓ | R+62.6 | R+51.6 | 11,195 | 12,858 (115%) | R+49.1 | +2.5 |
| Wharton ✓ | R+51.9 | R+40.8 | 12,129 | 12,635 (104%) | R+37.2 | +3.6 |
| Jasper ✓ | R+66.6 | R+55.6 | 11,370 | 12,095 (106%) | R+56.0 | −0.5 |
| Val Verde ✓ | R+26.6 | R+15.6 | 9,417 | 11,786 (125%) | D+3.9 | +19.5 |
| Grimes ✓ | R+60.3 | R+49.3 | 9,413 | 11,733 (125%) | R+46.7 | +2.6 |
| Llano ✓ | R+60.9 | R+49.9 | 11,021 | 11,696 (106%) | R+55.7 | −5.8 |
| Fayette ✓ | R+61.3 | R+50.3 | 10,486 | 11,270 (107%) | R+50.0 | +0.3 |
| Matagorda ✓ | R+50.6 | R+39.6 | 9,695 | 10,945 (113%) | R+32.4 | +7.2 |
| Cass ✓ | R+65.8 | R+54.7 | 9,951 | 10,873 (109%) | R+58.3 | −3.6 |
| Jim Wells ✓ | R+15.5 | R+4.5 | 9,496 | 10,727 (113%) | D+10.0 | +14.5 |
| Aransas ✓ | R+55.8 | R+44.7 | 9,608 | 10,627 (111%) | R+47.9 | −3.1 |
| San Jacinto ✓ | R+65.4 | R+54.3 | 9,522 | 10,405 (109%) | R+53.2 | +1.2 |
| Palo Pinto ✓ | R+67.2 | R+56.2 | 9,467 | 10,402 (110%) | R+49.4 | +6.8 |
| Bandera ✓ | R+61.9 | R+50.9 | 10,456 | 10,246 (98%) | R+56.2 | −5.3 |
| Lampasas ✓ | R+59.5 | R+48.5 | 8,214 | 9,201 (112%) | R+49.6 | −1.1 |
| Titus ✓ | R+54.7 | R+43.7 | 7,308 | 8,756 (120%) | R+28.0 | +15.6 |
| Montague ✓ | R+77.8 | R+66.7 | 7,840 | 8,683 (111%) | R+69.5 | −2.8 |
| Milam ✓ | R+57.4 | R+46.4 | 8,340 | 8,643 (104%) | R+43.9 | +2.5 |
| Lavaca ✓ | R+76.1 | R+65.1 | 8,195 | 8,616 (105%) | R+67.9 | −2.8 |
| Panola ✓ | R+66.5 | R+55.5 | 8,298 | 8,580 (103%) | R+55.3 | +0.1 |
| Uvalde ✓ | R+33.4 | R+22.4 | 7,908 | 8,403 (106%) | R+7.0 | +15.4 |
| Colorado ✓ | R+57.2 | R+46.1 | 7,533 | 8,382 (111%) | R+46.4 | −0.3 |
| Kleberg ✓ | R+12.7 | R+1.6 | 7,592 | 8,224 (108%) | D+9.7 | +11.3 |
| Burleson ✓ | R+62.9 | R+51.9 | 6,702 | 7,813 (117%) | R+52.8 | −0.9 |
| Bosque ✓ | R+67.3 | R+56.3 | 7,443 | 7,759 (104%) | R+57.5 | −1.2 |
| Blanco ✓ | R+52.4 | R+41.4 | 6,757 | 7,599 (112%) | R+45.7 | −4.3 |
| Hale ✓ | R+58.0 | R+47.0 | 6,316 | 7,561 (120%) | R+33.3 | +13.7 |
| Shelby ✓ | R+64.7 | R+53.6 | 6,923 | 7,519 (109%) | R+50.2 | +3.4 |
| Houston ✓ | R+55.4 | R+44.3 | 7,172 | 7,484 (104%) | R+48.9 | −4.6 |
| Freestone ✓ | R+66.4 | R+55.4 | 6,647 | 7,337 (110%) | R+52.4 | +3.1 |
| Limestone ✓ | R+56.8 | R+45.8 | 6,822 | 7,283 (107%) | R+40.5 | +5.3 |
| Tyler ✓ | R+73.5 | R+62.5 | 7,228 | 7,260 (100%) | R+66.1 | −3.6 |
| Bee ✓ | R+39.9 | R+28.9 | 6,380 | 7,160 (112%) | R+17.5 | +11.4 |
| Leon ✓ | R+76.8 | R+65.8 | 6,837 | 7,086 (104%) | R+68.0 | −2.2 |
| Howard ✓ | R+62.9 | R+51.8 | 6,530 | 7,075 (108%) | R+44.5 | +7.4 |
| Robertson ✓ | R+52.1 | R+41.1 | 5,998 | 7,020 (117%) | R+37.7 | +3.3 |
| Lee ✓ | R+60.4 | R+49.4 | 6,266 | 6,954 (111%) | R+46.5 | +2.9 |
| Gonzales ✓ | R+54.8 | R+43.8 | 5,539 | 6,697 (121%) | R+34.3 | +9.4 |
| Young ✓ | R+76.3 | R+65.3 | 6,184 | 6,599 (107%) | R+63.9 | +1.4 |
| Hockley ✓ | R+66.4 | R+55.3 | 5,520 | 6,454 (117%) | R+47.1 | +8.2 |
| Calhoun ✓ | R+52.2 | R+41.2 | 5,574 | 6,357 (114%) | R+34.4 | +6.8 |
| Eastland ✓ | R+77.7 | R+66.7 | 6,143 | 6,353 (103%) | R+64.9 | +1.8 |
| Dewitt ✓ | R+67.1 | R+56.1 | 6,052 | 6,263 (103%) | R+57.0 | −0.9 |
| Hutchinson ✓ | R+77.3 | R+66.2 | 6,053 | 6,086 (101%) | R+64.1 | +2.1 |
| Trinity ✓ | R+67.1 | R+56.1 | 5,332 | 5,771 (108%) | R+56.7 | −0.6 |
| Gray ✓ | R+77.2 | R+66.2 | 5,539 | 5,511 (99%) | R+62.3 | +3.9 |
| Callahan ✓ | R+77.7 | R+66.6 | 5,251 | 5,392 (103%) | R+67.2 | −0.6 |
| Jones ✓ | R+73.1 | R+62.1 | 4,983 | 5,243 (105%) | R+59.1 | +3.0 |
| Comanche ✓ | R+74.1 | R+63.1 | 4,820 | 5,151 (107%) | R+59.8 | +3.3 |
| Rains ✓ | R+73.0 | R+62.0 | 4,976 | 5,094 (102%) | R+64.4 | −2.5 |
| Jackson ✓ | R+70.8 | R+59.8 | 4,590 | 5,038 (110%) | R+57.4 | +2.4 |
| Falls ✓ | R+44.8 | R+33.7 | 4,694 | 4,945 (105%) | R+32.7 | +1.0 |
| Gaines ✓ | R+82.8 | R+71.7 | 4,105 | 4,808 (117%) | R+65.2 | +6.5 |
| Willacy ✓ | R+3.3 | D+7.7 | 3,826 | 4,673 (122%) | D+28.4 | +20.7 |
| Clay ✓ | R+79.6 | R+68.6 | 4,481 | 4,647 (104%) | R+70.2 | −1.6 |
| Somervell ✓ | R+70.6 | R+59.5 | 4,032 | 4,317 (107%) | R+60.3 | −0.8 |
| Newton ✓ | R+66.7 | R+55.6 | 4,365 | 4,294 (98%) | R+58.6 | −3.0 |
| Madison ✓ | R+64.5 | R+53.4 | 3,903 | 4,292 (110%) | R+51.6 | +1.9 |
| Camp ✓ | R+53.6 | R+42.5 | 3,973 | 4,289 (108%) | R+37.4 | +5.2 |
| Sabine ✓ | R+78.6 | R+67.6 | 4,161 | 4,277 (103%) | R+71.9 | −4.3 |
| Franklin ✓ | R+69.0 | R+58.0 | 3,910 | 4,270 (109%) | R+59.6 | −1.7 |
| Red River ✓ | R+61.8 | R+50.8 | 4,266 | 4,239 (99%) | R+48.5 | +2.3 |
| Morris ✓ | R+51.1 | R+40.1 | 3,984 | 4,220 (106%) | R+40.3 | −0.2 |
| Scurry ✓ | R+73.6 | R+62.5 | 4,116 | 4,191 (102%) | R+60.6 | +1.9 |
| Andrews ✓ | R+72.7 | R+61.7 | 3,810 | 4,170 (109%) | R+47.1 | +14.6 |
| Moore ✓ | R+67.2 | R+56.2 | 3,589 | 4,131 (115%) | R+34.0 | +22.2 |
| Karnes ✓ | R+58.2 | R+47.2 | 3,808 | 4,050 (106%) | R+41.9 | +5.3 |
| Archer ✓ | R+79.5 | R+68.4 | 3,845 | 4,009 (104%) | R+71.1 | −2.7 |
| Live Oak ✓ | R+69.7 | R+58.7 | 3,993 | 3,868 (97%) | R+60.8 | −2.1 |
| Frio ✓ | R+24.6 | R+13.5 | 3,694 | 3,843 (104%) | D+4.9 | +18.5 |
| Marion ✓ | R+52.6 | R+41.6 | 3,292 | 3,830 (116%) | R+45.1 | −3.5 |
| Brewster ✓ | R+12.6 | R+1.6 | 3,745 | 3,820 (102%) | D+8.0 | +9.6 |
| Nolan ✓ | R+59.2 | R+48.2 | 3,783 | 3,745 (99%) | R+44.5 | +3.7 |
| Hamilton ✓ | R+71.2 | R+60.1 | 3,471 | 3,575 (103%) | R+63.4 | −3.3 |
| Deaf Smith ✓ | R+51.7 | R+40.7 | 2,931 | 3,544 (121%) | R+19.2 | +21.5 |
| Jack ✓ | R+82.4 | R+71.3 | 2,990 | 3,422 (114%) | R+68.9 | +2.5 |
| Wilbarger ✓ | R+60.7 | R+49.6 | 3,144 | 3,398 (108%) | R+47.2 | +2.4 |
| Pecos | R+44.9 | R+33.9 | 3,645 | 3,393 (93%) | R+16.2 | +17.7 * |
| Goliad ✓ | R+60.2 | R+49.2 | 3,357 | 3,377 (101%) | R+49.1 | +0.1 |
| Zapata ✓ | R+22.5 | R+11.4 | 3,421 | 3,354 (98%) | D+31.6 | +43.1 |
| Duval | R+10.0 | D+1.1 | 3,637 | 3,340 (92%) | D+28.2 | +27.2 * |
| Lamb ✓ | R+64.4 | R+53.4 | 3,069 | 3,300 (108%) | R+47.3 | +6.1 |
| Coleman ✓ | R+79.0 | R+67.9 | 3,230 | 3,248 (101%) | R+72.2 | −4.3 |
| Runnels ✓ | R+77.2 | R+66.2 | 3,230 | 3,193 (99%) | R+66.3 | −0.1 |
| Reeves ✓ | R+36.9 | R+25.9 | 2,158 | 3,148 (146%) | R+3.8 | +22.0 |
| Zavala ✓ | D+14.5 | D+25.5 | 2,426 | 3,121 (129%) | D+46.0 | +20.5 |
| San Augustine ✓ | R+56.3 | R+45.3 | 2,861 | 3,094 (108%) | R+44.1 | +1.2 |
| Stephens ✓ | R+79.3 | R+68.3 | 2,745 | 2,810 (102%) | R+65.7 | +2.6 |
| Dimmit ✓ | D+3.0 | D+14.0 | 2,855 | 2,714 (95%) | D+35.4 | +21.3 |
| McCulloch ✓ | R+73.5 | R+62.5 | 2,556 | 2,675 (105%) | R+62.1 | +0.4 |
| Terry ✓ | R+65.1 | R+54.1 | 2,571 | 2,631 (102%) | R+46.2 | +7.9 |
| Dawson ✓ | R+61.1 | R+50.1 | 2,507 | 2,578 (103%) | R+45.0 | +5.0 |
| Ward ✓ | R+66.2 | R+55.1 | 2,510 | 2,567 (102%) | R+45.3 | +9.9 |
| Refugio ✓ | R+39.6 | R+28.5 | 2,310 | 2,426 (105%) | R+27.9 | +0.7 |
| Carson ✓ | R+81.2 | R+70.2 | 2,391 | 2,397 (100%) | R+69.9 | +0.2 |
| Ochiltree ✓ | R+81.6 | R+70.6 | 2,121 | 2,336 (110%) | R+54.6 | +16.0 |
| San Saba ✓ | R+78.9 | R+67.9 | 2,163 | 2,193 (101%) | R+66.3 | +1.6 |
| Mason ✓ | R+65.0 | R+54.0 | 2,057 | 2,166 (105%) | R+56.1 | −2.1 |
| Mills ✓ | R+77.0 | R+66.0 | 2,115 | 2,144 (101%) | R+67.7 | −1.7 |
| Lynn ✓ | R+70.4 | R+59.4 | 1,717 | 2,124 (124%) | R+56.8 | +2.6 |
| Delta ✓ | R+69.8 | R+58.8 | 2,020 | 2,015 (100%) | R+58.1 | +0.7 |
| Parmer ✓ | R+70.2 | R+59.1 | 1,758 | 1,983 (113%) | R+46.6 | +12.5 |
| Kimble ✓ | R+77.7 | R+66.6 | 1,870 | 1,976 (106%) | R+67.8 | −1.1 |
| Presidio ✓ | D+30.3 | D+41.3 | 1,708 | 1,929 (113%) | D+53.9 | +12.6 |
| La Salle ✓ | R+20.5 | R+9.5 | 1,428 | 1,907 (134%) | D+5.9 | +15.4 |
| Mitchell ✓ | R+71.4 | R+60.4 | 1,776 | 1,869 (105%) | R+62.6 | −2.2 |
| Brooks | D+9.6 | D+20.7 | 1,998 | 1,825 (91%) | D+34.2 | +13.5 * |
| Yoakum ✓ | R+70.9 | R+59.9 | 1,631 | 1,780 (109%) | R+41.7 | +18.2 |
| Swisher ✓ | R+63.4 | R+52.4 | 1,656 | 1,718 (104%) | R+48.7 | +3.7 |
| Childress ✓ | R+76.1 | R+65.1 | 1,744 | 1,697 (97%) | R+61.2 | +3.8 |
| Wheeler ✓ | R+84.7 | R+73.7 | 1,685 | 1,688 (100%) | R+71.4 | +2.3 |
| Floyd ✓ | R+65.0 | R+54.0 | 1,464 | 1,637 (112%) | R+44.4 | +9.6 |
| Haskell ✓ | R+71.6 | R+60.5 | 1,665 | 1,626 (98%) | R+60.6 | −0.1 |
| Castro ✓ | R+58.2 | R+47.2 | 1,482 | 1,550 (105%) | R+43.0 | +4.2 |
| Hartley ✓ | R+83.5 | R+72.4 | 1,571 | 1,546 (98%) | R+70.2 | +2.2 |
| Hansford ✓ | R+85.0 | R+73.9 | 1,517 | 1,508 (99%) | R+64.7 | +9.2 |
| Real ✓ | R+66.9 | R+55.9 | 1,564 | 1,500 (96%) | R+60.9 | −5.0 |
| Crosby ✓ | R+51.4 | R+40.4 | 1,251 | 1,492 (119%) | R+32.2 | +8.1 |
| Martin ✓ | R+75.8 | R+64.7 | 1,502 | 1,475 (98%) | R+58.8 | +5.9 |
| Bailey ✓ | R+61.2 | R+50.1 | 1,327 | 1,422 (107%) | R+38.3 | +11.9 |
| Fisher ✓ | R+63.2 | R+52.2 | 1,396 | 1,421 (102%) | R+54.3 | −2.2 |
| Jim Hogg | D+8.3 | D+19.3 | 1,532 | 1,372 (90%) | D+44.8 | +25.5 * |
| Coke ✓ | R+79.7 | R+68.7 | 1,385 | 1,354 (98%) | R+69.6 | −0.9 |
| Winkler ✓ | R+70.6 | R+59.6 | 1,317 | 1,347 (102%) | R+44.9 | +14.7 |
| Shackelford ✓ | R+82.2 | R+71.2 | 1,237 | 1,286 (104%) | R+74.7 | −3.5 |
| Donley ✓ | R+78.2 | R+67.2 | 1,188 | 1,277 (107%) | R+70.8 | −3.6 |
| Kinney ✓ | R+50.5 | R+39.5 | 1,183 | 1,250 (106%) | R+32.5 | +7.0 |
| Hemphill | R+75.8 | R+64.8 | 1,356 | 1,246 (92%) | R+56.8 | +8.0 * |
| Baylor | R+77.0 | R+66.0 | 1,305 | 1,208 (93%) | R+68.4 | −2.4 * |
| Garza ✓ | R+72.6 | R+61.5 | 1,199 | 1,164 (97%) | R+57.0 | +4.6 |
| Sutton ✓ | R+67.1 | R+56.1 | 1,156 | 1,101 (95%) | R+51.0 | +5.0 |
| Dallam ✓ | R+78.4 | R+67.4 | 1,045 | 1,024 (98%) | R+52.8 | +14.5 |
| Jeff Davis ✓ | R+21.3 | R+10.3 | 1,046 | 1,022 (98%) | R+10.3 | +0.0 |
| Crane | R+72.7 | R+61.7 | 1,141 | 1,013 (89%) | R+45.7 | +16.0 * |
| Knox ✓ | R+68.6 | R+57.5 | 1,034 | 1,009 (98%) | R+51.3 | +6.2 |
| Concho ✓ | R+74.0 | R+63.0 | 939 | 1,000 (106%) | R+61.6 | +1.4 |
| Crockett | R+53.9 | R+42.8 | 1,259 | 1,000 (79%) | R+33.9 | +8.9 * |
| Hardeman ✓ | R+72.8 | R+61.8 | 983 | 977 (99%) | R+61.0 | +0.8 |
| Collingsworth ✓ | R+77.6 | R+66.6 | 925 | 965 (104%) | R+68.9 | −2.3 |
| Lipscomb ✓ | R+79.7 | R+68.7 | 975 | 935 (96%) | R+70.4 | −1.7 |
| Schleicher | R+64.6 | R+53.5 | 1,001 | 923 (92%) | R+47.3 | +6.2 * |
| Culberson ✓ | R+16.9 | R+5.9 | 725 | 891 (123%) | D+16.0 | +21.9 |
| Armstrong ✓ | R+85.6 | R+74.6 | 900 | 873 (97%) | R+77.7 | −3.1 |
| Upton | R+77.1 | R+66.1 | 1,042 | 871 (84%) | R+56.3 | +9.8 * |
| Hall | R+73.4 | R+62.4 | 876 | 830 (95%) | R+60.7 | +1.7 * |
| Edwards ✓ | R+73.3 | R+62.3 | 814 | 815 (100%) | R+61.1 | +1.2 |
| Hudspeth | R+46.1 | R+35.1 | 860 | 812 (94%) | R+20.6 | +14.5 * |
| Menard ✓ | R+66.5 | R+55.5 | 774 | 790 (102%) | R+53.7 | +1.8 |
| Dickens ✓ | R+70.4 | R+59.3 | 790 | 753 (95%) | R+62.4 | −3.1 |
| Oldham ✓ | R+84.4 | R+73.3 | 767 | 748 (98%) | R+73.5 | −0.2 |
| Sherman ✓ | R+83.3 | R+72.2 | 707 | 710 (100%) | R+62.8 | +9.4 |
| Cochran ✓ | R+65.8 | R+54.8 | 614 | 701 (114%) | R+40.4 | +14.4 |
| Reagan ✓ | R+69.5 | R+58.5 | 710 | 700 (99%) | R+40.4 | +18.1 |
| Irion | R+75.7 | R+64.6 | 695 | 645 (93%) | R+69.1 | −4.5 * |
| Throckmorton | R+83.4 | R+72.4 | 667 | 627 (94%) | R+70.5 | +1.9 * |
| Briscoe ✓ | R+79.8 | R+68.8 | 590 | 597 (101%) | R+69.8 | −1.0 |
| Glasscock ✓ | R+88.4 | R+77.3 | 571 | 559 (98%) | R+80.9 | −3.5 |
| Cottle ✓ | R+72.6 | R+61.5 | 514 | 542 (105%) | R+62.5 | −1.0 |
| Stonewall | R+69.5 | R+58.5 | 564 | 515 (91%) | R+59.0 | −0.5 * |
| Motley ✓ | R+88.9 | R+77.9 | 505 | 513 (102%) | R+83.2 | −5.4 |
| Roberts ✓ | R+92.3 | R+81.3 | 443 | 455 (103%) | R+89.2 | −8.0 |
| Sterling ✓ | R+86.0 | R+75.0 | 446 | 451 (101%) | R+66.7 | +8.2 |
| Foard | R+65.4 | R+54.4 | 527 | 411 (78%) | R+56.7 | −2.3 * |
| McMullen ✓ | R+84.6 | R+73.5 | 372 | 381 (102%) | R+70.9 | +2.7 |
| Kent ✓ | R+76.4 | R+65.4 | 348 | 377 (108%) | R+62.3 | +3.0 |
| Terrell | R+55.2 | R+44.2 | 426 | 347 (81%) | R+46.7 | −2.5 * |
| Borden ✓ | R+91.7 | R+80.7 | 317 | 308 (97%) | R+87.7 | −7.0 |
| Kenedy ✓ | R+46.8 | R+35.8 | 152 | 159 (105%) | R+17.6 | +18.2 |
| King ✓ | R+91.1 | R+80.1 | 103 | 118 (115%) | R+86.4 | −6.4 |
| Loving | R+78.4 | R+67.3 | 77 | 68 (88%) | R+69.1 | −1.8 * |
Gap: + is better for the Democrat than we expected, − better for the Republican. ≡ compared method by method; * whole county, not yet complete (skewed by count order, left out of the race's read).
Iowa Senate Josh Turek v Ashley Hinson · our forecast D+2.4, 64% Democrat · count split by method
No votes counted yet. The benchmarks below are what each county should show if our forecast of D+2.4 is right; once votes come in, each method is compared with the same method in 2024.
| County | 2024 president | Expected tonight | Expected votes | Counted | Counted margin | Gap |
|---|---|---|---|---|---|---|
| Polk | D+10.8 | D+26.4 | 190,822 | – | – | – |
| Linn | D+9.9 | D+25.4 | 93,559 | – | – | – |
| Scott | R+3.9 | D+11.7 | 63,707 | – | – | – |
| Johnson | D+37.8 | D+53.4 | 63,661 | – | – | – |
| Black Hawk | D+1.2 | D+16.7 | 47,169 | – | – | – |
| Dallas | R+4.7 | D+10.8 | 44,572 | – | – | – |
| Dubuque | R+8.6 | D+7.0 | 38,808 | – | – | – |
| Story | D+10.3 | D+25.8 | 36,942 | – | – | – |
| Pottawattamie | R+19.9 | R+4.4 | 29,060 | – | – | – |
| Woodbury | R+22.9 | R+7.3 | 28,626 | – | – | – |
| Warren | R+20.6 | R+5.1 | 23,818 | – | – | – |
| Cerro Gordo | R+11.6 | D+3.9 | 17,092 | – | – | – |
| Clinton | R+18.8 | R+3.3 | 16,887 | – | – | – |
| Jasper | R+27.5 | R+12.0 | 15,008 | – | – | – |
| Marion | R+37.6 | R+22.1 | 14,358 | – | – | – |
Gap: + is better for the Democrat than we expected, − better for the Republican. ≡ compared method by method; * whole county, not yet complete (skewed by count order, left out of the race's read). 84 smaller counties with no votes yet not shown.
Florida governor David Jolly v Byron Donalds · our forecast R+2.9, 68% Republican · totals only
| County | 2024 president | Expected tonight | Expected votes | Counted | Counted margin | Gap |
|---|---|---|---|---|---|---|
| Miami-Dade ✓ | R+11.5 | R+0.9 | 716,322 | 785,055 (110%) | D+7.0 | +8.0 |
| Broward ✓ | D+17.0 | D+27.5 | 600,976 | 661,359 (110%) | D+32.1 | +4.6 |
| Palm Beach ✓ | D+0.8 | D+11.3 | 545,550 | 572,058 (105%) | D+12.3 | +1.0 |
| Hillsborough ✓ | R+3.1 | D+7.5 | 484,916 | 516,277 (106%) | D+11.6 | +4.2 |
| Orange ✓ | D+13.6 | D+24.1 | 408,617 | 471,241 (115%) | D+29.5 | +5.4 |
| Pinellas ✓ | R+5.2 | D+5.3 | 424,549 | 403,433 (95%) | D+4.6 | −0.7 |
| Duval ✓ | R+1.5 | D+9.0 | 330,303 | 355,356 (108%) | D+10.8 | +1.7 |
| Lee ✓ | R+28.4 | R+17.9 | 276,081 | 303,772 (110%) | R+21.5 | −3.6 |
| Brevard ✓ | R+20.8 | R+10.3 | 268,335 | 269,326 (100%) | R+11.1 | −0.8 |
| Polk ✓ | R+20.7 | R+10.2 | 230,726 | 256,942 (111%) | R+5.0 | +5.2 |
| Pasco ✓ | R+25.2 | R+14.7 | 225,549 | 239,492 (106%) | R+12.2 | +2.5 |
| Volusia ✓ | R+21.8 | R+11.3 | 226,962 | 236,391 (104%) | R+12.5 | −1.2 |
| Sarasota ✓ | R+18.2 | R+7.7 | 219,514 | 223,249 (102%) | R+13.0 | −5.3 |
| Seminole ✓ | R+3.6 | D+7.0 | 183,816 | 195,283 (106%) | D+9.6 | +2.6 |
| Manatee ✓ | R+23.5 | R+13.0 | 172,183 | 181,989 (106%) | R+16.5 | −3.5 |
| Lake ✓ | R+24.7 | R+14.2 | 160,572 | 177,629 (111%) | R+15.7 | −1.6 |
| Collier ✓ | R+33.0 | R+22.5 | 164,265 | 171,748 (105%) | R+27.3 | −4.8 |
| Marion ✓ | R+31.7 | R+21.2 | 156,427 | 163,507 (105%) | R+24.2 | −3.0 |
| St. Johns ✓ | R+31.3 | R+20.8 | 145,011 | 155,851 (107%) | R+23.6 | −2.8 |
| St. Lucie ✓ | R+9.1 | D+1.4 | 122,361 | 138,985 (114%) | D+3.0 | +1.5 |
| Osceola ✓ | R+1.5 | D+9.1 | 103,173 | 131,545 (127%) | D+17.8 | +8.7 |
| Leon ✓ | D+21.7 | D+32.2 | 118,216 | 125,528 (106%) | D+35.1 | +2.9 |
| Escambia ✓ | R+19.5 | R+9.0 | 116,090 | 116,144 (100%) | R+9.6 | −0.6 |
| Alachua ✓ | D+20.9 | D+31.5 | 96,195 | 105,388 (110%) | D+33.3 | +1.8 |
| Charlotte ✓ | R+34.0 | R+23.5 | 92,933 | 100,373 (108%) | R+33.4 | −9.9 |
| Sumter ✓ | R+37.6 | R+27.1 | 89,668 | 94,997 (106%) | R+39.9 | −12.8 |
| Clay ✓ | R+39.3 | R+28.7 | 90,333 | 92,855 (103%) | R+29.1 | −0.3 |
| Hernando ✓ | R+37.1 | R+26.6 | 80,598 | 79,895 (99%) | R+26.9 | −0.3 |
| Indian River ✓ | R+27.3 | R+16.8 | 77,624 | 77,389 (100%) | R+20.6 | −3.8 |
| Okaloosa ✓ | R+42.4 | R+31.9 | 81,166 | 77,338 (95%) | R+34.7 | −2.9 |
| Martin ✓ | R+31.1 | R+20.6 | 77,907 | 76,147 (98%) | R+23.2 | −2.7 |
| Citrus ✓ | R+45.9 | R+35.4 | 75,985 | 74,905 (99%) | R+40.3 | −4.9 |
| Santa Rosa ✓ | R+50.9 | R+40.4 | 75,855 | 74,287 (98%) | R+42.6 | −2.2 |
| Bay ✓ | R+47.3 | R+36.8 | 67,243 | 70,092 (104%) | R+39.6 | −2.7 |
| Flagler ✓ | R+28.3 | R+17.8 | 58,886 | 63,831 (108%) | R+22.8 | −5.0 |
| Nassau ✓ | R+46.9 | R+36.4 | 47,891 | 50,372 (105%) | R+39.2 | −2.8 |
| Highlands ✓ | R+40.8 | R+30.3 | 39,922 | 39,642 (99%) | R+32.7 | −2.4 |
| Walton ✓ | R+57.8 | R+47.3 | 34,975 | 35,115 (100%) | R+52.7 | −5.4 |
| Monroe | R+18.3 | R+7.8 | 34,116 | 32,244 (95%) | R+7.5 | +0.3 * |
| Putnam ✓ | R+47.9 | R+37.4 | 26,656 | 26,388 (99%) | R+37.7 | −0.4 |
| Columbia ✓ | R+50.2 | R+39.7 | 23,769 | 22,885 (96%) | R+40.4 | −0.7 |
| Levy ✓ | R+50.3 | R+39.8 | 17,954 | 18,057 (101%) | R+43.6 | −3.8 |
| Gadsden ✓ | D+30.7 | D+41.2 | 17,463 | 17,774 (102%) | D+38.7 | −2.5 |
| Suwannee ✓ | R+61.0 | R+50.5 | 16,400 | 15,765 (96%) | R+52.7 | −2.2 |
| Jackson ✓ | R+46.1 | R+35.6 | 16,355 | 15,570 (95%) | R+37.5 | −1.9 |
| Wakulla ✓ | R+44.4 | R+33.9 | 15,113 | 15,056 (100%) | R+31.3 | +2.6 |
| Okeechobee ✓ | R+53.9 | R+43.4 | 10,934 | 11,091 (101%) | R+38.2 | +5.2 |
| Hendry ✓ | R+38.4 | R+27.9 | 8,293 | 10,044 (121%) | R+11.9 | +15.9 |
| Baker | R+73.2 | R+62.7 | 10,736 | 9,739 (91%) | R+65.1 | −2.4 * |
| Bradford | R+57.4 | R+46.9 | 10,290 | 9,640 (94%) | R+48.4 | −1.6 * |
| Desoto ✓ | R+43.0 | R+32.5 | 8,714 | 9,062 (104%) | R+27.5 | +5.0 |
| Washington ✓ | R+65.4 | R+54.9 | 9,147 | 9,004 (98%) | R+58.6 | −3.6 |
| Gilchrist ✓ | R+68.0 | R+57.5 | 7,889 | 7,746 (98%) | R+61.7 | −4.2 |
| Madison ✓ | R+28.9 | R+18.4 | 7,020 | 6,965 (99%) | R+22.1 | −3.7 |
| Jefferson ✓ | R+18.6 | R+8.1 | 7,152 | 6,942 (97%) | R+12.4 | −4.3 |
| Taylor | R+59.7 | R+49.2 | 7,645 | 6,940 (91%) | R+50.5 | −1.3 * |
| Gulf ✓ | R+54.2 | R+43.7 | 6,438 | 6,698 (104%) | R+53.7 | −10.0 |
| Holmes | R+80.4 | R+69.9 | 6,790 | 6,157 (91%) | R+73.3 | −3.4 * |
| Hardee ✓ | R+56.4 | R+45.9 | 5,552 | 6,003 (108%) | R+33.8 | +12.1 |
| Dixie | R+70.5 | R+60.0 | 6,193 | 5,557 (90%) | R+64.7 | −4.6 * |
| Franklin | R+43.8 | R+33.3 | 5,465 | 5,030 (92%) | R+35.3 | −2.0 * |
| Calhoun | R+67.7 | R+57.2 | 4,868 | 4,272 (88%) | R+59.5 | −2.3 * |
| Union | R+68.4 | R+57.8 | 4,567 | 4,260 (93%) | R+60.6 | −2.7 * |
| Hamilton ✓ | R+39.0 | R+28.5 | 4,320 | 4,113 (95%) | R+30.3 | −1.8 |
| Glades ✓ | R+53.3 | R+42.7 | 3,839 | 3,784 (99%) | R+40.6 | +2.2 |
| Liberty ✓ | R+67.0 | R+56.4 | 2,622 | 2,625 (100%) | R+59.1 | −2.7 |
| Lafayette | R+76.1 | R+65.6 | 2,921 | 2,597 (89%) | R+66.5 | −0.9 * |
Gap: + is better for the Democrat than we expected, − better for the Republican. ≡ compared method by method; * whole county, not yet complete (skewed by count order, left out of the race's read).
Alaska governor Jonathan Kreiss-Tomkins v Dave Bronson · our forecast D+2.8, 69% Democrat · totals only
| County | 2024 president | Expected tonight | Expected votes | Counted | Counted margin | Gap |
|---|---|---|---|---|---|---|
| House District 6 | R+16.8 | R+0.2 | 8,623 | 7,777 (90%) | D+37.4 | +37.6 * |
| House District 9 | D+2.3 | D+19.0 | 8,587 | 7,548 (88%) | D+36.8 | +17.8 * |
| House District 25 ✓ | R+37.0 | R+20.3 | 7,560 | 7,453 (99%) | D+22.0 | +42.3 |
| House District 8 | R+51.1 | R+34.4 | 7,908 | 6,945 (88%) | D+11.5 | +46.0 * |
| House District 35 ✓ | D+5.3 | D+21.9 | 6,972 | 6,858 (98%) | D+47.3 | +25.4 |
| House District 23 | R+19.4 | R+2.8 | 7,676 | 6,775 (88%) | D+29.7 | +32.6 * |
| House District 24 | R+33.4 | R+16.8 | 7,299 | 6,629 (91%) | D+22.2 | +39.0 * |
| House District 29 | R+46.5 | R+29.9 | 7,607 | 6,599 (87%) | D+17.5 | +47.4 * |
| House District 26 ✓ | R+56.0 | R+39.4 | 6,879 | 6,543 (95%) | D+13.6 | +53.0 |
| House District 34 | R+21.6 | R+5.0 | 7,208 | 6,493 (90%) | D+31.7 | +36.7 * |
| House District 7 | R+45.9 | R+29.3 | 6,979 | 6,372 (91%) | D+16.8 | +46.1 * |
| House District 11 | R+2.4 | D+14.2 | 7,135 | 6,214 (87%) | D+34.1 | +19.9 * |
| House District 16 | D+15.3 | D+31.9 | 6,967 | 6,212 (89%) | D+50.1 | +18.3 * |
| House District 3 | D+15.4 | D+32.0 | 7,983 | 6,174 (77%) | D+56.1 | +24.1 * |
| House District 28 | R+50.4 | R+33.8 | 6,706 | 6,150 (92%) | D+16.6 | +50.4 * |
| House District 21 | D+8.4 | D+25.0 | 6,532 | 6,128 (94%) | D+43.6 | +18.6 * |
| House District 15 | R+2.6 | D+14.1 | 6,730 | 6,117 (91%) | D+38.6 | +24.6 * |
| House District 33 | R+52.9 | R+36.3 | 6,434 | 5,893 (92%) | D+7.2 | +43.5 * |
| House District 36 | R+22.8 | R+6.2 | 6,890 | 5,875 (85%) | D+32.4 | +38.6 * |
| House District 10 | R+3.4 | D+13.2 | 6,331 | 5,756 (91%) | D+38.5 | +25.3 * |
| House District 27 | R+57.9 | R+41.3 | 6,455 | 5,690 (88%) | D+11.7 | +53.0 * |
| House District 4 | D+39.2 | D+55.8 | 6,650 | 5,682 (85%) | D+72.9 | +17.1 * |
| House District 30 | R+46.1 | R+29.4 | 7,522 | 5,468 (73%) | D+14.1 | +43.5 * |
| House District 12 | D+1.3 | D+18.0 | 6,181 | 5,213 (84%) | D+41.9 | +24.0 * |
| House District 17 | D+34.9 | D+51.5 | 5,557 | 4,966 (89%) | D+63.8 | +12.3 * |
| House District 13 | D+1.3 | D+17.9 | 5,462 | 4,660 (85%) | D+42.6 | +24.7 * |
| House District 1 | R+18.2 | R+1.5 | 6,181 | 4,591 (74%) | D+31.4 | +33.0 * |
| House District 31 | R+3.5 | D+13.1 | 5,045 | 4,501 (89%) | D+41.1 | +27.9 * |
| House District 20 | D+12.7 | D+29.3 | 5,233 | 4,500 (86%) | D+50.8 | +21.5 * |
| House District 14 | D+22.2 | D+38.8 | 5,345 | 4,498 (84%) | D+54.3 | +15.5 * |
| House District 2 | D+0.4 | D+17.0 | 6,840 | 4,322 (63%) | D+51.6 | +34.6 * |
| House District 5 | R+13.3 | D+3.3 | 5,769 | 3,886 (67%) | D+36.5 | +33.2 * |
| House District 22 | D+1.3 | D+17.9 | 3,947 | 3,533 (90%) | D+46.1 | +28.2 * |
| House District 39 ✓ | D+12.7 | D+29.3 | 2,907 | 3,370 (116%) | D+45.9 | +16.6 |
| House District 19 | D+17.8 | D+34.4 | 3,603 | 3,236 (90%) | D+53.8 | +19.4 * |
| House District 32 | R+33.0 | R+16.4 | 4,226 | 3,109 (74%) | D+28.8 | +45.2 * |
| House District 37 | R+7.0 | D+9.7 | 3,102 | 2,837 (91%) | D+38.9 | +29.3 * |
| House District 38 ✓ | D+13.1 | D+29.7 | 2,694 | 2,708 (101%) | D+51.1 | +21.3 |
| House District 40 ✓ | R+10.7 | D+5.9 | 2,291 | 2,452 (107%) | D+38.1 | +32.2 |
| House District 18 | R+16.4 | D+0.2 | 3,466 | 1,604 (46%) | D+43.2 | +43.0 * |
Gap: + is better for the Democrat than we expected, − better for the Republican. ≡ compared method by method; * whole county, not yet complete (skewed by count order, left out of the race's read).
Kansas Senate Adam Hamilton v Roger Marshall · our forecast D+3.0, 69% Democrat · totals only
| County | 2024 president | Expected tonight | Expected votes | Counted | Counted margin | Gap |
|---|---|---|---|---|---|---|
| Johnson ✓ | D+8.5 | D+27.7 | 262,697 | 297,051 (113%) | D+28.0 | +0.3 |
| Sedgwick ✓ | R+13.8 | D+5.4 | 155,206 | 182,715 (118%) | D+7.7 | +2.3 |
| Shawnee ✓ | D+0.5 | D+19.7 | 65,914 | 69,959 (106%) | D+19.0 | −0.7 |
| Douglas ✓ | D+38.0 | D+57.2 | 47,396 | 50,926 (107%) | D+54.7 | −2.5 |
| Wyandotte ✓ | D+23.9 | D+43.1 | 35,035 | 43,181 (123%) | D+48.7 | +5.6 |
| Leavenworth ✓ | R+22.8 | R+3.6 | 26,893 | 28,360 (105%) | R+0.9 | +2.7 |
| Butler ✓ | R+41.2 | R+22.0 | 23,756 | 26,053 (110%) | R+23.5 | −1.5 |
| Reno ✓ | R+34.5 | R+15.3 | 20,776 | 21,725 (105%) | R+15.8 | −0.5 |
| Riley ✓ | D+1.8 | D+21.0 | 18,195 | 20,020 (110%) | D+21.1 | +0.1 |
| Saline ✓ | R+31.6 | R+12.4 | 17,731 | 19,636 (111%) | R+14.3 | −2.0 |
| Miami ✓ | R+39.5 | R+20.3 | 13,494 | 14,112 (105%) | R+19.0 | +1.3 |
| Harvey ✓ | R+21.1 | R+1.8 | 12,917 | 13,737 (106%) | R+3.9 | −2.1 |
| Crawford ✓ | R+25.3 | R+6.0 | 11,834 | 12,213 (103%) | R+1.3 | +4.7 |
| McPherson ✓ | R+41.1 | R+21.9 | 11,154 | 11,545 (104%) | R+25.6 | −3.7 |
| Lyon ✓ | R+14.7 | D+4.5 | 10,128 | 11,309 (112%) | D+8.1 | +3.6 |
| Pottawatomie ✓ | R+47.6 | R+28.4 | 10,503 | 10,816 (103%) | R+28.7 | −0.3 |
| Ellis ✓ | R+46.1 | R+26.9 | 10,552 | 10,645 (101%) | R+24.7 | +2.2 |
| Cowley ✓ | R+40.3 | R+21.1 | 10,671 | 10,447 (98%) | R+20.2 | +0.8 |
| Franklin ✓ | R+40.1 | R+20.9 | 9,535 | 9,787 (103%) | R+17.9 | +3.0 |
| Finney ✓ | R+34.7 | R+15.5 | 7,191 | 9,234 (128%) | D+2.5 | +18.0 |
| Montgomery | R+51.1 | R+31.8 | 9,611 | 9,024 (94%) | R+31.3 | +0.6 * |
| Barton ✓ | R+56.7 | R+37.5 | 8,095 | 8,463 (105%) | R+38.1 | −0.6 |
| Sumner ✓ | R+50.1 | R+30.9 | 7,890 | 8,112 (103%) | R+30.2 | +0.7 |
| Jefferson ✓ | R+36.9 | R+17.7 | 7,622 | 7,912 (104%) | R+18.3 | −0.6 |
| Dickinson ✓ | R+55.0 | R+35.7 | 6,943 | 7,201 (104%) | R+36.9 | −1.2 |
| Ford ✓ | R+38.4 | R+19.1 | 5,994 | 7,198 (120%) | D+1.1 | +20.2 |
| Geary ✓ | R+17.6 | D+1.6 | 6,075 | 6,752 (111%) | D+5.5 | +3.9 |
| Osage ✓ | R+48.0 | R+28.8 | 6,285 | 6,084 (97%) | R+28.3 | +0.5 |
| Cherokee | R+52.9 | R+33.7 | 6,433 | 6,054 (94%) | R+32.9 | +0.8 * |
| Labette ✓ | R+38.2 | R+19.0 | 5,932 | 5,839 (98%) | R+19.0 | −0.1 |
| Jackson ✓ | R+42.6 | R+23.4 | 5,105 | 5,264 (103%) | R+22.2 | +1.1 |
| Atchison | R+37.4 | R+18.1 | 5,486 | 5,176 (94%) | R+14.0 | +4.2 * |
| Neosho ✓ | R+48.1 | R+28.9 | 5,106 | 4,916 (96%) | R+26.0 | +2.9 |
| Marion ✓ | R+49.1 | R+29.9 | 4,815 | 4,707 (98%) | R+34.9 | −5.1 |
| Bourbon | R+54.2 | R+34.9 | 4,839 | 4,573 (95%) | R+34.7 | +0.2 * |
| Nemaha ✓ | R+67.0 | R+47.8 | 4,609 | 4,494 (98%) | R+54.5 | −6.7 |
| Seward ✓ | R+39.0 | R+19.7 | 2,944 | 4,188 (142%) | D+13.5 | +33.2 |
| Allen ✓ | R+46.1 | R+26.9 | 4,138 | 4,087 (99%) | R+22.9 | +4.0 |
| Marshall ✓ | R+49.1 | R+29.9 | 3,899 | 3,892 (100%) | R+31.1 | −1.2 |
| Linn ✓ | R+64.6 | R+45.3 | 3,723 | 3,631 (98%) | R+47.5 | −2.1 |
| Coffey ✓ | R+55.7 | R+36.5 | 3,443 | 3,376 (98%) | R+39.8 | −3.3 |
| Brown ✓ | R+47.9 | R+28.7 | 3,367 | 3,373 (100%) | R+29.9 | −1.1 |
| Clay ✓ | R+55.5 | R+36.3 | 3,301 | 3,309 (100%) | R+40.1 | −3.9 |
| Pratt ✓ | R+51.4 | R+32.2 | 3,128 | 3,291 (105%) | R+33.3 | −1.1 |
| Wabaunsee ✓ | R+48.8 | R+29.6 | 3,353 | 3,248 (97%) | R+32.2 | −2.6 |
| Rice ✓ | R+56.7 | R+37.5 | 3,112 | 3,247 (104%) | R+38.9 | −1.4 |
| Cloud ✓ | R+60.6 | R+41.3 | 3,209 | 3,157 (98%) | R+42.0 | −0.6 |
| Kingman ✓ | R+59.9 | R+40.7 | 3,100 | 3,117 (101%) | R+44.4 | −3.7 |
| Anderson ✓ | R+59.8 | R+40.5 | 2,908 | 2,858 (98%) | R+41.7 | −1.2 |
| Thomas ✓ | R+65.8 | R+46.6 | 2,888 | 2,835 (98%) | R+48.9 | −2.4 |
| Wilson | R+62.4 | R+43.1 | 3,322 | 2,787 (84%) | R+46.2 | −3.1 * |
| Doniphan ✓ | R+63.5 | R+44.3 | 2,644 | 2,562 (97%) | R+48.0 | −3.7 |
| Russell | R+61.3 | R+42.1 | 2,717 | 2,549 (94%) | R+44.5 | −2.4 * |
| Mitchell ✓ | R+65.6 | R+46.3 | 2,375 | 2,469 (104%) | R+53.4 | −7.0 |
| Ottawa ✓ | R+66.6 | R+47.3 | 2,388 | 2,443 (102%) | R+54.7 | −7.3 |
| Morris ✓ | R+46.6 | R+27.3 | 2,244 | 2,324 (104%) | R+23.4 | +4.0 |
| Ellsworth ✓ | R+52.3 | R+33.1 | 2,244 | 2,244 (100%) | R+33.7 | −0.7 |
| Greenwood ✓ | R+61.0 | R+41.7 | 2,320 | 2,217 (96%) | R+45.2 | −3.5 |
| Washington ✓ | R+69.1 | R+49.9 | 2,257 | 2,156 (96%) | R+58.4 | −8.5 |
| Pawnee ✓ | R+51.5 | R+32.3 | 2,155 | 2,051 (95%) | R+36.7 | −4.4 |
| Phillips | R+73.7 | R+54.5 | 2,199 | 1,982 (90%) | R+60.2 | −5.8 * |
| Republic ✓ | R+65.7 | R+46.5 | 1,970 | 1,942 (99%) | R+49.6 | −3.1 |
| Rooks | R+71.2 | R+52.0 | 2,104 | 1,922 (91%) | R+56.7 | −4.7 * |
| Sherman | R+68.7 | R+49.5 | 2,052 | 1,901 (93%) | R+53.4 | −3.9 * |
| Harper | R+64.0 | R+44.8 | 1,979 | 1,841 (93%) | R+47.9 | −3.1 * |
| Norton ✓ | R+67.7 | R+48.4 | 1,799 | 1,807 (100%) | R+54.7 | −6.2 |
| Barber ✓ | R+72.2 | R+52.9 | 1,745 | 1,672 (96%) | R+59.4 | −6.5 |
| Scott ✓ | R+74.7 | R+55.5 | 1,703 | 1,655 (97%) | R+55.2 | +0.3 |
| Gray ✓ | R+69.0 | R+49.8 | 1,718 | 1,647 (96%) | R+50.5 | −0.7 |
| Grant ✓ | R+63.0 | R+43.7 | 1,613 | 1,617 (100%) | R+35.1 | +8.6 |
| Smith | R+68.5 | R+49.3 | 1,645 | 1,523 (93%) | R+57.5 | −8.1 * |
| Stafford ✓ | R+64.0 | R+44.8 | 1,571 | 1,495 (95%) | R+43.7 | +1.0 |
| Trego ✓ | R+71.0 | R+51.8 | 1,263 | 1,359 (108%) | R+53.3 | −1.6 |
| Meade ✓ | R+69.6 | R+50.4 | 1,312 | 1,355 (103%) | R+52.1 | −1.7 |
| Stevens ✓ | R+75.5 | R+56.3 | 1,401 | 1,340 (96%) | R+50.2 | +6.0 |
| Rush ✓ | R+65.4 | R+46.2 | 1,334 | 1,304 (98%) | R+45.7 | +0.5 |
| Osborne | R+68.5 | R+49.3 | 1,440 | 1,292 (90%) | R+54.5 | −5.2 * |
| Lincoln ✓ | R+65.2 | R+46.0 | 1,204 | 1,289 (107%) | R+54.8 | −8.8 |
| Jewell ✓ | R+75.9 | R+56.6 | 1,208 | 1,200 (99%) | R+64.4 | −7.8 |
| Chase ✓ | R+50.8 | R+31.5 | 1,185 | 1,153 (97%) | R+33.7 | −2.1 |
| Chautauqua | R+71.3 | R+52.0 | 1,182 | 1,109 (94%) | R+60.4 | −8.4 * |
| Woodson | R+61.3 | R+42.1 | 1,185 | 1,108 (94%) | R+44.9 | −2.9 * |
| Decatur ✓ | R+69.0 | R+49.8 | 1,132 | 1,096 (97%) | R+56.8 | −7.1 |
| Logan ✓ | R+71.6 | R+52.4 | 1,105 | 1,096 (99%) | R+56.7 | −4.2 |
| Rawlins | R+72.6 | R+53.3 | 1,155 | 1,085 (94%) | R+57.0 | −3.6 * |
| Ness | R+78.9 | R+59.7 | 1,157 | 1,084 (94%) | R+65.1 | −5.4 * |
| Cheyenne ✓ | R+68.8 | R+49.6 | 1,039 | 1,064 (102%) | R+53.9 | −4.2 |
| Sheridan | R+80.3 | R+61.1 | 1,112 | 1,048 (94%) | R+69.9 | −8.8 * |
| Kearny ✓ | R+68.4 | R+49.2 | 957 | 1,025 (107%) | R+52.5 | −3.3 |
| Edwards | R+65.3 | R+46.1 | 1,093 | 1,017 (93%) | R+52.9 | −6.8 * |
| Graham ✓ | R+65.7 | R+46.4 | 1,033 | 1,014 (98%) | R+49.0 | −2.6 |
| Elk | R+69.7 | R+50.4 | 1,076 | 1,011 (94%) | R+58.8 | −8.3 * |
| Haskell ✓ | R+64.5 | R+45.3 | 994 | 997 (100%) | R+43.5 | +1.7 |
| Gove | R+77.1 | R+57.9 | 1,161 | 949 (82%) | R+62.3 | −4.4 * |
| Kiowa | R+71.4 | R+52.1 | 944 | 884 (94%) | R+57.4 | −5.2 * |
| Clark | R+72.8 | R+53.6 | 854 | 752 (88%) | R+54.4 | −0.8 * |
| Morton | R+73.4 | R+54.2 | 808 | 738 (91%) | R+57.0 | −2.9 * |
| Hodgeman | R+70.5 | R+51.3 | 807 | 731 (91%) | R+57.3 | −6.0 * |
| Wichita ✓ | R+73.6 | R+54.4 | 713 | 694 (97%) | R+59.1 | −4.7 |
| Lane ✓ | R+70.9 | R+51.7 | 681 | 670 (98%) | R+56.3 | −4.6 |
| Comanche | R+68.3 | R+49.1 | 744 | 628 (84%) | R+47.3 | +1.8 * |
| Wallace | R+84.8 | R+65.5 | 672 | 599 (89%) | R+76.0 | −10.4 * |
| Hamilton ✓ | R+66.3 | R+47.0 | 605 | 575 (95%) | R+48.7 | −1.7 |
| Stanton ✓ | R+63.6 | R+44.3 | 517 | 531 (103%) | R+42.7 | +1.6 |
| Greeley ✓ | R+73.4 | R+54.1 | 453 | 444 (98%) | R+45.9 | +8.2 |
Gap: + is better for the Democrat than we expected, − better for the Republican. ≡ compared method by method; * whole county, not yet complete (skewed by count order, left out of the race's read).
Ohio Senate (special) Sherrod Brown v Jon Husted · our forecast D+3.1, 69% Democrat · count split by method
| County | 2024 president | Expected tonight | Expected votes | Counted | Counted margin | Gap |
|---|---|---|---|---|---|---|
| Franklin ✓ | D+28.4 | D+42.5 | 425,246 | 505,352 (119%) | D+42.1 | −0.4 |
| Cuyahoga ✓ | D+31.5 | D+45.6 | 409,773 | 475,488 (116%) | D+43.7 | −1.9 |
| Hamilton ✓ | D+14.9 | D+29.0 | 303,600 | 342,187 (113%) | D+25.3 | −3.7 |
| Summit ✓ | D+7.0 | D+21.1 | 199,835 | 225,274 (113%) | D+22.6 | +1.5 |
| Montgomery ✓ | D+0.5 | D+14.6 | 186,826 | 202,829 (109%) | D+15.0 | +0.4 |
| Lucas ✓ | D+12.5 | D+26.7 | 132,730 | 152,674 (115%) | D+25.7 | −0.9 |
| Butler ✓ | R+26.3 | R+12.1 | 128,249 | 146,581 (114%) | R+10.3 | +1.8 |
| Stark ✓ | R+21.9 | R+7.8 | 133,502 | 144,622 (108%) | R+5.3 | +2.5 |
| Lorain ✓ | R+5.7 | D+8.4 | 111,679 | 129,806 (116%) | D+11.2 | +2.8 |
| Delaware ✓ | R+6.6 | D+7.5 | 98,858 | 117,285 (119%) | D+4.5 | −3.1 |
| Warren ✓ | R+31.5 | R+17.4 | 101,415 | 113,087 (112%) | R+17.9 | −0.5 |
| Lake ✓ | R+14.3 | R+0.2 | 94,219 | 105,841 (112%) | D+1.6 | +1.8 |
| Clermont ✓ | R+35.8 | R+21.6 | 80,041 | 89,383 (112%) | R+19.8 | +1.8 |
| Mahoning ✓ | R+9.4 | D+4.7 | 85,818 | 89,146 (104%) | D+7.2 | +2.5 |
| Medina ✓ | R+24.8 | R+10.7 | 77,939 | 85,424 (110%) | R+9.4 | +1.3 |
| Trumbull ✓ | R+16.8 | R+2.7 | 72,972 | 74,350 (102%) | D+2.6 | +5.3 |
| Greene ✓ | R+19.8 | R+5.7 | 65,895 | 74,259 (113%) | R+7.5 | −1.9 |
| Licking ✓ | R+30.0 | R+15.9 | 66,340 | 74,189 (112%) | R+12.1 | +3.7 |
| Fairfield ✓ | R+24.0 | R+9.9 | 59,231 | 68,207 (115%) | R+6.6 | +3.3 |
| Portage ✓ | R+15.5 | R+1.4 | 60,449 | 65,900 (109%) | D+2.7 | +4.1 |
| Wood ✓ | R+10.1 | D+4.0 | 48,459 | 54,472 (112%) | D+4.6 | +0.6 |
| Clark ✓ | R+29.5 | R+15.4 | 44,272 | 48,806 (110%) | R+13.2 | +2.2 |
| Miami ✓ | R+45.1 | R+31.0 | 42,161 | 45,636 (108%) | R+30.9 | +0.1 |
| Geauga ✓ | R+24.1 | R+10.0 | 42,679 | 45,439 (106%) | R+11.8 | −1.8 |
| Richland ✓ | R+42.3 | R+28.2 | 41,716 | 44,064 (106%) | R+26.2 | +2.0 |
| Wayne ✓ | R+39.2 | R+25.1 | 38,431 | 41,300 (107%) | R+25.2 | −0.1 |
| Allen ✓ | R+44.1 | R+30.0 | 32,657 | 35,218 (108%) | R+31.0 | −1.1 |
| Columbiana ✓ | R+49.0 | R+34.9 | 35,534 | 34,859 (98%) | R+30.7 | +4.1 |
| Ashtabula ✓ | R+28.4 | R+14.2 | 30,838 | 33,016 (107%) | R+9.2 | +5.1 |
| Tuscarawas ✓ | R+43.3 | R+29.1 | 30,339 | 32,117 (106%) | R+23.4 | +5.7 |
| Erie ✓ | R+14.1 | Even | 28,887 | 31,963 (111%) | D+1.0 | +1.0 |
| Union ✓ | R+29.6 | R+15.5 | 25,395 | 31,167 (123%) | R+13.7 | +1.8 |
| Hancock ✓ | R+38.4 | R+24.3 | 27,102 | 28,902 (107%) | R+23.5 | +0.8 |
| Muskingum ✓ | R+43.9 | R+29.8 | 27,302 | 28,820 (106%) | R+26.9 | +2.8 |
| Ross ✓ | R+39.3 | R+25.2 | 22,586 | 24,660 (109%) | R+21.5 | +3.7 |
| Knox ✓ | R+44.9 | R+30.8 | 23,073 | 24,172 (105%) | R+31.4 | −0.6 |
| Washington ✓ | R+43.7 | R+29.6 | 22,750 | 22,638 (100%) | R+24.9 | +4.7 |
| Sandusky ✓ | R+30.9 | R+16.7 | 21,343 | 22,577 (106%) | R+13.1 | +3.7 |
| Pickaway ✓ | R+48.5 | R+34.4 | 19,555 | 22,145 (113%) | R+31.1 | +3.3 |
| Jefferson ✓ | R+43.9 | R+29.8 | 22,884 | 22,072 (96%) | R+24.3 | +5.4 |
| Belmont ✓ | R+47.3 | R+33.1 | 22,525 | 22,004 (98%) | R+26.3 | +6.9 |
| Scioto ✓ | R+47.9 | R+33.8 | 21,067 | 21,498 (102%) | R+25.5 | +8.3 |
| Athens ✓ | D+10.7 | D+24.9 | 19,075 | 20,327 (107%) | D+30.5 | +5.6 |
| Darke ✓ | R+65.3 | R+51.2 | 19,750 | 20,041 (101%) | R+52.5 | −1.2 |
| Marion ✓ | R+41.4 | R+27.2 | 19,102 | 19,940 (104%) | R+22.1 | +5.1 |
| Ashland ✓ | R+49.9 | R+35.8 | 18,400 | 19,879 (108%) | R+34.4 | +1.4 |
| Huron ✓ | R+44.0 | R+29.9 | 18,396 | 19,650 (107%) | R+23.1 | +6.8 |
| Auglaize ✓ | R+64.5 | R+50.4 | 18,663 | 19,243 (103%) | R+53.4 | −3.0 |
| Ottawa ✓ | R+25.1 | R+10.9 | 18,483 | 19,231 (104%) | R+12.6 | −1.7 |
| Shelby ✓ | R+64.8 | R+50.7 | 18,021 | 18,981 (105%) | R+53.0 | −2.4 |
| Seneca ✓ | R+37.5 | R+23.4 | 17,986 | 18,789 (104%) | R+19.1 | +4.3 |
| Lawrence ✓ | R+50.5 | R+36.4 | 17,490 | 18,034 (103%) | R+28.1 | +8.3 |
| Mercer ✓ | R+66.7 | R+52.6 | 17,779 | 18,021 (101%) | R+57.0 | −4.4 |
| Logan ✓ | R+56.2 | R+42.1 | 16,449 | 17,791 (108%) | R+40.9 | +1.1 |
| Fulton ✓ | R+42.4 | R+28.2 | 16,332 | 17,359 (106%) | R+28.2 | +0.1 |
| Madison ✓ | R+43.6 | R+29.5 | 14,113 | 16,256 (115%) | R+27.8 | +1.7 |
| Champaign ✓ | R+50.7 | R+36.6 | 14,348 | 15,502 (108%) | R+32.0 | +4.7 |
| Clinton ✓ | R+54.6 | R+40.5 | 14,077 | 15,403 (109%) | R+37.7 | +2.7 |
| Putnam ✓ | R+68.7 | R+54.6 | 14,999 | 15,397 (103%) | R+59.3 | −4.7 |
| Preble ✓ | R+59.1 | R+45.0 | 15,689 | 15,352 (98%) | R+42.7 | +2.2 |
| Brown ✓ | R+61.5 | R+47.3 | 14,132 | 14,947 (106%) | R+42.8 | +4.5 |
| Crawford ✓ | R+52.9 | R+38.8 | 14,803 | 14,685 (99%) | R+36.0 | +2.8 |
| Defiance ✓ | R+39.8 | R+25.7 | 13,334 | 14,521 (109%) | R+24.9 | +0.8 |
| Highland ✓ | R+63.3 | R+49.2 | 13,110 | 14,269 (109%) | R+44.0 | +5.2 |
| Morrow ✓ | R+55.7 | R+41.6 | 13,288 | 14,108 (106%) | R+39.6 | +2.0 |
| Williams ✓ | R+48.2 | R+34.1 | 12,874 | 13,527 (105%) | R+34.4 | −0.3 |
| Guernsey ✓ | R+52.0 | R+37.9 | 12,183 | 12,689 (104%) | R+32.4 | +5.5 |
| Perry ✓ | R+54.5 | R+40.4 | 11,899 | 12,474 (105%) | R+35.0 | +5.4 |
| Coshocton ✓ | R+52.2 | R+38.1 | 11,276 | 11,729 (104%) | R+34.3 | +3.7 |
| Henry ✓ | R+46.7 | R+32.6 | 10,386 | 11,157 (107%) | R+32.6 | −0.1 |
| Van Wert ✓ | R+58.5 | R+44.3 | 10,135 | 10,511 (104%) | R+44.4 | −0.0 |
| Carroll ✓ | R+54.7 | R+40.6 | 10,115 | 10,268 (102%) | R+38.3 | +2.3 |
| Wyandot ✓ | R+51.2 | R+37.1 | 8,095 | 9,974 (123%) | R+29.4 | +7.6 |
| Jackson ✓ | R+58.0 | R+43.9 | 8,884 | 9,757 (110%) | R+35.9 | +8.0 |
| Hocking ✓ | R+44.3 | R+30.1 | 9,492 | 9,710 (102%) | R+24.9 | +5.2 |
| Hardin ✓ | R+54.6 | R+40.5 | 8,992 | 9,083 (101%) | R+37.1 | +3.4 |
| Fayette ✓ | R+55.1 | R+41.0 | 8,389 | 9,076 (108%) | R+39.6 | +1.4 |
| Paulding ✓ | R+56.2 | R+42.1 | 6,460 | 8,931 (138%) | R+38.3 | +3.8 |
| Adams ✓ | R+65.7 | R+51.6 | 8,743 | 8,924 (102%) | R+44.6 | +7.0 |
| Holmes ✓ | R+69.1 | R+55.0 | 8,620 | 8,890 (103%) | R+57.1 | −2.2 |
| Gallia ✓ | R+59.4 | R+45.2 | 9,109 | 8,662 (95%) | R+40.2 | +5.0 |
| Pike ✓ | R+53.7 | R+39.5 | 7,815 | 8,525 (109%) | R+31.3 | +8.3 |
| Meigs ✓ | R+56.9 | R+42.8 | 7,464 | 7,505 (101%) | R+36.2 | +6.6 |
| Harrison ✓ | R+55.2 | R+41.1 | 5,172 | 5,027 (97%) | R+34.3 | +6.8 |
| Morgan ✓ | R+53.2 | R+39.0 | 4,811 | 4,831 (100%) | R+35.5 | +3.5 |
| Monroe ✓ | R+59.7 | R+45.6 | 4,857 | 4,780 (98%) | R+38.3 | +7.3 |
| Noble ✓ | R+64.6 | R+50.5 | 4,602 | 4,483 (97%) | R+46.1 | +4.4 |
| Vinton ✓ | R+58.6 | R+44.4 | 4,014 | 3,903 (97%) | R+36.6 | +7.8 |
Gap: + is better for the Democrat than we expected, − better for the Republican. ≡ compared method by method; * whole county, not yet complete (skewed by count order, left out of the race's read).
Texas Senate James Talarico v Ken Paxton · our forecast D+4.0, 70% Democrat · totals only
| County | 2024 president | Expected tonight | Expected votes | Counted | Counted margin | Gap |
|---|---|---|---|---|---|---|
| Harris ✓ | D+5.5 | D+23.0 | 1,097,892 | 1,382,875 (126%) | D+33.0 | +10.0 |
| Dallas ✓ | D+22.1 | D+39.6 | 623,883 | 783,308 (126%) | D+45.6 | +6.0 |
| Tarrant ✓ | R+5.1 | D+12.3 | 589,567 | 728,259 (124%) | D+19.2 | +6.9 |
| Bexar ✓ | D+9.7 | D+27.2 | 538,522 | 658,445 (122%) | D+35.5 | +8.3 |
| Travis ✓ | D+39.1 | D+56.6 | 461,264 | 548,521 (119%) | D+58.5 | +1.9 |
| Collin ✓ | R+11.1 | D+6.3 | 364,138 | 457,413 (126%) | D+12.1 | +5.8 |
| Denton ✓ | R+13.2 | D+4.3 | 317,007 | 395,959 (125%) | D+8.4 | +4.2 |
| Fort Bend ✓ | D+1.6 | D+19.0 | 249,051 | 331,775 (133%) | D+28.6 | +9.6 |
| Williamson ✓ | R+2.4 | D+15.0 | 225,064 | 278,482 (124%) | D+20.3 | +5.3 |
| Montgomery ✓ | R+45.5 | R+28.1 | 207,554 | 258,438 (125%) | R+22.2 | +5.9 |
| El Paso ✓ | D+15.1 | D+32.5 | 164,311 | 219,956 (134%) | D+48.0 | +15.4 |
| Hidalgo ✓ | R+2.9 | D+14.6 | 140,343 | 202,520 (144%) | D+46.5 | +31.9 |
| Brazoria ✓ | R+19.7 | R+2.3 | 109,618 | 141,824 (129%) | D+5.4 | +7.7 |
| Galveston ✓ | R+27.4 | R+10.0 | 110,374 | 134,555 (122%) | R+5.9 | +4.1 |
| Hays ✓ | D+5.6 | D+23.1 | 89,376 | 119,693 (134%) | D+32.1 | +9.0 |
| Bell ✓ | R+16.2 | D+1.2 | 87,631 | 110,495 (126%) | D+5.1 | +3.9 |
| Lubbock ✓ | R+39.6 | R+22.1 | 83,560 | 104,328 (125%) | R+16.5 | +5.6 |
| Cameron ✓ | R+5.8 | D+11.6 | 76,574 | 102,017 (133%) | D+38.5 | +26.9 |
| Nueces ✓ | R+11.5 | D+5.9 | 88,881 | 99,851 (112%) | D+11.2 | +5.3 |
| Comal ✓ | R+45.6 | R+28.1 | 74,602 | 89,221 (120%) | R+29.3 | −1.1 |
| Smith ✓ | R+45.0 | R+27.6 | 76,067 | 88,960 (117%) | R+24.6 | +3.0 |
| Ellis ✓ | R+31.0 | R+13.6 | 67,630 | 88,524 (131%) | R+4.4 | +9.1 |
| McLennan ✓ | R+30.9 | R+13.5 | 72,406 | 83,056 (115%) | R+8.5 | +4.9 |
| Brazos ✓ | R+24.9 | R+7.4 | 59,810 | 79,867 (134%) | D+6.0 | +13.4 |
| Parker ✓ | R+66.5 | R+49.0 | 63,355 | 76,140 (120%) | R+50.9 | −1.8 |
| Jefferson ✓ | R+8.9 | D+8.6 | 62,174 | 72,750 (117%) | D+13.2 | +4.7 |
| Guadalupe ✓ | R+29.5 | R+12.0 | 57,027 | 70,924 (124%) | R+5.8 | +6.2 |
| Johnson ✓ | R+51.4 | R+33.9 | 55,757 | 69,924 (125%) | R+27.2 | +6.8 |
| Kaufman ✓ | R+27.8 | R+10.4 | 42,702 | 62,251 (146%) | D+1.3 | +11.7 |
| Webb ✓ | R+2.1 | D+15.3 | 43,936 | 58,349 (133%) | D+47.3 | +32.0 |
| Grayson ✓ | R+54.2 | R+36.8 | 44,926 | 53,782 (120%) | R+37.4 | −0.6 |
| Rockwall ✓ | R+40.8 | R+23.3 | 42,790 | 53,505 (125%) | R+22.5 | +0.9 |
| Randall ✓ | R+60.4 | R+43.0 | 47,934 | 53,195 (111%) | R+41.1 | +1.9 |
| Midland ✓ | R+60.4 | R+43.0 | 39,957 | 44,039 (110%) | R+37.5 | +5.5 |
| Taylor ✓ | R+49.8 | R+32.4 | 39,292 | 42,673 (109%) | R+31.1 | +1.3 |
| Gregg ✓ | R+42.3 | R+24.9 | 33,139 | 38,041 (115%) | R+20.1 | +4.7 |
| Hunt ✓ | R+55.6 | R+38.1 | 30,484 | 37,502 (123%) | R+33.9 | +4.3 |
| Bastrop ✓ | R+18.3 | R+0.9 | 29,123 | 36,976 (127%) | D+10.9 | +11.8 |
| Tom Green ✓ | R+48.1 | R+30.6 | 31,742 | 36,169 (114%) | R+26.9 | +3.7 |
| Wichita ✓ | R+44.0 | R+26.6 | 31,518 | 34,327 (109%) | R+24.2 | +2.4 |
| Henderson ✓ | R+63.5 | R+46.0 | 27,966 | 31,073 (111%) | R+46.1 | −0.1 |
| Wise ✓ | R+70.1 | R+52.7 | 25,769 | 30,972 (120%) | R+52.3 | +0.4 |
| Hood ✓ | R+66.1 | R+48.7 | 27,196 | 30,225 (111%) | R+52.4 | −3.7 |
| Ector ✓ | R+52.9 | R+35.4 | 25,374 | 29,474 (116%) | R+18.9 | +16.5 |
| Victoria ✓ | R+42.6 | R+25.2 | 25,176 | 28,167 (112%) | R+23.1 | +2.1 |
| Bowie ✓ | R+48.7 | R+31.2 | 26,496 | 27,696 (105%) | R+32.1 | −0.9 |
| Angelina ✓ | R+52.0 | R+34.6 | 24,509 | 27,286 (111%) | R+30.4 | +4.2 |
| Orange ✓ | R+66.7 | R+49.3 | 25,060 | 26,299 (105%) | R+49.9 | −0.6 |
| Kendall ✓ | R+55.8 | R+38.3 | 22,460 | 26,064 (116%) | R+43.2 | −4.8 |
| Potter ✓ | R+44.5 | R+27.0 | 21,719 | 25,673 (118%) | R+19.1 | +8.0 |
| Liberty ✓ | R+61.7 | R+44.2 | 19,734 | 25,449 (129%) | R+28.1 | +16.2 |
| Burnet ✓ | R+55.8 | R+38.4 | 21,068 | 24,246 (115%) | R+38.9 | −0.6 |
| Harrison ✓ | R+50.6 | R+33.2 | 21,303 | 24,043 (113%) | R+34.7 | −1.5 |
| Waller ✓ | R+25.1 | R+7.6 | 16,664 | 23,751 (143%) | R+1.8 | +5.8 |
| Kerr ✓ | R+54.4 | R+37.0 | 22,427 | 23,426 (104%) | R+37.3 | −0.3 |
| Van Zandt ✓ | R+74.9 | R+57.5 | 20,533 | 22,153 (108%) | R+60.9 | −3.5 |
| Wilson ✓ | R+53.7 | R+36.3 | 19,415 | 21,988 (113%) | R+35.6 | +0.7 |
| Walker ✓ | R+40.0 | R+22.6 | 17,342 | 21,628 (125%) | R+19.1 | +3.5 |
| Nacogdoches ✓ | R+38.8 | R+21.4 | 18,926 | 21,488 (114%) | R+13.2 | +8.2 |
| Medina ✓ | R+42.8 | R+25.3 | 17,312 | 21,237 (123%) | R+21.8 | +3.5 |
| Hardin ✓ | R+75.9 | R+58.5 | 19,594 | 20,922 (107%) | R+61.5 | −3.0 |
| San Patricio ✓ | R+36.5 | R+19.0 | 17,818 | 20,107 (113%) | R+12.7 | +6.3 |
| Wood ✓ | R+69.8 | R+52.4 | 18,150 | 19,754 (109%) | R+59.0 | −6.6 |
| Chambers ✓ | R+65.7 | R+48.3 | 15,682 | 19,453 (124%) | R+45.9 | +2.4 |
| Coryell ✓ | R+40.7 | R+23.2 | 16,312 | 18,846 (116%) | R+19.3 | +4.0 |
| Polk ✓ | R+59.0 | R+41.6 | 16,743 | 17,493 (104%) | R+45.9 | −4.3 |
| Rusk ✓ | R+59.4 | R+42.0 | 15,572 | 17,346 (111%) | R+40.3 | +1.7 |
| Cooke ✓ | R+66.9 | R+49.5 | 15,293 | 17,142 (112%) | R+49.3 | +0.2 |
| Cherokee ✓ | R+62.8 | R+45.3 | 14,444 | 16,601 (115%) | R+43.8 | +1.5 |
| Lamar ✓ | R+61.0 | R+43.6 | 15,344 | 16,419 (107%) | R+45.6 | −2.0 |
| Navarro ✓ | R+51.8 | R+34.4 | 14,099 | 16,100 (114%) | R+29.1 | +5.3 |
| Upshur ✓ | R+71.1 | R+53.7 | 14,254 | 15,492 (109%) | R+56.0 | −2.3 |
| Washington ✓ | R+54.6 | R+37.2 | 13,949 | 15,480 (111%) | R+41.4 | −4.2 |
| Anderson ✓ | R+61.8 | R+44.4 | 14,415 | 15,257 (106%) | R+45.5 | −1.2 |
| Caldwell ✓ | R+14.4 | D+3.0 | 11,288 | 14,781 (131%) | D+15.7 | +12.6 |
| Gillespie ✓ | R+61.0 | R+43.5 | 13,366 | 14,579 (109%) | R+47.1 | −3.5 |
| Atascosa ✓ | R+43.3 | R+25.9 | 12,634 | 14,529 (115%) | R+14.9 | +11.0 |
| Erath ✓ | R+67.9 | R+50.5 | 13,077 | 14,107 (108%) | R+45.9 | +4.6 |
| Hopkins ✓ | R+64.7 | R+47.3 | 12,324 | 13,282 (108%) | R+45.5 | +1.7 |
| Hill ✓ | R+64.4 | R+47.0 | 11,361 | 13,142 (116%) | R+46.2 | +0.8 |
| Starr ✓ | R+16.0 | D+1.4 | 10,986 | 13,082 (119%) | D+55.8 | +54.4 |
| Fannin ✓ | R+67.4 | R+50.0 | 11,597 | 12,976 (112%) | R+51.7 | −1.7 |
| Brown ✓ | R+74.0 | R+56.6 | 12,254 | 12,946 (106%) | R+60.8 | −4.2 |
| Austin ✓ | R+62.6 | R+45.2 | 11,195 | 12,819 (115%) | R+46.1 | −0.9 |
| Wharton ✓ | R+51.9 | R+34.4 | 12,129 | 12,587 (104%) | R+34.7 | −0.3 |
| Maverick ✓ | R+18.5 | R+1.1 | 9,483 | 12,551 (132%) | D+41.1 | +42.2 |
| Jasper ✓ | R+66.6 | R+49.2 | 11,370 | 11,981 (105%) | R+51.5 | −2.3 |
| Grimes ✓ | R+60.3 | R+42.9 | 9,413 | 11,718 (124%) | R+43.8 | −0.9 |
| Llano ✓ | R+60.9 | R+43.5 | 11,021 | 11,665 (106%) | R+49.8 | −6.3 |
| Val Verde ✓ | R+26.6 | R+9.2 | 9,417 | 11,641 (124%) | D+12.2 | +21.4 |
| Fayette ✓ | R+61.3 | R+43.9 | 10,486 | 11,183 (107%) | R+45.1 | −1.2 |
| Matagorda ✓ | R+50.6 | R+33.2 | 9,695 | 10,928 (113%) | R+29.4 | +3.8 |
| Cass ✓ | R+65.8 | R+48.3 | 9,951 | 10,836 (109%) | R+55.6 | −7.3 |
| Jim Wells ✓ | R+15.5 | D+1.9 | 9,496 | 10,664 (112%) | D+15.4 | +13.5 |
| Aransas ✓ | R+55.8 | R+38.4 | 9,608 | 10,596 (110%) | R+42.6 | −4.3 |
| San Jacinto ✓ | R+65.4 | R+47.9 | 9,522 | 10,407 (109%) | R+49.9 | −1.9 |
| Palo Pinto ✓ | R+67.2 | R+49.8 | 9,467 | 10,377 (110%) | R+48.4 | +1.3 |
| Bandera ✓ | R+61.9 | R+44.5 | 10,456 | 10,234 (98%) | R+51.5 | −7.0 |
| Lampasas ✓ | R+59.5 | R+42.1 | 8,214 | 9,161 (112%) | R+43.8 | −1.7 |
| Titus ✓ | R+54.7 | R+37.3 | 7,308 | 8,735 (120%) | R+24.8 | +12.5 |
| Montague ✓ | R+77.8 | R+60.3 | 7,840 | 8,637 (110%) | R+66.7 | −6.3 |
| Milam ✓ | R+57.4 | R+40.0 | 8,340 | 8,608 (103%) | R+40.0 | −0.0 |
| Lavaca ✓ | R+76.1 | R+58.7 | 8,195 | 8,583 (105%) | R+65.6 | −6.9 |
| Panola ✓ | R+66.5 | R+49.1 | 8,298 | 8,560 (103%) | R+52.7 | −3.6 |
| Colorado ✓ | R+57.2 | R+39.7 | 7,533 | 8,353 (111%) | R+43.3 | −3.6 |
| Uvalde ✓ | R+33.4 | R+16.0 | 7,908 | 8,348 (106%) | R+2.4 | +13.6 |
| Kleberg ✓ | R+12.7 | D+4.8 | 7,592 | 8,159 (107%) | D+14.9 | +10.2 |
| Burleson ✓ | R+62.9 | R+45.5 | 6,702 | 7,799 (116%) | R+48.2 | −2.7 |
| Bosque ✓ | R+67.3 | R+49.9 | 7,443 | 7,720 (104%) | R+52.5 | −2.6 |
| Blanco ✓ | R+52.4 | R+35.0 | 6,757 | 7,557 (112%) | R+41.7 | −6.7 |
| Hale ✓ | R+58.0 | R+40.6 | 6,316 | 7,536 (119%) | R+29.7 | +10.9 |
| Shelby ✓ | R+64.7 | R+47.2 | 6,923 | 7,489 (108%) | R+47.4 | −0.2 |
| Houston ✓ | R+55.4 | R+37.9 | 7,172 | 7,447 (104%) | R+45.7 | −7.8 |
| Freestone ✓ | R+66.4 | R+49.0 | 6,647 | 7,307 (110%) | R+50.6 | −1.5 |
| Limestone ✓ | R+56.8 | R+39.4 | 6,822 | 7,245 (106%) | R+36.5 | +2.9 |
| Tyler ✓ | R+73.5 | R+56.1 | 7,228 | 7,210 (100%) | R+61.9 | −5.8 |
| Bee ✓ | R+39.9 | R+22.5 | 6,380 | 7,153 (112%) | R+13.6 | +8.9 |
| Howard ✓ | R+62.9 | R+45.4 | 6,530 | 7,052 (108%) | R+40.3 | +5.1 |
| Leon ✓ | R+76.8 | R+59.4 | 6,837 | 7,051 (103%) | R+64.7 | −5.3 |
| Robertson ✓ | R+52.1 | R+34.7 | 5,998 | 6,973 (116%) | R+32.5 | +2.1 |
| Lee ✓ | R+60.4 | R+43.0 | 6,266 | 6,921 (110%) | R+42.5 | +0.5 |
| Gonzales ✓ | R+54.8 | R+37.4 | 5,539 | 6,689 (121%) | R+31.0 | +6.4 |
| Young ✓ | R+76.3 | R+58.9 | 6,184 | 6,560 (106%) | R+59.9 | −1.0 |
| Hockley ✓ | R+66.4 | R+48.9 | 5,520 | 6,440 (117%) | R+45.9 | +3.0 |
| Eastland ✓ | R+77.7 | R+60.3 | 6,143 | 6,320 (103%) | R+63.4 | −3.1 |
| Calhoun ✓ | R+52.2 | R+34.8 | 5,574 | 6,319 (113%) | R+31.8 | +3.0 |
| Dewitt ✓ | R+67.1 | R+49.7 | 6,052 | 6,246 (103%) | R+54.0 | −4.3 |
| Hutchinson ✓ | R+77.3 | R+59.8 | 6,053 | 6,061 (100%) | R+60.2 | −0.3 |
| Trinity ✓ | R+67.1 | R+49.7 | 5,332 | 5,754 (108%) | R+53.3 | −3.6 |
| Gray ✓ | R+77.2 | R+59.8 | 5,539 | 5,498 (99%) | R+57.8 | +2.0 |
| Callahan ✓ | R+77.7 | R+60.2 | 5,251 | 5,382 (102%) | R+64.3 | −4.1 |
| Jones ✓ | R+73.1 | R+55.7 | 4,983 | 5,224 (105%) | R+56.0 | −0.4 |
| Comanche ✓ | R+74.1 | R+56.7 | 4,820 | 5,146 (107%) | R+57.8 | −1.1 |
| Rains ✓ | R+73.0 | R+55.6 | 4,976 | 5,080 (102%) | R+61.6 | −6.0 |
| Jackson ✓ | R+70.8 | R+53.4 | 4,590 | 4,996 (109%) | R+54.3 | −0.9 |
| Falls ✓ | R+44.8 | R+27.4 | 4,694 | 4,925 (105%) | R+28.5 | −1.2 |
| Gaines ✓ | R+82.8 | R+65.3 | 4,105 | 4,786 (117%) | R+63.4 | +1.9 |
| Willacy ✓ | R+3.3 | D+14.1 | 3,826 | 4,645 (121%) | D+35.0 | +20.9 |
| Clay ✓ | R+79.6 | R+62.2 | 4,481 | 4,633 (103%) | R+67.9 | −5.7 |
| Somervell ✓ | R+70.6 | R+53.1 | 4,032 | 4,302 (107%) | R+57.4 | −4.2 |
| Madison ✓ | R+64.5 | R+47.0 | 3,903 | 4,288 (110%) | R+47.3 | −0.3 |
| Camp ✓ | R+53.6 | R+36.1 | 3,973 | 4,278 (108%) | R+34.5 | +1.7 |
| Newton ✓ | R+66.7 | R+49.2 | 4,365 | 4,270 (98%) | R+54.8 | −5.6 |
| Sabine ✓ | R+78.6 | R+61.2 | 4,161 | 4,262 (102%) | R+69.2 | −8.0 |
| Red River ✓ | R+61.8 | R+44.4 | 4,266 | 4,250 (100%) | R+48.3 | −3.9 |
| Franklin ✓ | R+69.0 | R+51.6 | 3,910 | 4,240 (108%) | R+55.1 | −3.6 |
| Morris ✓ | R+51.1 | R+33.7 | 3,984 | 4,202 (105%) | R+37.5 | −3.8 |
| Scurry ✓ | R+73.6 | R+56.2 | 4,116 | 4,168 (101%) | R+58.4 | −2.3 |
| Andrews ✓ | R+72.7 | R+55.3 | 3,810 | 4,145 (109%) | R+43.6 | +11.7 |
| Moore ✓ | R+67.2 | R+49.8 | 3,589 | 4,111 (115%) | R+30.6 | +19.1 |
| Karnes ✓ | R+58.2 | R+40.8 | 3,808 | 4,029 (106%) | R+38.1 | +2.7 |
| Archer ✓ | R+79.5 | R+62.0 | 3,845 | 3,996 (104%) | R+69.2 | −7.2 |
| Live Oak ✓ | R+69.7 | R+52.3 | 3,993 | 3,855 (97%) | R+57.4 | −5.1 |
| Marion ✓ | R+52.6 | R+35.2 | 3,292 | 3,826 (116%) | R+41.4 | −6.3 |
| Brewster ✓ | R+12.6 | D+4.8 | 3,745 | 3,808 (102%) | D+11.3 | +6.5 |
| Frio ✓ | R+24.6 | R+7.1 | 3,694 | 3,798 (103%) | D+11.3 | +18.4 |
| Nolan ✓ | R+59.2 | R+41.8 | 3,783 | 3,716 (98%) | R+39.5 | +2.3 |
| Hamilton ✓ | R+71.2 | R+53.7 | 3,471 | 3,561 (103%) | R+58.5 | −4.8 |
| Deaf Smith ✓ | R+51.7 | R+34.3 | 2,931 | 3,523 (120%) | R+15.0 | +19.3 |
| Jack ✓ | R+82.4 | R+65.0 | 2,990 | 3,392 (113%) | R+68.8 | −3.8 |
| Wilbarger ✓ | R+60.7 | R+43.2 | 3,144 | 3,385 (108%) | R+44.4 | −1.2 |
| Goliad ✓ | R+60.2 | R+42.8 | 3,357 | 3,350 (100%) | R+47.0 | −4.2 |
| Pecos | R+44.9 | R+27.5 | 3,645 | 3,339 (92%) | R+9.1 | +18.4 * |
| Duval | R+10.0 | D+7.5 | 3,637 | 3,280 (90%) | D+36.7 | +29.3 * |
| Lamb ✓ | R+64.4 | R+47.0 | 3,069 | 3,279 (107%) | R+44.7 | +2.3 |
| Zapata ✓ | R+22.5 | R+5.0 | 3,421 | 3,253 (95%) | D+40.7 | +45.8 |
| Coleman ✓ | R+79.0 | R+61.6 | 3,230 | 3,232 (100%) | R+69.1 | −7.6 |
| Runnels ✓ | R+77.2 | R+59.8 | 3,230 | 3,169 (98%) | R+63.0 | −3.2 |
| Reeves ✓ | R+36.9 | R+19.5 | 2,158 | 3,099 (144%) | D+7.7 | +27.2 |
| Zavala ✓ | D+14.5 | D+31.9 | 2,426 | 3,078 (127%) | D+50.6 | +18.7 |
| San Augustine ✓ | R+56.3 | R+38.9 | 2,861 | 3,077 (108%) | R+40.2 | −1.3 |
| Stephens ✓ | R+79.3 | R+61.9 | 2,745 | 2,784 (101%) | R+63.9 | −2.0 |
| Dimmit | D+3.0 | D+20.4 | 2,855 | 2,688 (94%) | D+39.1 | +18.7 * |
| McCulloch ✓ | R+73.5 | R+56.1 | 2,556 | 2,664 (104%) | R+61.2 | −5.2 |
| Terry ✓ | R+65.1 | R+47.7 | 2,571 | 2,616 (102%) | R+43.3 | +4.4 |
| Dawson ✓ | R+61.1 | R+43.7 | 2,507 | 2,572 (103%) | R+44.6 | −0.9 |
| Ward ✓ | R+66.2 | R+48.7 | 2,510 | 2,554 (102%) | R+42.1 | +6.7 |
| Refugio ✓ | R+39.6 | R+22.1 | 2,310 | 2,404 (104%) | R+24.5 | −2.4 |
| Carson ✓ | R+81.2 | R+63.8 | 2,391 | 2,379 (99%) | R+67.0 | −3.2 |
| Ochiltree ✓ | R+81.6 | R+64.2 | 2,121 | 2,328 (110%) | R+53.6 | +10.6 |
| San Saba ✓ | R+78.9 | R+61.5 | 2,163 | 2,186 (101%) | R+64.3 | −2.8 |
| Mason ✓ | R+65.0 | R+47.6 | 2,057 | 2,158 (105%) | R+52.2 | −4.6 |
| Mills ✓ | R+77.0 | R+59.6 | 2,115 | 2,128 (101%) | R+65.5 | −5.9 |
| Lynn ✓ | R+70.4 | R+53.0 | 1,717 | 2,122 (124%) | R+55.7 | −2.7 |
| Delta ✓ | R+69.8 | R+52.4 | 2,020 | 2,001 (99%) | R+55.2 | −2.8 |
| Parmer ✓ | R+70.2 | R+52.7 | 1,758 | 1,975 (112%) | R+45.4 | +7.3 |
| Kimble ✓ | R+77.7 | R+60.2 | 1,870 | 1,971 (105%) | R+63.3 | −3.0 |
| Presidio ✓ | D+30.3 | D+47.7 | 1,708 | 1,878 (110%) | D+54.8 | +7.2 |
| Mitchell ✓ | R+71.4 | R+54.0 | 1,776 | 1,861 (105%) | R+60.2 | −6.3 |
| La Salle ✓ | R+20.5 | R+3.1 | 1,428 | 1,858 (130%) | D+16.8 | +20.0 |
| Brooks | D+9.6 | D+27.1 | 1,998 | 1,813 (91%) | D+40.5 | +13.4 * |
| Yoakum ✓ | R+70.9 | R+53.5 | 1,631 | 1,774 (109%) | R+37.8 | +15.7 |
| Swisher ✓ | R+63.4 | R+46.0 | 1,656 | 1,714 (104%) | R+44.5 | +1.5 |
| Wheeler ✓ | R+84.7 | R+67.3 | 1,685 | 1,690 (100%) | R+72.4 | −5.1 |
| Childress ✓ | R+76.1 | R+58.7 | 1,744 | 1,685 (97%) | R+61.8 | −3.2 |
| Floyd ✓ | R+65.0 | R+47.6 | 1,464 | 1,628 (111%) | R+41.0 | +6.6 |
| Haskell ✓ | R+71.6 | R+54.1 | 1,665 | 1,623 (97%) | R+58.2 | −4.1 |
| Castro ✓ | R+58.2 | R+40.8 | 1,482 | 1,542 (104%) | R+40.2 | +0.6 |
| Hartley ✓ | R+83.5 | R+66.0 | 1,571 | 1,530 (97%) | R+68.2 | −2.1 |
| Hansford ✓ | R+85.0 | R+67.5 | 1,517 | 1,509 (99%) | R+64.2 | +3.3 |
| Real ✓ | R+66.9 | R+49.5 | 1,564 | 1,505 (96%) | R+56.5 | −7.0 |
| Crosby ✓ | R+51.4 | R+34.0 | 1,251 | 1,490 (119%) | R+27.6 | +6.4 |
| Martin ✓ | R+75.8 | R+58.3 | 1,502 | 1,478 (98%) | R+58.9 | −0.6 |
| Bailey ✓ | R+61.2 | R+43.7 | 1,327 | 1,416 (107%) | R+34.7 | +9.1 |
| Fisher ✓ | R+63.2 | R+45.8 | 1,396 | 1,406 (101%) | R+51.1 | −5.4 |
| Coke ✓ | R+79.7 | R+62.3 | 1,385 | 1,354 (98%) | R+67.2 | −4.9 |
| Jim Hogg | D+8.3 | D+25.7 | 1,532 | 1,351 (88%) | D+50.4 | +24.7 * |
| Winkler ✓ | R+70.6 | R+53.2 | 1,317 | 1,339 (102%) | R+39.2 | +14.0 |
| Shackelford ✓ | R+82.2 | R+64.8 | 1,237 | 1,279 (103%) | R+74.0 | −9.2 |
| Donley ✓ | R+78.2 | R+60.8 | 1,188 | 1,265 (106%) | R+66.4 | −5.6 |
| Hemphill | R+75.8 | R+58.4 | 1,356 | 1,244 (92%) | R+56.2 | +2.2 * |
| Kinney ✓ | R+50.5 | R+33.1 | 1,183 | 1,229 (104%) | R+28.7 | +4.3 |
| Baylor | R+77.0 | R+59.6 | 1,305 | 1,204 (92%) | R+65.7 | −6.1 * |
| Garza ✓ | R+72.6 | R+55.1 | 1,199 | 1,160 (97%) | R+56.2 | −1.1 |
| Sutton | R+67.1 | R+49.7 | 1,156 | 1,092 (94%) | R+47.6 | +2.1 * |
| Dallam ✓ | R+78.4 | R+61.0 | 1,045 | 1,021 (98%) | R+50.0 | +10.9 |
| Jeff Davis ✓ | R+21.3 | R+3.9 | 1,046 | 1,011 (97%) | R+4.8 | −0.9 |
| Crane | R+72.7 | R+55.3 | 1,141 | 1,009 (88%) | R+40.3 | +14.9 * |
| Knox ✓ | R+68.6 | R+51.1 | 1,034 | 1,007 (97%) | R+49.9 | +1.3 |
| Concho ✓ | R+74.0 | R+56.6 | 939 | 993 (106%) | R+58.0 | −1.4 |
| Crockett | R+53.9 | R+36.5 | 1,259 | 988 (78%) | R+29.3 | +7.2 * |
| Hardeman ✓ | R+72.8 | R+55.4 | 983 | 974 (99%) | R+58.3 | −2.9 |
| Collingsworth ✓ | R+77.6 | R+60.2 | 925 | 950 (103%) | R+66.6 | −6.4 |
| Lipscomb ✓ | R+79.7 | R+62.3 | 975 | 933 (96%) | R+67.5 | −5.2 |
| Schleicher | R+64.6 | R+47.1 | 1,001 | 915 (91%) | R+44.9 | +2.2 * |
| Culberson ✓ | R+16.9 | D+0.5 | 725 | 867 (120%) | D+22.1 | +21.6 |
| Armstrong ✓ | R+85.6 | R+68.2 | 900 | 862 (96%) | R+75.6 | −7.5 |
| Upton | R+77.1 | R+59.7 | 1,042 | 859 (82%) | R+54.4 | +5.3 * |
| Hall | R+73.4 | R+56.0 | 876 | 826 (94%) | R+61.0 | −5.0 * |
| Edwards ✓ | R+73.3 | R+55.9 | 814 | 805 (99%) | R+56.0 | −0.1 |
| Hudspeth | R+46.1 | R+28.7 | 860 | 801 (93%) | R+15.0 | +13.7 * |
| Menard ✓ | R+66.5 | R+49.1 | 774 | 784 (101%) | R+49.9 | −0.8 |
| Dickens | R+70.4 | R+52.9 | 790 | 748 (95%) | R+58.7 | −5.8 * |
| Oldham ✓ | R+84.4 | R+67.0 | 767 | 744 (97%) | R+71.4 | −4.4 |
| Sherman ✓ | R+83.3 | R+65.8 | 707 | 704 (100%) | R+62.5 | +3.3 |
| Reagan ✓ | R+69.5 | R+52.1 | 710 | 701 (99%) | R+38.4 | +13.7 |
| Cochran ✓ | R+65.8 | R+48.4 | 614 | 694 (113%) | R+36.0 | +12.4 |
| Irion | R+75.7 | R+58.2 | 695 | 643 (93%) | R+66.6 | −8.3 * |
| Throckmorton | R+83.4 | R+66.0 | 667 | 618 (93%) | R+69.9 | −3.9 * |
| Briscoe ✓ | R+79.8 | R+62.4 | 590 | 592 (100%) | R+70.1 | −7.7 |
| Glasscock ✓ | R+88.4 | R+70.9 | 571 | 557 (98%) | R+78.8 | −7.9 |
| Cottle ✓ | R+72.6 | R+55.1 | 514 | 535 (104%) | R+60.4 | −5.2 |
| Motley ✓ | R+88.9 | R+71.5 | 505 | 516 (102%) | R+80.6 | −9.1 |
| Stonewall | R+69.5 | R+52.1 | 564 | 510 (90%) | R+61.2 | −9.1 * |
| Roberts ✓ | R+92.3 | R+74.9 | 443 | 453 (102%) | R+84.8 | −9.9 |
| Sterling ✓ | R+86.0 | R+68.6 | 446 | 449 (101%) | R+67.9 | +0.6 |
| Foard | R+65.4 | R+48.0 | 527 | 407 (77%) | R+53.1 | −5.1 * |
| McMullen ✓ | R+84.6 | R+67.1 | 372 | 371 (100%) | R+72.2 | −5.1 |
| Kent ✓ | R+76.4 | R+59.0 | 348 | 368 (106%) | R+63.3 | −4.3 |
| Terrell | R+55.2 | R+37.8 | 426 | 339 (80%) | R+38.9 | −1.2 * |
| Borden ✓ | R+91.7 | R+74.3 | 317 | 306 (97%) | R+83.3 | −9.1 |
| Kenedy ✓ | R+46.8 | R+29.4 | 152 | 159 (105%) | R+11.9 | +17.5 |
| King ✓ | R+91.1 | R+73.7 | 103 | 116 (113%) | R+84.5 | −10.8 |
| Loving | R+78.4 | R+60.9 | 77 | 67 (87%) | R+61.2 | −0.3 * |
Gap: + is better for the Democrat than we expected, − better for the Republican. ≡ compared method by method; * whole county, not yet complete (skewed by count order, left out of the race's read).
Alaska Senate Mary Peltola v Dan S. Sullivan · our forecast D+3.2, 71% Democrat · totals only
| County | 2024 president | Expected tonight | Expected votes | Counted | Counted margin | Gap |
|---|---|---|---|---|---|---|
| House District 6 | R+16.8 | D+0.2 | 8,623 | 7,858 (91%) | R+5.0 | −5.2 * |
| House District 9 | D+2.3 | D+19.4 | 8,587 | 7,562 (88%) | D+1.7 | −17.6 * |
| House District 25 ✓ | R+37.0 | R+20.0 | 7,560 | 7,505 (99%) | R+23.4 | −3.4 |
| House District 8 | R+51.1 | R+34.0 | 7,908 | 7,030 (89%) | R+45.4 | −11.4 * |
| House District 35 ✓ | D+5.3 | D+22.3 | 6,972 | 6,916 (99%) | D+17.8 | −4.5 |
| House District 23 | R+19.4 | R+2.4 | 7,676 | 6,821 (89%) | R+9.6 | −7.2 * |
| House District 24 | R+33.4 | R+16.4 | 7,299 | 6,677 (91%) | R+24.1 | −7.6 * |
| House District 29 | R+46.5 | R+29.5 | 7,607 | 6,651 (87%) | R+37.0 | −7.5 * |
| House District 26 ✓ | R+56.0 | R+39.0 | 6,879 | 6,595 (96%) | R+43.7 | −4.7 |
| House District 34 | R+21.6 | R+4.6 | 7,208 | 6,552 (91%) | R+6.6 | −1.9 * |
| House District 7 | R+45.9 | R+28.9 | 6,979 | 6,468 (93%) | R+32.2 | −3.3 * |
| House District 11 | R+2.4 | D+14.6 | 7,135 | 6,272 (88%) | R+3.4 | −18.0 * |
| House District 16 | D+15.3 | D+32.3 | 6,967 | 6,259 (90%) | D+21.5 | −10.7 * |
| House District 3 | D+15.4 | D+32.4 | 7,983 | 6,221 (78%) | D+25.2 | −7.1 * |
| House District 28 | R+50.4 | R+33.4 | 6,706 | 6,208 (93%) | R+38.3 | −4.9 * |
| House District 21 | D+8.4 | D+25.4 | 6,532 | 6,174 (95%) | D+17.2 | −8.2 * |
| House District 15 | R+2.6 | D+14.4 | 6,730 | 6,169 (92%) | D+3.2 | −11.2 * |
| House District 36 | R+22.8 | R+5.8 | 6,890 | 5,960 (87%) | R+2.7 | +3.2 * |
| House District 33 | R+52.9 | R+35.9 | 6,434 | 5,941 (92%) | R+40.1 | −4.2 * |
| House District 10 | R+3.4 | D+13.6 | 6,331 | 5,801 (92%) | D+4.0 | −9.6 * |
| House District 27 | R+57.9 | R+40.9 | 6,455 | 5,750 (89%) | R+43.9 | −3.0 * |
| House District 4 | D+39.2 | D+56.2 | 6,650 | 5,745 (86%) | D+52.8 | −3.4 * |
| House District 30 | R+46.1 | R+29.0 | 7,522 | 5,528 (73%) | R+41.8 | −12.8 * |
| House District 12 | D+1.3 | D+18.3 | 6,181 | 5,263 (85%) | D+8.9 | −9.5 * |
| House District 17 | D+34.9 | D+51.9 | 5,557 | 5,018 (90%) | D+46.7 | −5.2 * |
| House District 13 | D+1.3 | D+18.3 | 5,462 | 4,691 (86%) | D+15.3 | −3.0 * |
| House District 1 | R+18.2 | R+1.2 | 6,181 | 4,654 (75%) | R+10.4 | −9.2 * |
| House District 20 | D+12.7 | D+29.7 | 5,233 | 4,554 (87%) | D+24.5 | −5.2 * |
| House District 31 | R+3.5 | D+13.5 | 5,045 | 4,546 (90%) | D+12.4 | −1.1 * |
| House District 14 | D+22.2 | D+39.2 | 5,345 | 4,526 (85%) | D+31.1 | −8.1 * |
| House District 2 | D+0.4 | D+17.4 | 6,840 | 4,372 (64%) | D+14.1 | −3.3 * |
| House District 5 | R+13.3 | D+3.7 | 5,769 | 3,966 (69%) | D+2.4 | −1.3 * |
| House District 22 | D+1.3 | D+18.3 | 3,947 | 3,572 (90%) | D+21.6 | +3.4 * |
| House District 39 ✓ | D+12.7 | D+29.7 | 2,907 | 3,496 (120%) | D+50.8 | +21.1 |
| House District 19 | D+17.8 | D+34.8 | 3,603 | 3,309 (92%) | D+37.5 | +2.7 * |
| House District 32 | R+33.0 | R+16.0 | 4,226 | 3,137 (74%) | R+12.0 | +4.1 * |
| House District 37 | R+7.0 | D+10.1 | 3,102 | 2,935 (95%) | D+23.3 | +13.2 * |
| House District 38 ✓ | D+13.1 | D+30.1 | 2,694 | 2,792 (104%) | D+58.7 | +28.6 |
| House District 40 ✓ | R+10.7 | D+6.3 | 2,291 | 2,486 (108%) | D+27.6 | +21.2 |
| House District 18 | R+16.4 | D+0.6 | 3,466 | 1,624 (47%) | D+17.3 | +16.7 * |
Gap: + is better for the Democrat than we expected, − better for the Republican. ≡ compared method by method; * whole county, not yet complete (skewed by count order, left out of the race's read).
Louisiana Senate Jamie Davis v Julia Letlow · our forecast R+4.4, 75% Republican · totals only
| County | 2024 president | Expected tonight | Expected votes | Counted | Counted margin | Gap |
|---|---|---|---|---|---|---|
| East Baton Rouge ✓ | D+13.9 | D+30.7 | 137,079 | 152,163 (111%) | D+28.7 | −2.0 |
| Orleans ✓ | D+61.6 | D+78.4 | 111,117 | 131,987 (119%) | D+77.2 | −1.2 |
| Jefferson ✓ | R+17.1 | R+0.4 | 118,183 | 130,861 (111%) | D+7.4 | +7.8 |
| St. Tammany ✓ | R+45.7 | R+29.0 | 94,655 | 101,613 (107%) | R+25.9 | +3.1 |
| Lafayette ✓ | R+28.7 | R+12.0 | 72,444 | 79,454 (110%) | R+10.3 | +1.6 |
| Caddo ✓ | D+6.8 | D+23.6 | 66,349 | 71,509 (108%) | D+17.9 | −5.6 |
| Calcasieu ✓ | R+36.9 | R+20.2 | 53,673 | 55,921 (104%) | R+18.7 | +1.5 |
| Ouachita ✓ | R+22.4 | R+5.7 | 42,920 | 46,242 (108%) | R+10.1 | −4.4 |
| Livingston ✓ | R+69.0 | R+52.2 | 42,271 | 43,528 (103%) | R+45.1 | +7.1 |
| Ascension ✓ | R+33.1 | R+16.3 | 40,776 | 42,945 (105%) | R+8.9 | +7.4 |
| Tangipahoa ✓ | R+36.3 | R+19.6 | 35,489 | 39,531 (111%) | R+17.6 | +2.0 |
| Rapides ✓ | R+40.3 | R+23.5 | 39,079 | 37,494 (96%) | R+16.3 | +7.2 |
| Bossier ✓ | R+38.8 | R+22.1 | 32,181 | 35,805 (111%) | R+29.4 | −7.3 |
| Lafourche | R+60.0 | R+43.2 | 30,177 | 28,534 (95%) | R+41.0 | +2.2 * |
| Terrebonne ✓ | R+50.3 | R+33.6 | 27,366 | 28,417 (104%) | R+34.1 | −0.5 |
| St. Landry ✓ | R+21.8 | R+5.1 | 26,942 | 26,435 (98%) | D+3.1 | +8.2 |
| Iberia ✓ | R+31.4 | R+14.6 | 19,632 | 19,322 (98%) | R+15.5 | −0.9 |
| St. Charles ✓ | R+31.8 | R+15.1 | 18,016 | 18,661 (104%) | R+10.2 | +4.9 |
| Acadia | R+63.4 | R+46.7 | 19,647 | 18,050 (92%) | R+47.9 | −1.2 * |
| Vermilion ✓ | R+63.3 | R+46.5 | 17,953 | 17,365 (97%) | R+44.0 | +2.6 |
| St. Martin ✓ | R+32.3 | R+15.6 | 17,144 | 17,081 (100%) | R+21.9 | −6.3 |
| St. Mary ✓ | R+26.8 | R+10.0 | 14,461 | 14,875 (103%) | R+13.3 | −3.3 |
| St. John the Baptist ✓ | D+27.1 | D+43.8 | 11,643 | 14,206 (122%) | D+47.0 | +3.2 |
| Lincoln ✓ | R+26.5 | R+9.8 | 12,583 | 13,739 (109%) | R+12.1 | −2.4 |
| Washington ✓ | R+39.7 | R+23.0 | 13,171 | 13,044 (99%) | R+19.1 | +3.9 |
| Avoyelles ✓ | R+45.3 | R+28.5 | 11,422 | 12,247 (107%) | R+25.0 | +3.5 |
| Iberville ✓ | D+5.7 | D+22.5 | 12,154 | 12,140 (100%) | D+17.9 | −4.5 |
| Webster ✓ | R+35.6 | R+18.9 | 11,990 | 11,859 (99%) | R+21.6 | −2.7 |
| St. Bernard ✓ | R+27.9 | R+11.2 | 10,739 | 11,508 (107%) | D+0.1 | +11.3 |
| Natchitoches ✓ | R+25.3 | R+8.5 | 10,294 | 11,234 (109%) | R+3.1 | +5.4 |
| Vernon ✓ | R+74.4 | R+57.7 | 11,239 | 11,022 (98%) | R+52.2 | +5.5 |
| Jefferson Davis ✓ | R+61.7 | R+44.9 | 10,109 | 10,362 (103%) | R+39.9 | +5.0 |
| Evangeline | R+48.8 | R+32.0 | 11,116 | 10,298 (93%) | R+21.2 | +10.8 * |
| Beauregard | R+78.9 | R+62.1 | 10,830 | 10,246 (95%) | R+55.9 | +6.2 * |
| West Baton Rouge ✓ | R+3.7 | D+13.1 | 10,104 | 10,030 (99%) | D+10.5 | −2.6 |
| De Soto ✓ | R+31.6 | R+14.8 | 9,247 | 9,916 (107%) | R+17.6 | −2.7 |
| St. James ✓ | D+8.9 | D+25.6 | 8,838 | 9,286 (105%) | D+14.1 | −11.5 |
| Pointe Coupee | R+30.4 | R+13.7 | 9,631 | 8,347 (87%) | R+6.2 | +7.5 * |
| Plaquemines ✓ | R+24.9 | R+8.2 | 7,869 | 7,801 (99%) | R+18.3 | −10.2 |
| Sabine ✓ | R+67.8 | R+51.0 | 7,488 | 7,776 (104%) | R+54.5 | −3.4 |
| Union ✓ | R+55.0 | R+38.3 | 7,680 | 7,444 (97%) | R+45.0 | −6.7 |
| East Feliciana ✓ | R+24.7 | R+7.9 | 7,430 | 7,385 (99%) | R+8.3 | −0.3 |
| Assumption | R+41.1 | R+24.3 | 7,655 | 7,075 (92%) | R+11.5 | +12.8 * |
| Morehouse ✓ | R+6.4 | D+10.3 | 7,189 | 6,982 (97%) | R+1.4 | −11.7 |
| Allen ✓ | R+63.5 | R+46.7 | 6,386 | 6,537 (102%) | R+38.0 | +8.7 |
| Grant ✓ | R+81.0 | R+64.3 | 6,350 | 6,418 (101%) | R+61.3 | +3.0 |
| Richland | R+32.3 | R+15.6 | 6,719 | 6,137 (91%) | R+18.2 | −2.6 * |
| Franklin | R+36.1 | R+19.3 | 6,149 | 5,771 (94%) | R+26.8 | −7.5 * |
| Concordia ✓ | R+17.7 | R+0.9 | 5,947 | 5,755 (97%) | R+5.5 | −4.5 |
| Jackson ✓ | R+44.1 | R+27.3 | 5,670 | 5,588 (99%) | R+28.8 | −1.5 |
| Bienville ✓ | R+24.9 | R+8.1 | 4,769 | 4,990 (105%) | D+2.9 | +11.0 |
| Claiborne ✓ | R+12.9 | D+3.8 | 4,425 | 4,712 (106%) | R+10.5 | −14.3 |
| West Feliciana ✓ | R+28.4 | R+11.6 | 4,277 | 4,709 (110%) | R+20.2 | −8.6 |
| St. Helena ✓ | D+1.1 | D+17.8 | 4,170 | 4,564 (109%) | D+16.8 | −1.0 |
| La Salle | R+82.7 | R+65.9 | 4,983 | 4,395 (88%) | R+68.1 | −2.1 * |
| Winn ✓ | R+47.2 | R+30.5 | 3,998 | 4,167 (104%) | R+38.8 | −8.3 |
| Catahoula | R+43.1 | R+26.4 | 3,568 | 3,165 (89%) | R+22.9 | +3.5 * |
| Caldwell ✓ | R+70.0 | R+53.3 | 3,219 | 3,139 (98%) | R+56.7 | −3.4 |
| Madison ✓ | D+7.4 | D+24.2 | 2,726 | 3,050 (112%) | D+19.5 | −4.7 |
| West Carroll | R+66.1 | R+49.3 | 3,389 | 2,818 (83%) | R+59.1 | −9.8 * |
| Red River ✓ | R+29.4 | R+12.7 | 2,488 | 2,566 (103%) | R+3.4 | +9.3 |
| East Carroll ✓ | D+30.6 | D+47.4 | 1,983 | 2,084 (105%) | D+27.9 | −19.4 |
| Cameron | R+88.1 | R+71.3 | 2,447 | 1,957 (80%) | R+72.0 | −0.7 * |
| Tensas ✓ | D+6.0 | D+22.8 | 1,652 | 1,807 (109%) | D+22.3 | −0.5 |
Gap: + is better for the Democrat than we expected, − better for the Republican. ≡ compared method by method; * whole county, not yet complete (skewed by count order, left out of the race's read).
Ohio governor Amy Acton v Vivek Ramaswamy · our forecast D+4.6, 77% Democrat · count split by method
| County | 2024 president | Expected tonight | Expected votes | Counted | Counted margin | Gap |
|---|---|---|---|---|---|---|
| Franklin ✓ | D+28.4 | D+44.0 | 425,246 | 505,844 (119%) | D+45.9 | +1.9 |
| Cuyahoga ✓ | D+31.5 | D+47.1 | 409,773 | 475,835 (116%) | D+46.9 | −0.2 |
| Hamilton ✓ | D+14.9 | D+30.5 | 303,600 | 342,523 (113%) | D+28.6 | −1.9 |
| Summit ✓ | D+7.0 | D+22.6 | 199,835 | 225,392 (113%) | D+25.8 | +3.2 |
| Montgomery ✓ | D+0.5 | D+16.1 | 186,826 | 202,332 (108%) | D+18.0 | +1.9 |
| Lucas ✓ | D+12.5 | D+28.2 | 132,730 | 152,512 (115%) | D+29.3 | +1.1 |
| Butler ✓ | R+26.3 | R+10.6 | 128,249 | 146,636 (114%) | R+7.7 | +2.9 |
| Stark ✓ | R+21.9 | R+6.3 | 133,502 | 144,606 (108%) | R+2.0 | +4.3 |
| Lorain ✓ | R+5.7 | D+9.9 | 111,679 | 129,692 (116%) | D+14.0 | +4.1 |
| Delaware ✓ | R+6.6 | D+9.0 | 98,858 | 117,101 (118%) | D+8.3 | −0.8 |
| Warren ✓ | R+31.5 | R+15.9 | 101,415 | 112,794 (111%) | R+15.5 | +0.4 |
| Lake ✓ | R+14.3 | D+1.3 | 94,219 | 105,775 (112%) | D+5.1 | +3.8 |
| Clermont ✓ | R+35.8 | R+20.2 | 80,041 | 89,360 (112%) | R+17.7 | +2.4 |
| Mahoning ✓ | R+9.4 | D+6.2 | 85,818 | 88,421 (103%) | D+11.8 | +5.6 |
| Medina ✓ | R+24.8 | R+9.2 | 77,939 | 85,394 (110%) | R+6.2 | +3.0 |
| Trumbull ✓ | R+16.8 | R+1.2 | 72,972 | 74,012 (101%) | D+7.1 | +8.3 |
| Licking ✓ | R+30.0 | R+14.4 | 66,340 | 73,973 (112%) | R+8.4 | +6.0 |
| Greene ✓ | R+19.8 | R+4.2 | 65,895 | 73,891 (112%) | R+3.9 | +0.3 |
| Fairfield ✓ | R+24.0 | R+8.4 | 59,231 | 68,161 (115%) | R+3.1 | +5.3 |
| Portage ✓ | R+15.5 | D+0.1 | 60,449 | 65,950 (109%) | D+6.3 | +6.2 |
| Wood ✓ | R+10.1 | D+5.5 | 48,459 | 54,502 (112%) | D+9.1 | +3.6 |
| Clark ✓ | R+29.5 | R+13.9 | 44,272 | 47,915 (108%) | R+10.4 | +3.5 |
| Miami ✓ | R+45.1 | R+29.5 | 42,161 | 45,524 (108%) | R+27.8 | +1.7 |
| Geauga ✓ | R+24.1 | R+8.5 | 42,679 | 45,075 (106%) | R+8.1 | +0.4 |
| Richland ✓ | R+42.3 | R+26.7 | 41,716 | 43,948 (105%) | R+24.8 | +1.9 |
| Wayne ✓ | R+39.2 | R+23.6 | 38,431 | 41,259 (107%) | R+22.1 | +1.5 |
| Allen ✓ | R+44.1 | R+28.5 | 32,657 | 35,230 (108%) | R+29.9 | −1.4 |
| Columbiana ✓ | R+49.0 | R+33.4 | 35,534 | 34,746 (98%) | R+28.8 | +4.6 |
| Ashtabula ✓ | R+28.4 | R+12.8 | 30,838 | 32,483 (105%) | R+6.6 | +6.1 |
| Tuscarawas ✓ | R+43.3 | R+27.6 | 30,339 | 31,981 (105%) | R+21.3 | +6.4 |
| Erie ✓ | R+14.1 | D+1.5 | 28,887 | 31,876 (110%) | D+3.8 | +2.3 |
| Union ✓ | R+29.6 | R+14.0 | 25,395 | 31,174 (123%) | R+10.5 | +3.5 |
| Hancock ✓ | R+38.4 | R+22.8 | 27,102 | 28,836 (106%) | R+20.3 | +2.5 |
| Muskingum ✓ | R+43.9 | R+28.3 | 27,302 | 28,696 (105%) | R+24.2 | +4.1 |
| Ross ✓ | R+39.3 | R+23.7 | 22,586 | 24,602 (109%) | R+19.2 | +4.5 |
| Knox ✓ | R+44.9 | R+29.3 | 23,073 | 24,065 (104%) | R+29.2 | +0.1 |
| Washington ✓ | R+43.7 | R+28.1 | 22,750 | 22,641 (100%) | R+22.1 | +6.1 |
| Sandusky ✓ | R+30.9 | R+15.2 | 21,343 | 22,571 (106%) | R+10.4 | +4.9 |
| Pickaway ✓ | R+48.5 | R+32.9 | 19,555 | 22,083 (113%) | R+27.5 | +5.4 |
| Belmont ✓ | R+47.3 | R+31.7 | 22,525 | 21,949 (97%) | R+26.8 | +4.9 |
| Jefferson | R+43.9 | R+28.3 | 22,884 | 21,718 (95%) | R+24.2 | +4.0 * |
| Scioto ✓ | R+47.9 | R+32.3 | 21,067 | 21,507 (102%) | R+25.2 | +7.1 |
| Athens ✓ | D+10.7 | D+26.4 | 19,075 | 20,342 (107%) | D+34.0 | +7.7 |
| Darke ✓ | R+65.3 | R+49.7 | 19,750 | 19,986 (101%) | R+51.6 | −1.9 |
| Marion ✓ | R+41.4 | R+25.7 | 19,102 | 19,897 (104%) | R+18.7 | +7.0 |
| Ashland ✓ | R+49.9 | R+34.3 | 18,400 | 19,863 (108%) | R+32.1 | +2.3 |
| Huron ✓ | R+44.0 | R+28.4 | 18,396 | 19,644 (107%) | R+22.2 | +6.2 |
| Auglaize ✓ | R+64.5 | R+48.9 | 18,663 | 19,220 (103%) | R+51.3 | −2.4 |
| Ottawa ✓ | R+25.1 | R+9.4 | 18,483 | 19,203 (104%) | R+8.7 | +0.7 |
| Shelby ✓ | R+64.8 | R+49.2 | 18,021 | 18,920 (105%) | R+51.3 | −2.1 |
| Seneca ✓ | R+37.5 | R+21.9 | 17,986 | 18,717 (104%) | R+15.5 | +6.3 |
| Lawrence ✓ | R+50.5 | R+34.9 | 17,490 | 18,027 (103%) | R+27.7 | +7.2 |
| Mercer ✓ | R+66.7 | R+51.1 | 17,779 | 18,003 (101%) | R+55.3 | −4.2 |
| Logan ✓ | R+56.2 | R+40.6 | 16,449 | 17,775 (108%) | R+38.7 | +1.9 |
| Fulton ✓ | R+42.4 | R+26.8 | 16,332 | 17,343 (106%) | R+24.1 | +2.7 |
| Madison ✓ | R+43.6 | R+28.0 | 14,113 | 16,243 (115%) | R+23.6 | +4.4 |
| Champaign ✓ | R+50.7 | R+35.1 | 14,348 | 15,525 (108%) | R+30.6 | +4.5 |
| Clinton ✓ | R+54.6 | R+39.0 | 14,077 | 15,433 (110%) | R+37.5 | +1.5 |
| Putnam ✓ | R+68.7 | R+53.1 | 14,999 | 15,368 (102%) | R+56.5 | −3.4 |
| Preble ✓ | R+59.1 | R+43.5 | 15,689 | 15,302 (98%) | R+41.1 | +2.4 |
| Brown ✓ | R+61.5 | R+45.9 | 14,132 | 14,946 (106%) | R+40.8 | +5.1 |
| Crawford ✓ | R+52.9 | R+37.3 | 14,803 | 14,678 (99%) | R+33.8 | +3.5 |
| Defiance ✓ | R+39.8 | R+24.2 | 13,334 | 14,556 (109%) | R+21.7 | +2.5 |
| Highland ✓ | R+63.3 | R+47.7 | 13,110 | 14,245 (109%) | R+43.6 | +4.1 |
| Morrow ✓ | R+55.7 | R+40.1 | 13,288 | 14,105 (106%) | R+37.4 | +2.7 |
| Williams ✓ | R+48.2 | R+32.6 | 12,874 | 13,456 (105%) | R+30.4 | +2.2 |
| Guernsey ✓ | R+52.0 | R+36.4 | 12,183 | 12,692 (104%) | R+31.0 | +5.4 |
| Perry ✓ | R+54.5 | R+38.9 | 11,899 | 12,479 (105%) | R+31.7 | +7.2 |
| Coshocton ✓ | R+52.2 | R+36.6 | 11,276 | 11,707 (104%) | R+30.7 | +5.9 |
| Henry ✓ | R+46.7 | R+31.1 | 10,386 | 11,157 (107%) | R+29.8 | +1.3 |
| Van Wert ✓ | R+58.5 | R+42.9 | 10,135 | 10,496 (104%) | R+43.5 | −0.6 |
| Carroll ✓ | R+54.7 | R+39.1 | 10,115 | 10,255 (101%) | R+36.7 | +2.4 |
| Wyandot ✓ | R+51.2 | R+35.6 | 8,095 | 9,838 (122%) | R+32.9 | +2.7 |
| Jackson ✓ | R+58.0 | R+42.4 | 8,884 | 9,734 (110%) | R+33.3 | +9.2 |
| Hocking ✓ | R+44.3 | R+28.7 | 9,492 | 9,691 (102%) | R+21.8 | +6.8 |
| Hardin ✓ | R+54.6 | R+39.0 | 8,992 | 9,080 (101%) | R+34.6 | +4.5 |
| Fayette ✓ | R+55.1 | R+39.5 | 8,389 | 9,053 (108%) | R+36.7 | +2.8 |
| Paulding ✓ | R+56.2 | R+40.6 | 6,460 | 8,922 (138%) | R+35.9 | +4.7 |
| Adams ✓ | R+65.7 | R+50.1 | 8,743 | 8,891 (102%) | R+42.9 | +7.2 |
| Holmes ✓ | R+69.1 | R+53.5 | 8,620 | 8,852 (103%) | R+55.7 | −2.2 |
| Gallia | R+59.4 | R+43.8 | 9,109 | 8,629 (95%) | R+40.3 | +3.5 * |
| Pike ✓ | R+53.7 | R+38.0 | 7,815 | 8,520 (109%) | R+30.4 | +7.6 |
| Meigs ✓ | R+56.9 | R+41.3 | 7,464 | 7,518 (101%) | R+36.1 | +5.2 |
| Harrison ✓ | R+55.2 | R+39.6 | 5,172 | 5,010 (97%) | R+34.0 | +5.6 |
| Morgan ✓ | R+53.2 | R+37.6 | 4,811 | 4,783 (99%) | R+32.6 | +5.0 |
| Monroe ✓ | R+59.7 | R+44.1 | 4,857 | 4,761 (98%) | R+38.1 | +6.0 |
| Noble ✓ | R+64.6 | R+49.0 | 4,602 | 4,440 (96%) | R+44.9 | +4.1 |
| Vinton ✓ | R+58.6 | R+43.0 | 4,014 | 3,892 (97%) | R+36.5 | +6.5 |
Gap: + is better for the Democrat than we expected, − better for the Republican. ≡ compared method by method; * whole county, not yet complete (skewed by count order, left out of the race's read).
New Hampshire governor Cinde Warmington v Kelly Ayotte · our forecast R+5.6, 80% Republican · totals only
| County | 2024 president | Expected tonight | Expected votes | Counted | Counted margin | Gap |
|---|---|---|---|---|---|---|
| Hillsborough ✓ | D+2.9 | R+5.5 | 172,224 | 175,703 (102%) | R+4.8 | +0.7 |
| Rockingham ✓ | R+2.4 | R+10.8 | 154,290 | 157,180 (102%) | R+11.0 | −0.2 |
| Merrimack ✓ | D+5.2 | R+3.2 | 70,793 | 72,031 (102%) | D+0.5 | +3.7 |
| Strafford ✓ | D+12.0 | D+3.7 | 56,578 | 57,652 (102%) | D+8.5 | +4.8 |
| Grafton ✓ | D+19.8 | D+11.5 | 42,732 | 43,303 (101%) | D+12.6 | +1.1 |
| Cheshire ✓ | D+9.9 | D+1.6 | 33,986 | 34,188 (101%) | D+10.2 | +8.6 |
| Belknap ✓ | R+13.0 | R+21.4 | 30,781 | 30,474 (99%) | R+25.2 | −3.8 |
| Carroll ✓ | R+1.7 | R+10.1 | 27,124 | 28,138 (104%) | R+13.0 | −2.9 |
| Sullivan ✓ | R+0.7 | R+9.0 | 19,108 | 19,306 (101%) | R+6.1 | +3.0 |
| Coos ✓ | R+13.7 | R+22.0 | 12,895 | 13,358 (104%) | R+22.9 | −0.9 |
Gap: + is better for the Democrat than we expected, − better for the Republican. ≡ compared method by method; * whole county, not yet complete (skewed by count order, left out of the race's read).
Maine Senate Troy Jackson v Susan Collins · our forecast D+5.7, 81% Democrat · totals only
| County | 2024 president | Expected tonight | Expected votes | Counted | Counted margin | Gap |
|---|---|---|---|---|---|---|
| Cumberland ✓ | D+35.8 | D+34.2 | 161,851 | 174,891 (108%) | D+34.8 | +0.6 |
| York ✓ | D+10.9 | D+9.4 | 104,428 | 112,472 (108%) | D+10.9 | +1.6 |
| Penobscot ✓ | R+10.4 | R+12.0 | 68,647 | 68,920 (100%) | R+12.5 | −0.5 |
| Kennebec ✓ | R+2.3 | R+3.8 | 60,346 | 62,756 (104%) | R+6.5 | −2.6 |
| Androscoggin ✓ | R+5.6 | R+7.2 | 47,019 | 50,398 (107%) | R+8.7 | −1.5 |
| Hancock ✓ | D+12.2 | D+10.7 | 30,535 | 31,503 (103%) | D+9.6 | −1.1 |
| Oxford ✓ | R+12.4 | R+14.0 | 27,735 | 31,004 (112%) | R+17.6 | −3.7 |
| Aroostook | R+25.7 | R+27.3 | 28,632 | 26,443 (92%) | R+30.0 | −2.7 * |
| Somerset ✓ | R+26.6 | R+28.1 | 22,816 | 22,537 (99%) | R+31.2 | −3.1 |
| Sagadahoc ✓ | D+17.1 | D+15.5 | 20,842 | 22,082 (106%) | D+15.0 | −0.6 |
| Knox ✓ | D+19.1 | D+17.5 | 22,256 | 21,629 (97%) | D+17.0 | −0.5 |
| Lincoln ✓ | D+11.7 | D+10.2 | 20,946 | 20,966 (100%) | D+8.8 | −1.4 |
| Waldo ✓ | D+3.8 | D+2.3 | 21,007 | 20,562 (98%) | D+4.4 | +2.2 |
| Franklin ✓ | R+7.8 | R+9.3 | 14,928 | 14,776 (99%) | R+11.8 | −2.5 |
| Washington | R+23.0 | R+24.6 | 14,777 | 13,473 (91%) | R+24.7 | −0.2 * |
| Piscataquis | R+28.7 | R+30.2 | 8,216 | 7,766 (95%) | R+35.9 | −5.7 * |
Gap: + is better for the Democrat than we expected, − better for the Republican. ≡ compared method by method; * whole county, not yet complete (skewed by count order, left out of the race's read).
Idaho Senate Todd Achilles v Jim Risch · our forecast R+12.6, 82% Republican · totals only
| County | 2024 president | Expected tonight | Expected votes | Counted | Counted margin | Gap |
|---|---|---|---|---|---|---|
| Ada | R+10.3 | I+12.5 | 370,458 | 226,077 (61%) | I+2.9 | −9.6 * |
| Canyon | R+46.6 | R+23.8 | 116,658 | 77,045 (66%) | R+31.9 | −8.1 * |
| Kootenai | R+51.8 | R+29.0 | 124,592 | 74,167 (60%) | R+46.0 | −17.0 * |
| Bonneville | R+45.4 | R+22.5 | 70,974 | 42,902 (60%) | R+27.1 | −4.6 * |
| Bannock | R+25.1 | R+2.3 | 51,002 | 31,330 (61%) | R+10.8 | −8.5 * |
| Twin Falls | R+48.8 | R+26.0 | 45,986 | 27,748 (60%) | R+31.5 | −5.6 * |
| Bonner | R+46.1 | R+23.3 | 41,588 | 23,590 (57%) | R+37.3 | −14.0 * |
| Bingham | R+59.6 | R+36.8 | 24,768 | 15,298 (62%) | R+43.0 | −6.2 * |
| Latah | R+8.0 | I+14.8 | 29,946 | 15,230 (51%) | R+9.6 | −24.4 * |
| Nez Perce | R+38.6 | R+15.8 | 26,962 | 14,864 (55%) | R+31.4 | −15.6 * |
| Jefferson | R+73.3 | R+50.4 | 18,178 | 11,547 (64%) | R+57.4 | −7.0 * |
| Madison | R+64.3 | R+41.5 | 16,672 | 11,468 (69%) | R+49.4 | −8.0 * |
| Blaine | D+31.7 | I+54.5 | 19,440 | 11,453 (59%) | I+42.1 | −12.3 * |
| Payette | R+62.9 | R+40.1 | 15,218 | 8,686 (57%) | R+51.7 | −11.7 * |
| Gem | R+66.0 | R+43.2 | 15,262 | 8,196 (54%) | R+56.6 | −13.4 * |
| Idaho | R+67.8 | R+45.0 | 14,940 | 7,897 (53%) | R+60.6 | −15.7 * |
| Elmore | R+48.5 | R+25.7 | 13,260 | 7,518 (57%) | R+35.1 | −9.4 * |
| Cassia | R+69.1 | R+46.2 | 11,604 | 6,778 (58%) | R+54.9 | −8.6 * |
| Valley | R+18.6 | I+4.2 | 10,464 | 6,109 (58%) | R+2.6 | −6.8 * |
| Jerome | R+53.7 | R+30.9 | 9,716 | 6,086 (63%) | R+37.3 | −6.4 * |
| Teton | D+6.8 | I+29.7 | 9,384 | 6,012 (64%) | I+14.0 | −15.6 * |
| Minidoka | R+63.3 | R+40.4 | 9,442 | 5,909 (63%) | R+48.7 | −8.2 * |
| Boundary | R+65.4 | R+42.6 | 10,478 | 5,532 (53%) | R+58.8 | −16.2 * |
| Fremont | R+69.0 | R+46.1 | 8,524 | 4,850 (57%) | R+55.0 | −8.9 * |
| Franklin | R+77.6 | R+54.8 | 8,674 | 4,723 (54%) | R+57.4 | −2.6 * |
| Shoshone | R+49.4 | R+26.6 | 8,256 | 4,519 (55%) | R+43.3 | −16.8 * |
| Gooding | R+60.4 | R+37.6 | 8,102 | 4,348 (54%) | R+46.5 | −8.9 * |
| Washington | R+61.5 | R+38.7 | 7,848 | 4,335 (55%) | R+54.4 | −15.6 * |
| Benewah | R+61.4 | R+38.6 | 6,908 | 4,000 (58%) | R+60.9 | −22.3 * |
| Boise | R+54.2 | R+31.4 | 6,888 | 3,952 (57%) | R+39.8 | −8.4 * |
| Lemhi | R+54.9 | R+32.1 | 7,320 | 3,812 (52%) | R+43.9 | −11.8 * |
| Owyhee | R+67.6 | R+44.8 | 6,580 | 3,584 (54%) | R+55.6 | −10.8 * |
| Clearwater | R+62.8 | R+40.0 | 6,242 | 3,219 (52%) | R+56.8 | −16.8 * |
| Caribou | R+71.2 | R+48.4 | 4,240 | 2,504 (59%) | R+59.5 | −11.1 * |
| Power ✓ | R+45.1 | R+22.2 | 2,201 | 2,450 (111%) | R+36.5 | −14.3 |
| Bear Lake | R+77.1 | R+54.2 | 4,532 | 2,390 (53%) | R+70.7 | −16.5 * |
| Adams | R+54.5 | R+31.6 | 4,040 | 2,171 (54%) | R+42.2 | −10.5 * |
| Custer | R+53.3 | R+30.5 | 4,072 | 2,024 (50%) | R+43.0 | −12.5 * |
| Oneida | R+75.9 | R+53.1 | 3,254 | 1,631 (50%) | R+65.5 | −12.3 * |
| Lewis | R+64.9 | R+42.1 | 2,722 | 1,446 (53%) | R+59.9 | −17.8 * |
| Lincoln | R+56.0 | R+33.2 | 2,642 | 1,398 (53%) | R+37.3 | −4.1 * |
| Butte | R+72.5 | R+49.7 | 2,018 | 1,129 (56%) | R+57.9 | −8.2 * |
| Camas | R+54.1 | R+31.3 | 1,034 | 543 (53%) | R+32.8 | −1.5 * |
| Clark | R+69.1 | R+46.3 | 416 | 254 (61%) | R+61.0 | −14.8 * |
Gap: + is better for the independent than we expected, − better for the Republican. ≡ compared method by method; * whole county, not yet complete (skewed by count order, left out of the race's read).
Florida Senate (special) Angie Nixon v Ashley Moody · our forecast R+5.9, 83% Republican · totals only
| County | 2024 president | Expected tonight | Expected votes | Counted | Counted margin | Gap |
|---|---|---|---|---|---|---|
| Miami-Dade ✓ | R+11.5 | R+4.0 | 716,322 | 784,728 (110%) | D+7.1 | +11.1 |
| Broward ✓ | D+17.0 | D+24.4 | 600,976 | 660,314 (110%) | D+32.3 | +7.8 |
| Palm Beach ✓ | D+0.8 | D+8.2 | 545,550 | 570,658 (105%) | D+10.3 | +2.0 |
| Hillsborough ✓ | R+3.1 | D+4.4 | 484,916 | 517,016 (107%) | D+9.0 | +4.6 |
| Orange ✓ | D+13.6 | D+21.0 | 408,617 | 471,829 (115%) | D+28.5 | +7.5 |
| Pinellas ✓ | R+5.2 | D+2.2 | 424,549 | 403,626 (95%) | D+0.7 | −1.6 |
| Duval ✓ | R+1.5 | D+6.0 | 330,303 | 356,347 (108%) | D+10.8 | +4.9 |
| Lee ✓ | R+28.4 | R+20.9 | 276,081 | 304,021 (110%) | R+21.4 | −0.4 |
| Brevard ✓ | R+20.8 | R+13.4 | 268,335 | 270,072 (101%) | R+14.3 | −0.9 |
| Polk ✓ | R+20.7 | R+13.2 | 230,726 | 257,911 (112%) | R+6.7 | +6.6 |
| Pasco ✓ | R+25.2 | R+17.8 | 225,549 | 240,319 (107%) | R+14.2 | +3.5 |
| Volusia ✓ | R+21.8 | R+14.3 | 226,962 | 236,704 (104%) | R+15.6 | −1.3 |
| Sarasota ✓ | R+18.2 | R+10.7 | 219,514 | 223,509 (102%) | R+16.5 | −5.7 |
| Seminole ✓ | R+3.6 | D+3.9 | 183,816 | 195,588 (106%) | D+6.7 | +2.8 |
| Manatee ✓ | R+23.5 | R+16.0 | 172,183 | 182,260 (106%) | R+19.3 | −3.3 |
| Lake ✓ | R+24.7 | R+17.2 | 160,572 | 178,072 (111%) | R+18.4 | −1.2 |
| Collier ✓ | R+33.0 | R+25.6 | 164,265 | 171,729 (105%) | R+28.7 | −3.2 |
| Marion ✓ | R+31.7 | R+24.2 | 156,427 | 163,936 (105%) | R+25.8 | −1.6 |
| St. Johns ✓ | R+31.3 | R+23.8 | 145,011 | 156,111 (108%) | R+26.2 | −2.4 |
| St. Lucie ✓ | R+9.1 | R+1.6 | 122,361 | 139,080 (114%) | D+2.4 | +4.0 |
| Osceola ✓ | R+1.5 | D+6.0 | 103,173 | 131,845 (128%) | D+18.4 | +12.4 |
| Leon ✓ | D+21.7 | D+29.2 | 118,216 | 125,659 (106%) | D+31.4 | +2.2 |
| Escambia ✓ | R+19.5 | R+12.1 | 116,090 | 116,440 (100%) | R+9.7 | +2.4 |
| Alachua ✓ | D+20.9 | D+28.4 | 96,195 | 105,606 (110%) | D+33.1 | +4.7 |
| Charlotte ✓ | R+34.0 | R+26.5 | 92,933 | 100,544 (108%) | R+33.4 | −6.9 |
| Sumter ✓ | R+37.6 | R+30.2 | 89,668 | 95,037 (106%) | R+43.2 | −13.1 |
| Clay ✓ | R+39.3 | R+31.8 | 90,333 | 93,314 (103%) | R+30.1 | +1.7 |
| Hernando ✓ | R+37.1 | R+29.6 | 80,598 | 80,228 (100%) | R+29.3 | +0.3 |
| Okaloosa ✓ | R+42.4 | R+34.9 | 81,166 | 77,573 (96%) | R+35.0 | −0.1 |
| Indian River ✓ | R+27.3 | R+19.9 | 77,624 | 77,502 (100%) | R+22.9 | −3.0 |
| Martin ✓ | R+31.1 | R+23.6 | 77,907 | 76,295 (98%) | R+26.6 | −3.0 |
| Citrus ✓ | R+45.9 | R+38.5 | 75,985 | 75,121 (99%) | R+43.5 | −5.0 |
| Santa Rosa ✓ | R+50.9 | R+43.5 | 75,855 | 74,557 (98%) | R+43.0 | +0.4 |
| Bay ✓ | R+47.3 | R+39.9 | 67,243 | 70,329 (105%) | R+39.8 | +0.1 |
| Flagler ✓ | R+28.3 | R+20.8 | 58,886 | 63,900 (109%) | R+24.9 | −4.1 |
| Nassau ✓ | R+46.9 | R+39.4 | 47,891 | 50,549 (106%) | R+42.1 | −2.6 |
| Highlands ✓ | R+40.8 | R+33.4 | 39,922 | 39,742 (100%) | R+35.5 | −2.2 |
| Walton ✓ | R+57.8 | R+50.4 | 34,975 | 35,265 (101%) | R+53.3 | −2.9 |
| Monroe | R+18.3 | R+10.9 | 34,116 | 32,270 (95%) | R+8.9 | +2.0 * |
| Putnam ✓ | R+47.9 | R+40.4 | 26,656 | 26,505 (99%) | R+39.0 | +1.4 |
| Columbia ✓ | R+50.2 | R+42.8 | 23,769 | 23,022 (97%) | R+42.2 | +0.6 |
| Levy ✓ | R+50.3 | R+42.8 | 17,954 | 18,154 (101%) | R+44.0 | −1.1 |
| Gadsden ✓ | D+30.7 | D+38.2 | 17,463 | 17,821 (102%) | D+37.6 | −0.6 |
| Suwannee ✓ | R+61.0 | R+53.5 | 16,400 | 15,867 (97%) | R+54.3 | −0.8 |
| Jackson ✓ | R+46.1 | R+38.7 | 16,355 | 15,698 (96%) | R+39.4 | −0.7 |
| Wakulla ✓ | R+44.4 | R+36.9 | 15,113 | 15,123 (100%) | R+34.4 | +2.5 |
| Okeechobee ✓ | R+53.9 | R+46.4 | 10,934 | 11,129 (102%) | R+40.4 | +6.0 |
| Hendry ✓ | R+38.4 | R+30.9 | 8,293 | 10,088 (122%) | R+11.6 | +19.3 |
| Baker | R+73.2 | R+65.7 | 10,736 | 9,826 (92%) | R+67.2 | −1.4 * |
| Bradford | R+57.4 | R+49.9 | 10,290 | 9,715 (94%) | R+49.9 | +0.0 * |
| Desoto ✓ | R+43.0 | R+35.5 | 8,714 | 9,120 (105%) | R+29.6 | +5.9 |
| Washington ✓ | R+65.4 | R+58.0 | 9,147 | 9,040 (99%) | R+59.8 | −1.8 |
| Gilchrist ✓ | R+68.0 | R+60.6 | 7,889 | 7,804 (99%) | R+64.0 | −3.4 |
| Madison ✓ | R+28.9 | R+21.5 | 7,020 | 6,999 (100%) | R+22.6 | −1.1 |
| Taylor | R+59.7 | R+52.3 | 7,645 | 6,994 (91%) | R+52.6 | −0.3 * |
| Jefferson ✓ | R+18.6 | R+11.2 | 7,152 | 6,989 (98%) | R+15.8 | −4.7 |
| Gulf ✓ | R+54.2 | R+46.8 | 6,438 | 6,716 (104%) | R+53.6 | −6.8 |
| Holmes | R+80.4 | R+72.9 | 6,790 | 6,207 (91%) | R+75.5 | −2.6 * |
| Hardee ✓ | R+56.4 | R+49.0 | 5,552 | 6,032 (109%) | R+37.3 | +11.7 |
| Dixie | R+70.5 | R+63.1 | 6,193 | 5,617 (91%) | R+66.1 | −3.0 * |
| Franklin | R+43.8 | R+36.4 | 5,465 | 5,051 (92%) | R+36.0 | +0.3 * |
| Calhoun | R+67.7 | R+60.2 | 4,868 | 4,299 (88%) | R+61.2 | −1.0 * |
| Union | R+68.4 | R+60.9 | 4,567 | 4,286 (94%) | R+62.4 | −1.5 * |
| Hamilton ✓ | R+39.0 | R+31.6 | 4,320 | 4,149 (96%) | R+30.7 | +0.9 |
| Glades ✓ | R+53.3 | R+45.8 | 3,839 | 3,812 (99%) | R+42.2 | +3.6 |
| Liberty ✓ | R+67.0 | R+59.5 | 2,622 | 2,657 (101%) | R+60.6 | −1.1 |
| Lafayette | R+76.1 | R+68.6 | 2,921 | 2,619 (90%) | R+72.5 | −3.9 * |
Gap: + is better for the Democrat than we expected, − better for the Republican. ≡ compared method by method; * whole county, not yet complete (skewed by count order, left out of the race's read).
Wyoming governor Kenneth Casner v Eric Barlow · our forecast R+14.9, 85% Republican · totals only
| County | 2024 president | Expected tonight | Expected votes | Counted | Counted margin | Gap |
|---|---|---|---|---|---|---|
| Laramie ✓ | R+32.1 | R+1.2 | 29,911 | 30,174 (101%) | R+48.9 | −47.6 |
| Natrona ✓ | R+48.2 | R+17.3 | 22,491 | 21,973 (98%) | R+53.1 | −35.8 |
| Albany ✓ | R+3.1 | D+27.7 | 12,600 | 13,146 (104%) | R+39.1 | −66.8 |
| Fremont ✓ | R+36.9 | R+6.1 | 13,398 | 12,886 (96%) | R+54.4 | −48.3 |
| Sheridan ✓ | R+49.4 | R+18.6 | 12,191 | 12,062 (99%) | R+59.2 | −40.6 |
| Park | R+58.7 | R+27.8 | 12,698 | 11,902 (94%) | R+55.8 | −28.0 * |
| Campbell | R+76.3 | R+45.5 | 12,262 | 11,132 (91%) | R+68.9 | −23.4 * |
| Sweetwater | R+52.8 | R+21.9 | 11,917 | 11,013 (92%) | R+49.8 | −27.9 * |
| Teton ✓ | D+34.7 | D+65.6 | 10,146 | 10,383 (102%) | R+25.5 | −91.1 |
| Lincoln ✓ | R+67.7 | R+36.8 | 7,482 | 7,331 (98%) | R+60.3 | −23.5 |
| Uinta | R+62.9 | R+32.1 | 6,596 | 6,176 (94%) | R+58.2 | −26.1 * |
| Goshen | R+60.5 | R+29.7 | 4,813 | 4,472 (93%) | R+59.9 | −30.2 * |
| Converse | R+72.9 | R+42.0 | 4,977 | 4,359 (88%) | R+59.6 | −17.6 * |
| Carbon | R+57.6 | R+26.7 | 4,703 | 4,247 (90%) | R+58.6 | −31.9 * |
| Big Horn ✓ | R+71.9 | R+41.1 | 4,239 | 4,106 (97%) | R+66.2 | −25.2 |
| Sublette ✓ | R+60.6 | R+29.8 | 3,544 | 3,693 (104%) | R+67.0 | −37.2 |
| Johnson | R+63.1 | R+32.2 | 3,865 | 3,575 (92%) | R+68.0 | −35.8 * |
| Platte | R+64.9 | R+34.1 | 3,921 | 3,487 (89%) | R+55.9 | −21.8 * |
| Crook | R+77.4 | R+46.5 | 3,248 | 3,047 (94%) | R+67.5 | −21.0 * |
| Washakie | R+63.7 | R+32.8 | 3,045 | 2,749 (90%) | R+65.5 | −32.7 * |
| Weston | R+76.6 | R+45.8 | 2,735 | 2,490 (91%) | R+70.5 | −24.7 * |
| Hot Springs ✓ | R+60.8 | R+30.0 | 2,171 | 2,082 (96%) | R+62.2 | −32.2 |
| Niobrara | R+80.7 | R+49.9 | 1,047 | 902 (86%) | R+68.2 | −18.3 * |
Gap: + is better for the Democrat than we expected, − better for the Republican. ≡ compared method by method; * whole county, not yet complete (skewed by count order, left out of the race's read).
Mississippi Senate Scott Colom v Cindy Hyde-Smith · our forecast R+7.0, 85% Republican · totals only
| County | 2024 president | Expected tonight | Expected votes | Counted | Counted margin | Gap |
|---|---|---|---|---|---|---|
| Hinds ✓ | D+46.1 | D+62.0 | 63,276 | 77,465 (122%) | D+60.8 | −1.2 |
| Harrison ✓ | R+28.9 | R+13.0 | 55,327 | 58,850 (106%) | R+3.7 | +9.3 |
| DeSoto | R+24.1 | R+8.2 | 57,629 | 54,184 (94%) | D+6.1 | +14.3 * |
| Rankin ✓ | R+47.1 | R+31.2 | 50,776 | 51,331 (101%) | R+25.6 | +5.6 |
| Madison ✓ | R+17.3 | R+1.4 | 40,598 | 45,766 (113%) | D+0.8 | +2.2 |
| Jackson | R+39.9 | R+24.0 | 38,193 | 35,432 (93%) | R+14.7 | +9.3 * |
| Lee ✓ | R+38.8 | R+22.9 | 25,752 | 24,993 (97%) | R+17.6 | +5.4 |
| Forrest ✓ | R+17.9 | R+2.0 | 20,744 | 22,433 (108%) | D+10.3 | +12.4 |
| Lauderdale ✓ | R+21.2 | R+5.3 | 19,972 | 21,874 (110%) | R+1.7 | +3.6 |
| Lowndes ✓ | R+8.2 | D+7.7 | 17,800 | 21,284 (120%) | D+15.9 | +8.1 |
| Lamar ✓ | R+48.8 | R+32.9 | 20,529 | 21,020 (102%) | R+25.8 | +7.0 |
| Jones ✓ | R+46.8 | R+30.9 | 20,226 | 20,308 (100%) | R+23.6 | +7.3 |
| Lafayette ✓ | R+21.8 | R+5.9 | 17,059 | 17,223 (101%) | D+1.2 | +7.0 |
| Hancock ✓ | R+58.7 | R+42.8 | 15,431 | 16,732 (108%) | R+41.3 | +1.5 |
| Pearl River | R+66.7 | R+50.8 | 17,979 | 16,526 (92%) | R+47.5 | +3.4 * |
| Oktibbeha ✓ | R+0.3 | D+15.6 | 13,154 | 15,706 (119%) | D+22.4 | +6.8 |
| Warren ✓ | R+4.0 | D+11.9 | 13,334 | 14,643 (110%) | D+13.4 | +1.5 |
| Pike ✓ | R+3.5 | D+12.4 | 11,284 | 12,900 (114%) | D+17.7 | +5.3 |
| Monroe ✓ | R+35.9 | R+20.0 | 11,710 | 12,765 (109%) | R+13.4 | +6.6 |
| Lincoln ✓ | R+45.4 | R+29.5 | 11,515 | 12,391 (108%) | R+30.0 | −0.6 |
| Marshall ✓ | R+7.3 | D+8.6 | 10,919 | 11,534 (106%) | D+15.9 | +7.3 |
| Panola ✓ | R+14.8 | D+1.1 | 10,510 | 11,364 (108%) | D+12.3 | +11.3 |
| Washington ✓ | D+35.0 | D+50.9 | 10,596 | 11,191 (106%) | D+56.2 | +5.3 |
| Alcorn ✓ | R+68.3 | R+52.5 | 11,013 | 11,164 (101%) | R+52.8 | −0.3 |
| Pontotoc ✓ | R+67.7 | R+51.8 | 10,252 | 10,206 (100%) | R+47.2 | +4.6 |
| Bolivar ✓ | D+23.7 | D+39.6 | 7,604 | 10,143 (133%) | D+41.4 | +1.8 |
| Copiah ✓ | R+6.1 | D+9.8 | 8,501 | 9,869 (116%) | D+13.5 | +3.6 |
| Adams ✓ | D+13.9 | D+29.8 | 8,692 | 9,730 (112%) | D+28.1 | −1.8 |
| Tate ✓ | R+43.8 | R+27.9 | 9,372 | 9,215 (98%) | R+19.4 | +8.5 |
| Union ✓ | R+70.1 | R+54.2 | 9,093 | 8,939 (98%) | R+52.5 | +1.7 |
| Clay ✓ | D+10.4 | D+26.3 | 6,600 | 8,619 (131%) | D+34.0 | +7.7 |
| Marion ✓ | R+41.6 | R+25.7 | 8,153 | 8,542 (105%) | R+20.9 | +4.8 |
| Simpson ✓ | R+36.7 | R+20.8 | 8,085 | 8,377 (104%) | R+19.1 | +1.7 |
| Leflore ✓ | D+38.4 | D+54.3 | 6,865 | 8,221 (120%) | D+51.0 | −3.4 |
| Neshoba ✓ | R+50.9 | R+35.0 | 7,915 | 8,061 (102%) | R+28.2 | +6.8 |
| Scott ✓ | R+24.0 | R+8.1 | 7,208 | 7,903 (110%) | R+1.4 | +6.6 |
| Grenada ✓ | R+16.3 | R+0.4 | 7,117 | 7,553 (106%) | D+3.1 | +3.5 |
| Yazoo ✓ | R+2.4 | D+13.5 | 6,537 | 7,549 (115%) | D+19.3 | +5.8 |
| Itawamba ✓ | R+80.0 | R+64.1 | 7,740 | 7,435 (96%) | R+65.8 | −1.7 |
| Tippah ✓ | R+67.1 | R+51.2 | 6,989 | 7,372 (105%) | R+48.2 | +3.0 |
| Prentiss ✓ | R+66.0 | R+50.1 | 7,565 | 7,268 (96%) | R+47.7 | +2.4 |
| Winston ✓ | R+18.2 | R+2.4 | 6,110 | 7,218 (118%) | D+4.1 | +6.5 |
| Wayne ✓ | R+32.7 | R+16.8 | 6,645 | 7,067 (106%) | R+9.3 | +7.5 |
| Sunflower ✓ | D+35.5 | D+51.4 | 5,739 | 7,030 (122%) | D+51.8 | +0.4 |
| Newton ✓ | R+43.3 | R+27.4 | 6,794 | 6,860 (101%) | R+24.4 | +3.0 |
| George | R+78.8 | R+62.9 | 8,066 | 6,759 (84%) | R+63.6 | −0.7 * |
| Holmes ✓ | D+62.1 | D+78.0 | 4,904 | 6,465 (132%) | D+72.7 | −5.2 |
| Leake ✓ | R+23.4 | R+7.5 | 6,107 | 6,432 (105%) | R+4.4 | +3.2 |
| Chickasaw ✓ | R+13.7 | D+2.2 | 5,272 | 6,338 (120%) | D+8.0 | +5.8 |
| Tishomingo ✓ | R+78.9 | R+63.0 | 6,595 | 6,300 (96%) | R+64.2 | −1.2 |
| Jasper ✓ | R+5.0 | D+10.9 | 5,750 | 6,163 (107%) | D+13.8 | +2.9 |
| Coahoma ✓ | D+39.8 | D+55.7 | 4,948 | 6,066 (123%) | D+57.0 | +1.3 |
| Attala ✓ | R+23.3 | R+7.4 | 5,613 | 5,904 (105%) | R+2.6 | +4.8 |
| Covington | R+33.3 | R+17.4 | 6,457 | 5,760 (89%) | R+15.5 | +1.9 * |
| Clarke ✓ | R+35.2 | R+19.3 | 5,517 | 5,630 (102%) | R+13.0 | +6.3 |
| Stone ✓ | R+58.0 | R+42.1 | 5,771 | 5,508 (95%) | R+39.5 | +2.6 |
| Smith ✓ | R+60.7 | R+44.8 | 5,594 | 5,466 (98%) | R+43.3 | +1.5 |
| Walthall ✓ | R+26.9 | R+11.0 | 4,758 | 5,221 (110%) | R+8.4 | +2.7 |
| Amite ✓ | R+32.8 | R+16.9 | 4,966 | 5,120 (103%) | R+18.1 | −1.1 |
| Yalobusha ✓ | R+20.9 | R+5.0 | 4,283 | 4,810 (112%) | D+1.9 | +6.9 |
| Lawrence ✓ | R+36.6 | R+20.7 | 4,411 | 4,619 (105%) | R+19.4 | +1.3 |
| Calhoun ✓ | R+48.0 | R+32.1 | 4,397 | 4,587 (104%) | R+27.1 | +5.0 |
| Jefferson Davis ✓ | D+13.7 | D+29.6 | 3,919 | 4,558 (116%) | D+30.9 | +1.3 |
| Tallahatchie ✓ | D+5.9 | D+21.8 | 3,652 | 4,377 (120%) | D+29.6 | +7.7 |
| Noxubee ✓ | D+47.6 | D+63.5 | 3,242 | 4,287 (132%) | D+62.7 | −0.8 |
| Carroll ✓ | R+44.3 | R+28.4 | 3,785 | 4,063 (107%) | R+24.9 | +3.5 |
| Webster ✓ | R+65.2 | R+49.3 | 3,713 | 3,889 (105%) | R+48.7 | +0.6 |
| Perry | R+60.4 | R+44.5 | 4,036 | 3,818 (95%) | R+37.7 | +6.8 * |
| Montgomery ✓ | R+20.8 | R+4.9 | 3,224 | 3,626 (112%) | R+0.1 | +4.8 |
| Greene | R+69.8 | R+53.9 | 4,117 | 3,539 (86%) | R+50.9 | +3.0 * |
| Kemper ✓ | D+16.9 | D+32.8 | 2,978 | 3,413 (115%) | D+33.5 | +0.7 |
| Humphreys ✓ | D+41.9 | D+57.8 | 2,527 | 3,382 (134%) | D+57.5 | −0.3 |
| Claiborne ✓ | D+67.6 | D+83.4 | 2,580 | 3,329 (129%) | D+75.8 | −7.7 |
| Franklin ✓ | R+39.8 | R+23.9 | 2,963 | 3,317 (112%) | R+23.2 | +0.7 |
| Jefferson ✓ | D+66.3 | D+82.2 | 2,404 | 3,082 (128%) | D+75.3 | −6.9 |
| Choctaw ✓ | R+49.3 | R+33.4 | 2,835 | 3,052 (108%) | R+30.5 | +2.9 |
| Benton ✓ | R+31.4 | R+15.5 | 2,827 | 2,818 (100%) | R+8.1 | +7.4 |
| Wilkinson ✓ | D+25.3 | D+41.2 | 2,136 | 2,772 (130%) | D+40.6 | −0.6 |
| Tunica ✓ | D+38.9 | D+54.8 | 1,944 | 2,333 (120%) | D+51.7 | −3.0 |
| Quitman ✓ | D+30.7 | D+46.6 | 1,951 | 2,205 (113%) | D+51.3 | +4.7 |
| Sharkey ✓ | D+36.8 | D+52.7 | 1,287 | 1,597 (124%) | D+36.8 | −15.9 |
| Issaquena ✓ | R+1.4 | D+14.4 | 453 | 453 (100%) | D+4.0 | −10.5 |
Gap: + is better for the Democrat than we expected, − better for the Republican. ≡ compared method by method; * whole county, not yet complete (skewed by count order, left out of the race's read).
How the live model works
- Start from our forecast. Each race starts from our pre-election margin and its uncertainty.
- Expect each county. Every county gets an expected margin (its 2024 presidential margin, moved so the counties add up to our forecast) and an expected vote (its 2022 midterm turnout, or its 2024 presidential turnout scaled down where no 2022 race is held).
- Read the swing. Where votes are counted, we compare each county's margin with what we expected there. Counties count for more the more of their vote is in: a half-counted county is often all mail or all Election Day ballots, which lean differently.
- Project the rest. The swing, shrunk toward zero by our pre-election uncertainty, is applied to the vote still to come in each county. The uncertainty left shrinks with the share of the expected vote still to count. It stays wider while counties are only partly in: their counted votes are often one kind (mail, early or Election Day) and lean one way, and we cannot see which way on the night. How many votes are still to come is uncertain too.
- Roll up. For control of the House and Senate we rerun our forecast's own simulations with every race that has votes counted drawn from its live estimate; races with nothing counted keep our forecast, moved by half the swing seen so far.
Where a state's feed gives only statewide totals, or for House districts (our county baselines are statewide), the race's total is compared with our forecast in the same way, with a wider uncertainty. The model says nothing until at least 2% of a race's expected vote is in.
It is behind the same switch as the live results: nothing is computed on the night until the owner switches live results on.
Backtest: the 2024 Senate races, replayed
The backtest needs scripts 37 and 41 (our 2024 backtest forecast and the county results).
For each state we looked for the election office's own results feed for 3 November, its format, its terms and robots.txt, and whether it lets a named reader in. We read a state only if all of that is clear; a Cloudflare, Incapsula or Akamai challenge is a refusal and we never get round one. The AP's results are paid and not used; nor are any media feeds. Full notes: research/us/LIVE_RESULTS_SOURCES.md.
| State | Decision | Feed | Polls close (last, Eastern) |
|---|---|---|---|
| Alaska | Read live | Division of Elections JSON (first-choice counts) link | 1:00 am ET |
| Arizona | Read live | Statewide site blocked (Cloudflare); read county by county: Maricopa, Pima, Pinal (about 80% of the vote) link | 9:00 pm ET |
| Arkansas | Read live | Tally ENR JSON, with counties link | 8:30 pm ET |
| Colorado | Read live | Clarity ENR JSON link | 9:00 pm ET |
| Connecticut | Read live | JSON (statewide and district totals; towns, not counties) link | 8:00 pm ET |
| Florida | Read live | Results extract, tab-delimited, by county link | 8:00 pm ET |
| Georgia | Read live | Enhanced Voting JSON, with counties link | 7:00 pm ET |
| Idaho | Read live | Enhanced Voting JSON link | 11:00 pm ET |
| Indiana | Read live | Indiana Election Division JSON, House districts with counties link | 7:00 pm ET |
| Iowa | Read live | Clarity ENR JSON link | 9:00 pm ET |
| Michigan | Read live | No statewide feed; read county by county: Oakland, Macomb, Kent, Genesee, Ingham, Ottawa (about 40% of the vote; Wayne publishes PDFs only) link | 9:00 pm ET |
| Minnesota | Read live | Media files by county, semicolon-delimited link | 9:00 pm ET |
| Nebraska | Read live | Results CSV exports (statewide) link | 10:00 pm ET |
| New Mexico | Read live | Results CSV exports (statewide) link | 9:00 pm ET |
| North Carolina | Read live | NCSBE JSON, with counties link | 7:30 pm ET |
| North Dakota | Read live | Results XML exports (statewide) link | 10:00 pm ET |
| Ohio | Read live | Statewide site blocks our reader; read county by county: Cuyahoga, Hamilton, Summit, Montgomery, Lucas, Butler (about a third of the vote; Franklin publishes PDFs only) link | 7:30 pm ET |
| Pennsylvania | Read live | Statewide site blocked (Incapsula); read county by county: Allegheny, Montgomery, Delaware, Chester, Lancaster, Lehigh, Luzerne, Erie (over a third of the vote; Philadelphia publishes HTML only) link | 8:00 pm ET |
| South Carolina | Read live | Clarity ENR JSON link | 7:00 pm ET |
| South Dakota | Read live | Results CSV exports (statewide) link | 9:00 pm ET |
| Texas | Read live | Statewide site blocked (Cloudflare); read county by county: Harris, Dallas, Tarrant, Bexar, Travis, Denton, Williamson, Fort Bend (about 50% of the vote) link | 9:00 pm ET |
| Utah | Read live | Enhanced Voting JSON, with counties link | 10:00 pm ET |
| Vermont | Read live | JSON by town (statewide totals) link | 7:00 pm ET |
| Virginia | Read live | Enhanced Voting JSON, with localities link | 7:00 pm ET |
| Washington | Read live | Enhanced Voting JSON link | 11:00 pm ET |
| West Virginia | Read live | Clarity ENR JSON link | 7:30 pm ET |
| District of Columbia | Open, not read yet | JSON link | 8:00 pm ET |
| Hawaii | Open, not read yet | Text summary files link | midnight ET |
| Louisiana | Open, not read yet | JSON blobs (House seats are party primaries on 3 November) link | 9:00 pm ET |
| Alabama | Not read | HTML pages only link | 8:00 pm ET |
| California | Not read | Incapsula script on the results site link | 11:00 pm ET |
| Delaware | Not read | HTML only link | 8:00 pm ET |
| Illinois | Not read | No statewide feed on the night link | 8:00 pm ET |
| Kansas | Not read | Power BI dashboard only link | 9:00 pm ET |
| Kentucky | Not read | No data feed found link | 7:00 pm ET |
| Maine | Not read | No election-night feed | 8:00 pm ET |
| Maryland | Not read | No live data file found link | 8:00 pm ET |
| Massachusetts | Not read | Incapsula script; results after the count | 8:00 pm ET |
| Mississippi | Not read | PDF only link | 8:00 pm ET |
| Missouri | Not read | Cloudflare block link | 8:00 pm ET |
| Montana | Not read | Exports only through page forms link | 10:00 pm ET |
| Nevada | Not read | Incapsula block link | 10:00 pm ET |
| New Hampshire | Not read | No feed; the site answered Access Denied | 8:00 pm ET |
| New Jersey | Not read | County clerks report; Incapsula script | 8:00 pm ET |
| New York | Not read | Cloudflare challenge link | 9:00 pm ET |
| Oklahoma | Not read | 403 Forbidden link | 8:00 pm ET |
| Oregon | Not read | HTML; export address answered 404 link | 11:00 pm ET |
| Rhode Island | Not read | Cloudflare challenge link | 8:00 pm ET |
| Tennessee | Not read | 403 from CloudFront link | 8:00 pm ET |
| Wisconsin | Not read | No statewide feed; Cloudflare | 9:00 pm ET |
| Wyoming | Not read | PDF after the count | 9:00 pm ET |