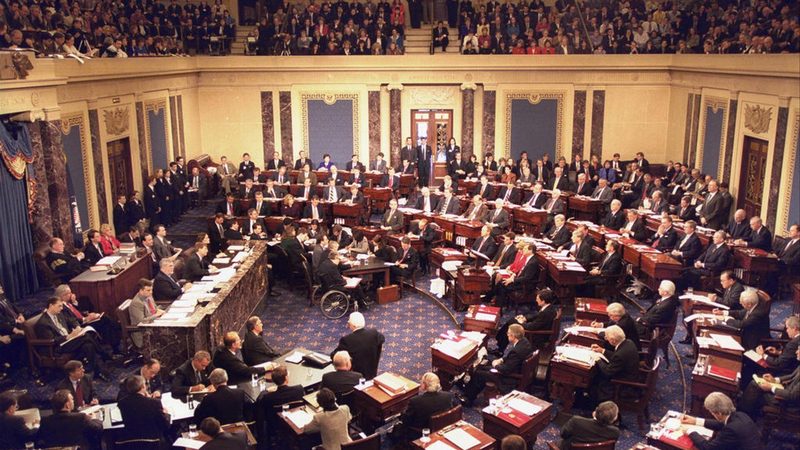
Idaho Senate
Called: Jim Risch (Republican) wins
Called by us, on the count on 4 November 2026. Unofficial until the state certifies. Our forecast before the count gave Jim Risch 82%; it is kept below for the record. Every result and call →
Risch likely to keep Idaho's Senate seat Republican, 54.7% to 42.1%
Jim Risch (R) is running again. Jim Risch leads by 12.6 points in our forecast and wins 82% of our simulations. The 6 polls in our average have Risch ahead by 2.7 points; our forecast also weighs the state's usual lean and how polls have missed. Rating: Likely R.
The band runs from 25% to 75% of the vote: the dot is our forecast, the shaded part holds 80% of our simulations, the tick marks 50%. Others: about 3.2%.
How we got here
From the state's 2024 vote for president to our forecast, one step at a time.
What moves the average today
The polls that count most in our average of this race, and their share of its weight.
Counted: after the pollster's usual lean and the national trend since the poll. Every other poll together: 1%.
Idaho Senate by county
Our forecast spread over the counties: each county's 2024 vote for president moved by the race's swing from that result (I+23.9 on 2024).
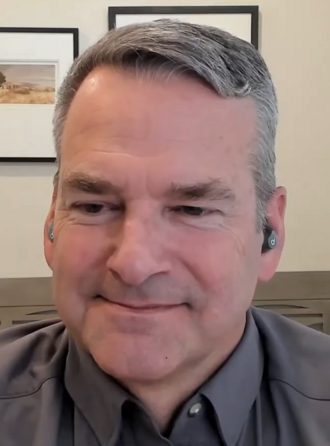
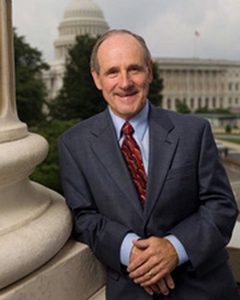
Our projection R+12.6; 80% of simulations between R+29.8 and I+4.7. It was the seat that decided control in 2% of simulations.
| Share of the vote | Achilles | Risch | Others |
|---|---|---|---|
| Our forecast | 42.1% | 54.7% | 3.2% |
| 80% range | 33–51 | 46–63 | |
| The polls | 44.1% | 50.3% | 5.6% |
The polls, as published with undecided voters left out, have R+6.2. Allowing for each pollster's usual lean, the national trend since each poll and how far polls have missed before: R+2.7. Blended with the fundamentals (R+30.7, 36% of the weight): R+12.6. Third parties tend to get less than they poll; we expect a little over half their polled share.
Todd Achilles: Photo: DL a.k.a. LibertyDad, CC BY 4.0, via Wikimedia Commons (https://commons.wikimedia.org/wiki/File:Todd_Achilles_on_LibertyDad%27s_stream.png)
Jim Risch: Official portrait: Biographical Directory of the United States Congress (US government work, public domain) (https://bioguide.congress.gov/photo/R000584.jpg)
What if the polls are off?
Jim Risch leads by 12.6 points in our projection. If the polls are off by more than 12.6 points in the independent's favor, Todd Achilles wins instead.
Our projection: Jim Risch by 12.6 (R+12.6).
If the polls miss like a past election
- 2024 R+14.9
- 2022 R+13.7
- 2020 R+19.5
- 2018 R+12.6
- 2016 R+16.5
- 2014 R+15.9
- 2012 R+10.2
- 2010 R+11.0
- 2008 R+13.7
- 2006 R+11.9
- 2004 R+12.9
- 2002 R+16.2
Each past election's average miss in the final Senate and governor polls, applied to this race. None of them changes the winner. The same rule moves every race at once on who wins Congress if the vote moves.
Our forecast over time
Our projection with the range holding 80% of simulations. A month ago: 12% for the Independent (Likely R); now 18% (Likely R). The shaded part is reconstructed from the polls published by then.
- 14 OctToss-up→Likely Rpoll average I+2.6 to R+5.5.
- 18 Sep reconstructedSafe R→Toss-up1 new poll in our average (Advanced Targeting Research); poll average R+24.5 to I+3.1; national House vote D+7.3 to D+7.5.
- 11 Jun reconstructedLikely R→Safe R1 new poll in our average (Peak Insights); poll average R+7.5 to R+29.9; national House vote D+6.2 to D+5.5.
- 19 Mar reconstructedSafe R→Likely R1 new poll in our average; first polls: average R+17.5.
The polls over time
Each dot is one poll's margin on the decided vote as published (click for the poll); the line is a smoothed average (each day weighs the polls around it, and bigger polls more), with its 80% band; at the newest end it can only look back. Our average on the left adjusts each poll for its pollster's past lean; this chart does not.
Embed this race a small card for your own page
How we get there
| Presidential lean | R+35.1 against the nation (2024: R+36.5; 2020: R+30.8) |
|---|---|
| National House vote | D+7.5 (our reading of the generic ballot) |
| Incumbency | Republican incumbent: −9.2 points |
| Fundamentals alone | R+30.7 ± 23.2 |
| Poll average | R+2.7 ± 17.2 from 6 polls |
| Weight on the polls | 64% |
| Our projection | R+12.6 ± 13.8 |
Fundamentals: 2.9 + 0.84 × lean + 0.74 × national House margin + 9.2 for an incumbent, fitted on 444 senate races since 2000 (typical miss 15.0 points). The two are combined in inverse proportion to their measured errors. Method With no Democratic nominee, the independent is the main challenger; the fundamentals treat them like a Democrat but with half as much confidence again.
The candidates
- Jim Risch (R), incumbent
 Natalie Fleming (I)
- Todd Achilles (I)
- Matt Loesby (L)
The state's senators now
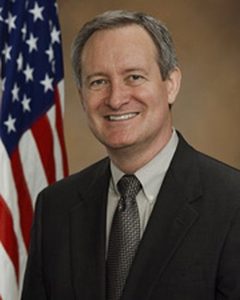 Mike Crapo (Republican), since 1999
Senate class III; term ends 2029-01-03; election- James E. Risch (Republican), since 2009
Senate class II; term ends 2027-01-03; election; 2026: Incumbent renominated
Who lives here
| Total population (ACS estimate) | 1,934,262 |
|---|---|
| White alone, not Hispanic or Latino | 78.6% (average of the states 65.5%) |
| Black or African American alone, not Hispanic | 0.7% (average of the states 10.0%) |
| Hispanic or Latino (any race) | 13.6% (average of the states 13.2%) |
| Asian alone, not Hispanic | 1.3% (average of the states 4.4%) |
| Bachelor's degree or higher, age 25+ | 31.8% (average of the states 34.7%) |
| Median household income: published B19013 for unchanged districts, bracket estimate for new ones | 77,800 |
| Population living in 2020 Census urban blocks | 69.2% (average of the states 72.4%) |
US Census Bureau: American Community Survey 2020-2024 and the 2020 Census.
Money
| Candidate | Raised | Spent | Cash | Outside for | against |
|---|---|---|---|---|---|
| Natalie Fleming (I) |
no report filed yet: FEC record S0ID00172 | $0 | $0 | ||
| Todd Achilles (I) |
$692k | $506k | $194k | $0 | $0 |
| Jim Risch (R) |
$3.4m | $2.2m | $3.5m | $0 | $0 |
All 6 candidates who filed for this seat in 2025-26 (primaries included) have spent $3.0m. Outside groups have spent $0. In the general election, $0 has helped the independent and $0 the Republican (spending for a candidate, or against their opponent). The money race everywhere
Raised, spent and cash on hand: the candidate's own campaign committees over the two years 2025-26 (a senator's earlier years of the six-year term are not included), to the end of the latest report (the newest here runs to 30 June 2026). Outside: independent expenditures reported to the FEC by party committees, super PACs and other groups, including the 24- and 48-hour reports filed close to an election; amended filings replace the original. Figures are as filed.
Data: FEC bulk data, 2026 cycle (candidate summaries) (as of 28 September 2026); FEC independent expenditures (as of 28 September 2026). Grade A: official data from the body that holds it. All sources
The polls in our average
- Wed 16 Sep 2026
700 RV · 16 Sep
Todd Achillesindependent50Jim RischRepublican39Todd Achilles (I) 50 · Jim Risch (R) 39Achilles +11- Thu 13 Aug 2026
(R sponsor) · 500 LV · 13 Aug
Jim RischRepublican52Todd Achillesindependent18Others 12
Jim Risch (R) 52 · Todd Achilles (I) 18 · Other (OTH) 12Risch +34- Fri 7 Aug 2026
(I sponsor) · 608 LV · 7 Aug
Todd Achillesindependent38Jim RischRepublican33Todd Achilles (I) 38 · Jim Risch (R) 33Achilles +5- Thu 30 Jul 2026
1,213 LV · 30 Jul
Jim RischRepublican45Todd Achillesindependent21Others 11
Jim Risch (R) 45 · Todd Achilles (I) 21 · Other (OTH) 11Risch +24- Sun 7 Jun 2026
(R sponsor) · 500 LV · 7 Jun
Jim RischRepublican55 David RothDemocratic15Todd Achillesindependent7Jim Risch (R) 55 · David Roth (D) 15 · Todd Achilles (I) 7Risch +40
- Mon 1 Jun 2026
(I sponsor) · 774 RV · 1 Jun
Jim RischRepublican40Todd Achillesindependent36Jim Risch (R) 40 · Todd Achilles (I) 36Risch +4
Margins on the decided vote. Adjusted: less the pollster's house effect at past final polls and, for a poll paid for by a campaign or party or from a pollster that mainly works for one, less the 2.5 points such polls have leaned to their side. ↻ Moved with the national trend: each poll is moved by how far the national generic ballot has moved since its fieldwork (our trend line through every generic-ballot poll, trackers included, now D+11.5); the "National trend" tag on each card shows its move. Weight: recency (30-day scale), sample, the pollster's record, halved for partisan polls, and a pollster's several polls sharing one pollster's weight.
Other polls of this race
- Wed 16 Sep 2026
700 RV · 16 Sep
Todd Achillesindependent46Jim RischRepublican39Others 5
Todd Achilles (I) 46 · Jim Risch (R) 39 · Other (OTH) 5Achilles +7- Fri 7 Aug 2026
(I sponsor) · 608 LV · 7 Aug
Jim RischRepublican34Todd Achillesindependent30Others 4
Jim Risch (R) 34 · Todd Achilles (I) 30 · Other (OTH) 4Risch +4- Thu 30 Jul 2026
- Jim Risch vs. David Roth vs. Todd AchillesChange ResearchJim Risch vs. David Roth vs. Todd AchillesRisch +24
1,213 LV · 30 Jul
Jim RischRepublican43Todd Achillesindependent19David RothDemocratic13Jim Risch (R) 43 · Todd Achilles (I) 19 · David Roth (D) 13Risch +24 - Mon 1 Jun 2026
(I sponsor) · 774 RV · 1 Jun
Jim RischRepublican50David RothDemocratic33Jim Risch (R) 50 · David Roth (D) 33Risch +17
Primaries, hypothetical matchups and earlier candidates.
Past results
| Year | Winner | Runner-up | Margin |
|---|---|---|---|
| 2022 | Mike Crapo (R) 60.7 | David Roth (D) 28.7 | R+31.9 |
| 2020 | Jim Risch (R) 62.6 | Paulette Jordan (D) 33.2 | R+29.4 |
| 2016 | Mike Crapo (R) 66.1 | Jerry Sturgill (D) 27.7 | R+38.4 |
| 2014 | James E. Risch (R) 65.3 | Nels Mitchell (D) 34.7 | R+30.7 |
| 2010 | Mike Crapo (R) 71.2 | P. Tom Sullivan (D) 24.9 | R+46.2 |
| 2008 | Jim Risch (R) 57.7 | Larry Larocco (D) 34.1 | R+23.5 |
| 2004 | Mike Crapo (R) 99.2 | (OTH) 0.8 | R+98.4 |
| 2002 | Larry E. Craig (R) 65.2 | Alan Blinken (D) 32.5 | R+32.6 |
‡ decided in a runoff. Sources: FEC and the Clerk of the House (House), MIT Election Data and Science Lab (Senate), J. Cha (governors).
Photo credits
3 official portraits from the Biographical Directory of the United States Congress (US government work, public domain): James E. Risch, Jim Risch, Mike Crapo.
- Natalie Fleming: Photo: Natibrat, CC BY-SA 4.0, via Wikimedia Commons (https://commons.wikimedia.org/wiki/File:Natalie_Fleming.jpg)
- Todd Achilles: Photo: DL a.k.a. LibertyDad, CC BY 4.0, via Wikimedia Commons (https://commons.wikimedia.org/wiki/File:Todd_Achilles_on_LibertyDad%27s_stream.png)
Figures as of . Published by Polling Forecast.