
Each division by the party projected to win it after preferences. The shares are first preferences; the margin is the winner's lead after preferences (two-candidate-preferred).
How to use this map
- Each division is coloured by our forecast. Click one to zoom into its state and see its numbers; the panel on the right has the totals.
- Map of: our forecast for the next election, or any past result we hold.
- What if: leave the forecast as it is, replay a past polling miss, or set the vote yourself. One at a time; the row under the controls opens with the choices.
- Colour by: who wins and by how much, the divisions that change hands, the polling-miss risk, where the voters are, one party's vote, or who lives there.
- The line under the controls says what is on the map. Start again puts our forecast back.
What this map can show
The map has one shape for each of its 150 divisions. Each reading below changes what the map shows; most also have a page of their own.
- Who wins
- Our forecast for every seat, coloured by the projected winner and how safe the seat is; the seats that change hands since the last election; the last election's result; each seat's risk if the polls are wrong again; and where the voters are. The forecast map.
- If the polls are wrong
- Today's polls missed the way they did at a past election, seat by seat: 2007, 2010, 2013, 2016, 2019, 2022, 2025, and the average of past misses. What if the polls are wrong, and set every party's share yourself.
- Census figures
- Every seat shaded by a census figure, each with its own map of where it is highest and lowest and who wins there: Aboriginal and/or Torres Strait Islander, Advanced diploma or diploma, Aged 0-17 (15-19 band split 60/40 at 18), Aged 18-34 (15-19 band split 60/40 at 18), Aged 35-54, Aged 55-64, Aged 65 and over, Anglican, Australian citizen, Average household size, Bachelor degree or higher (incl. graduate diploma/certificate), Born overseas, Buddhism, Catholic, Certificate (I-IV, nfd), Christian (all denominations), Clerical and administrative workers, Community and personal service workers, Dwelling owned outright, Dwelling owned with a mortgage, Dwelling rented, Hinduism, In the labour force, Islam, Judaism, Labourers, Machinery operators and drivers, Managers, Median age, Median mortgage repayment, Median rent, Median total household income, Median total personal income, No religion or secular beliefs, Professionals, Rented from a state or territory housing authority, Sales workers, Technicians and trades workers, Unemployed, Uses a language other than English at home, Usual resident population. Every census map.
- Past elections
- The result of every past election we hold, each on the boundaries of its own time: 2025, House of Representatives election 2022, House 2022, notional results on the 2025 boundaries (AEC), 2019, 2016, 2013, 2010, 2007, 2004, 2001, 1998, 1996.
- Every seat
- Select a seat on the map for its projection, its last result, its census figures and its candidates, or open its own page. Every seat, A to Z.
Closest divisions
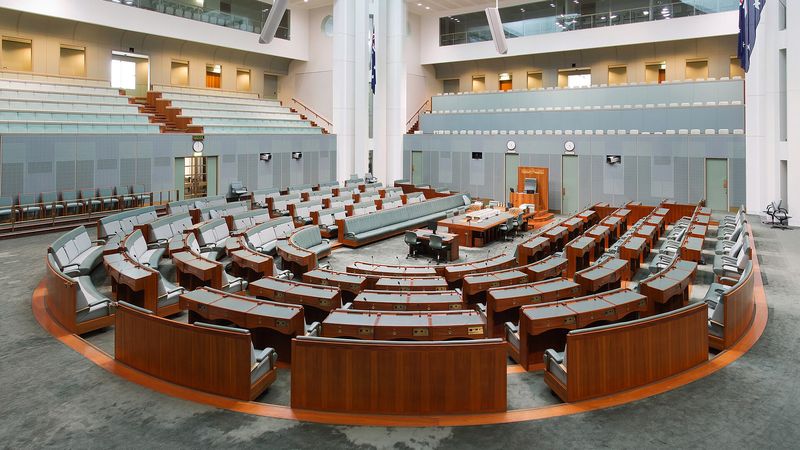
The House of Representatives: One Nation 65, Labor 53, Coalition 16, Independent 10, Greens 5, Centre Alliance 1 · 76 for a majority · 2026-11-17
| Division | state | Projected | Chance | ahead by pts |
|---|---|---|---|---|
| Fisher | Queensland | Coalition | 37% | 0.6 |
| Cowper | New South Wales | One Nation (Gain from Coalition) | 41% | 0.1 |
| Macnamara | Victoria | Greens (Gain from Labor) | 45% | 15.5 |
| Hume | New South Wales | Coalition | 48% | 1.0 |
| Aston | Victoria | Coalition (Gain from Labor) | 49% | 0.3 |
| Hughes | New South Wales | One Nation (Gain from Labor) | 49% | 4.2 |
| Griffith | Queensland | Labor | 50% | 0.2 |
| Gilmore | New South Wales | One Nation (Gain from Labor) | 50% | 2.9 |
| Dickson | Queensland | One Nation (Gain from Labor) | 51% | 7.3 |
| McPherson | Queensland | One Nation (Gain from Coalition) | 52% | 18.5 |
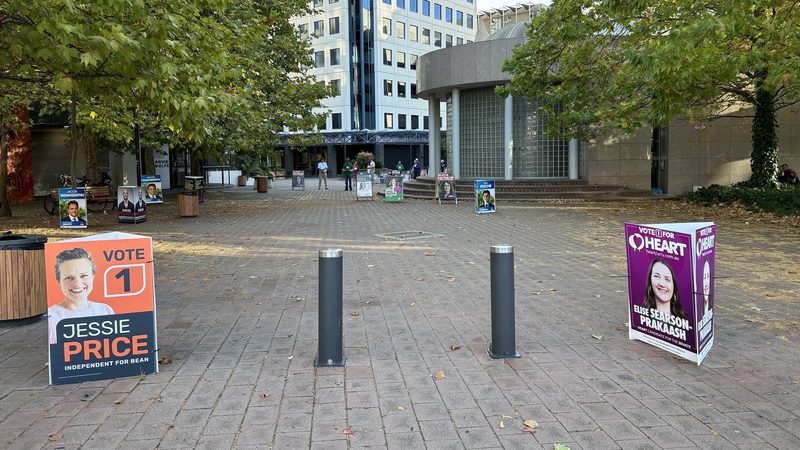
| Bean | Australian Capital Territory | Labor | 52% | 0.2 |
| Robertson | New South Wales | One Nation (Gain from Labor) | 52% | 0.2 |
| Banks | New South Wales | Coalition (Gain from Labor) | 53% | 1.9 |
| Sturt | South Australia | Labor | 53% | 2.4 |
| Farrer | New South Wales | One Nation (Gain from Coalition) | 54% | 1.6 |
Census maps of Australia
Each figure the map can be coloured by, on a page of its own: every division, where it is highest and lowest, and who we project to win there. All 41 census maps
- Aboriginal and/or Torres Strait Islander
- Advanced diploma or diploma
- Aged 0-17 (15-19 band split 60/40 at 18)
- Aged 18-34 (15-19 band split 60/40 at 18)
- Aged 35-54
- Aged 55-64
- Aged 65 and over
- Anglican
- Australian citizen
- Average household size
- Bachelor degree or higher (incl. graduate diploma/certificate)
- Born overseas
- Buddhism
- Catholic
- Certificate (I-IV, nfd)
- Christian (all denominations)
- Clerical and administrative workers
- Community and personal service workers
- Dwelling owned outright
- Dwelling owned with a mortgage
- Dwelling rented
- Hinduism
- In the labour force
- Islam
- Judaism
- Labourers
- Machinery operators and drivers
- Managers
- Median age
- Median mortgage repayment
- Median rent
- Median total household income
- Median total personal income
- No religion or secular beliefs
- Professionals
- Rented from a state or territory housing authority
- Sales workers
- Technicians and trades workers
- Unemployed
- Uses a language other than English at home
- Usual resident population
150 divisions
Each division elects one member by full preferential voting. The hex map gives every division the same space, so the 38 Sydney and Melbourne seats show at their true weight next to Durack, which covers most of Western Australia; the real map shows the divisions, with the seven capital cities enlarged. Hover for detail, click for the division.
Same polls, different readings
Every row starts from the same polls: our projection, the polls as they stand, and each past election's polling miss replayed on today's figures. Pick one to see it on the map.
| Reading | One Nation | Labor | Coalition | Independents | Greens | Centre Alliance | Others | |
|---|---|---|---|---|---|---|---|---|
| The polls as they stand | 65 | 53 | 16 | 10 | 5 | 1 | 0 | On the map ↑ |
| Our projection (the polls, uncorrected) | 65 | 53 | 16 | 10 | 5 | 1 | 0 | On the map ↑ |
| If the polls miss like 2007 | 66 | 51 | 13 | 12 | 7 | 1 | 0 | On the map ↑ |
| If the polls miss like 2010 | 61 | 42 | 35 | 8 | 3 | 1 | 0 | On the map ↑ |
| If the polls miss like 2013 | 66 | 49 | 20 | 10 | 4 | 1 | 0 | On the map ↑ |
| If the polls miss like 2016 | 65 | 53 | 17 | 10 | 4 | 1 | 0 | On the map ↑ |
| If the polls miss like 2019 | 56 | 43 | 32 | 11 | 7 | 1 | 0 | On the map ↑ |
| If the polls miss like 2022 | 70 | 42 | 17 | 13 | 7 | 1 | 0 | On the map ↑ |
| If the polls miss like 2025 | 54 | 70 | 8 | 13 | 3 | 1 | 0 | On the map ↑ |
Seats. Bold: 76 or more, a majority on its own.
Figures as of . Published by Polling Forecast.
 United Kingdom
 France
 Germany
 Spain
 Italy
 Netherlands
 Poland
 Canada