
Australia · states
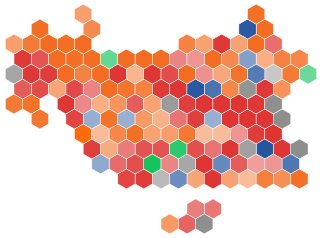
Australia: seats by state
Seats are won division by division; here they are added up by state. The small figure is the change on 2025. Below, the state polls: pollsters publish state breakdowns of their national samples, which are small, so we use only half of a state's swing beyond the national swing, and only where two or more pollsters have published figures in the last 90 days.
| State | Seats | One Nation | Labor | Coalition | Independents | Greens | Centre Alliance | Katter's Australian Party |
|---|---|---|---|---|---|---|---|---|
| New South Wales | 46 | 19 +19 26.6% |
15 −13 27.5% |
6 −6 20.9% |
5 −1 7.8% |
1 +1 12.4% |
0 | 0 |
| Victoria | 38 | 13 +13 25.2% |
13 −14 26.1% |
6 −3 22.5% |
3 +1 5.9% |
3 +3 15.4% |
0 | 0 |
| Queensland | 30 | 19 +19 32.7% |
7 −5 24.3% |
3 −13 21.9% |
0 2.6% |
1 11.3% |
0 | 0 −1 |
| Western Australia | 16 | 9 +9 30.6% |
6 −5 28.1% |
0 −4 21.2% |
1 4.1% |
0 10.7% |
0 | 0 |
| South Australia | 10 | 2 +2 29.2% |
6 −1 29.3% |
1 −1 19.3% |
0 4.9% |
0 12.2% |
1 | 0 |
| Tasmania | 5 | 1 +1 23.9% |
3 −1 29.0% |
0 18.3% |
1 13.5% |
0 12.9% |
0 | 0 |
| Australian Capital Territory | 3 | 0 11.0% |
3 40.9% |
0 16.8% |
0 10.4% |
0 18.1% |
0 | 0 |
| Northern Territory | 2 | 2 +2 30.9% |
0 −2 28.1% |
0 23.5% |
0 4.8% |
0 10.7% |
0 | 0 |
The state polls
| State | Pollsters | Labor | Coalition | One Nation | Greens | Others | Swing we add beyond the national swing |
|---|---|---|---|---|---|---|---|
| New South Wales | 2 | 27.5 2025: 35.2 |
18.5 2025: 31.5 |
27.5 2025: 6.0 |
13.0 2025: 11.1 |
13.5 2025: 16.2 |
Labor +0.4, Coalition −2.2, One Nation +0.6, Greens +0.4, Others +0.8 |
| Victoria | 2 | 26.5 2025: 34.0 |
21.5 2025: 32.2 |
25.5 2025: 5.8 |
16.0 2025: 13.6 |
10.5 2025: 14.5 |
Labor +0.5, Coalition −1.0, One Nation −0.3, Greens +0.6, Others +0.1 |
| Queensland | 2 | 27.0 2025: 31.0 |
21.0 2025: 34.9 |
31.5 2025: 7.8 |
10.5 2025: 11.8 |
10.0 2025: 14.5 |
Labor +2.3, Coalition −2.7, One Nation +1.7, Greens −1.2, Others −0.1 |
| Western Australia | 2 | 32.0 2025: 35.6 |
21.5 2025: 31.5 |
28.0 2025: 7.6 |
9.5 2025: 12.0 |
9.0 2025: 13.3 |
Labor +2.4, Coalition −0.7, One Nation +0.1, Greens −1.8 |
| South Australia | 2 | 29.9 2025: 38.3 |
16.9 2025: 28.5 |
32.1 2025: 6.2 |
10.3 2025: 13.4 |
10.8 2025: 13.7 |
Coalition −1.5, One Nation +2.9, Greens −2.1, Others +0.7 |
| Tasmania | 3 | 30.8 2025: 36.6 |
17.9 2025: 24.5 |
22.2 2025: 6.0 |
13.7 2025: 11.1 |
15.4 2025: 21.8 |
Labor +1.3, Coalition +1.0, One Nation −2.0, Greens +0.7, Others −1.1 |
| Australian Capital Territory | 1 | – 2025: 47.5 |
– 2025: 21.2 |
– 2025: 0.0 |
– 2025: 15.1 |
– 2025: 16.3 |
none (fewer than 2 pollsters) |
| Northern Territory | 1 | – 2025: 37.9 |
– 2025: 33.8 |
– 2025: 7.7 |
– 2025: 10.2 |
– 2025: 10.3 |
none (fewer than 2 pollsters) |
State figures: each pollster's latest state breakdown within 90 days of the newest, averaged, primaries rescaled to 100. Whether the state swing helps is tested on 2025 on the method page.
Figures as of . Published by Polling Forecast.

 France
 Germany
 Spain
 Canada