
Canada: seats by province
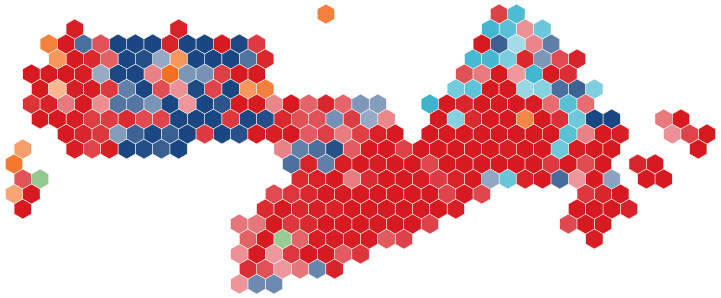
Seats are won riding by riding; here they are added up by province and territory. The small figure is the change on 2025; the range is the 80% range from our simulations; the percentage is the party's projected vote, averaged across the province's ridings.
| Province | Seats | Liberal | Conservative | Bloc | NDP | Green |
|---|---|---|---|---|---|---|
| Newfoundland and Labrador | 7 | 6 +2 4–7 55.9% |
1 −2 0–3 34.5% |
0 | 0 8.0% |
0 |
| Prince Edward Island | 4 | 4 3–4 59.9% |
0 0–1 30.5% |
0 | 0 4.9% |
0 3.1% |
| Nova Scotia | 11 | 11 +1 9–11 59.1% |
0 −1 0–2 29.7% |
0 | 0 7.2% |
0 1.7% |
| New Brunswick | 10 | 7 +1 6–9 55.1% |
3 −1 1–4 35.3% |
0 | 0 5.3% |
0 2.5% |
| Quebec | 78 | 47 +3 40–57 44.5% |
8 −3 5–10 18.0% |
22 14–29 27.7% |
1 0–1 6.5% |
0 1.4% |
| Ontario | 122 | 99 +29 75–111 52.4% |
22 −30 10–45 35.1% |
0 | 0 0–2 7.8% |
1 +1 0–1 2.6% |
| Manitoba | 14 | 7 +1 6–8 44.5% |
5 −2 4–6 33.5% |
0 | 2 +1 1–2 18.4% |
0 1.7% |
| Saskatchewan | 14 | 5 +4 2–6 32.2% |
9 −4 8–12 51.7% |
0 | 0 13.7% |
0 1.3% |
| Alberta | 37 | 5 +3 3–11 29.5% |
30 −4 24–33 54.5% |
0 | 2 +1 1–2 10.2% |
0 0.9% |
| British Columbia | 43 | 32 +12 24–36 47.7% |
5 −14 3–13 30.6% |
0 | 5 +2 2–7 15.7% |
1 0–1 4.0% |
| Yukon | 1 | 1 51.3% |
0 29.3% |
0 | 0 16.2% |
0 3.1% |
| Northwest Territories | 1 | 1 51.8% |
0 24.1% |
0 | 0 22.1% |
0 2.1% |
| Nunavut | 1 | 0 0–1 35.3% |
0 17.0% |
0 | 1 0–1 47.7% |
0 |
2025 here means the winners of the 2025 general election, before floor-crossings and by-elections.
How we read each region
Pollsters publish regional figures in six groups: Atlantic Canada, Quebec, Ontario, Manitoba and Saskatchewan, Alberta and British Columbia. For each, we take every pollster's latest regional figure from the last 90 days, measured against the same release's national figure (so a pollster that runs high on a party nationally does not push that party up in the region too), and add the average gap to our national shares. That reading is blended with what national swing alone would give, with weight n ÷ (n + 2) for n pollsters. The territories have no regional polls and follow national swing.
| Region | Pollsters | Weight | Liberal | Conservative | Bloc | NDP | Green |
|---|---|---|---|---|---|---|---|
| Atlantic Canada national swing / regional polls / 2025 | 1 | 33% | 57.1
59 / 57 / 56 |
31.7
30 / 36 / 38 |
–
– / – / – |
6.6
6 / 3 / 4 |
2.1
2 / 2 / 1 |
| Quebec national swing / regional polls / 2025 | 3 | 60% | 43.7
44 / 46 / 43 |
18.1
18 / 19 / 23 |
27.7
27 / 29 / 28 |
6.3
6 / 4 / 4 |
1.8
2 / 2 / 1 |
| Ontario national swing / regional polls / 2025 | 3 | 60% | 51.7
52 / 52 / 49 |
34.9
35 / 34 / 44 |
–
– / – / – |
7.6
7 / 5 / 5 |
3.1
3 / 4 / 1 |
| Manitoba and Saskatchewan national swing / regional polls / 2025 | 2 | 50% | 37.7
37 / 41 / 34 |
43.0
45 / 44 / 55 |
–
– / – / – |
15.2
14 / 10 / 9 |
2.0
1 / 3 / 1 |
| Alberta national swing / regional polls / 2025 | 2 | 50% | 29.0
31 / 29 / 28 |
54.4
53 / 59 / 64 |
–
– / – / – |
9.9
10 / 6 / 6 |
1.4
1 / 2 / 0 |
| British Columbia national swing / regional polls / 2025 | 2 | 50% | 46.7
42 / 54 / 42 |
30.0
31 / 30 / 41 |
–
– / – / – |
15.9
18 / 7 / 13 |
4.5
6 / 4 / 3 |
| The territories national swing / regional polls / 2025 | 0 | 0% | 48.8
52 / – / 51 |
25.4
27 / – / 35 |
–
– / – / – |
23.4
19 / – / 13 |
2.4
3 / – / 1 |
The 13 regional readings used
| Region | Pollster | Fieldwork | Liberal | Conservative | Bloc | NDP | Green |
|---|---|---|---|---|---|---|---|
| Quebec | Abacus Data | 23 Sep 2026 | 44 (−2) | 20 (−14) | 31 (+24) | – | – |
| Ontario | Abacus Data | 23 Sep 2026 | 51 (+5) | 34 (0) | – | – | – |
| Manitoba and Saskatchewan | Abacus Data | 23 Sep 2026 | 44 (−2) | 41 (+7) | – | – | – |
| Alberta | Abacus Data | 23 Sep 2026 | 34 (−12) | 54 (+20) | – | – | – |
| British Columbia | Abacus Data | 9 Sep 2026 | 50 (+3) | 32 (−1) | – | – | – |
| Atlantic Canada | Léger | 7 Sep 2026 | 57 (+11) | 35 (+3) | – | 4 (−6) | 2 (0) |
| Quebec | Léger | 7 Sep 2026 | 47 (+1) | 16 (−16) | 29 (+23) | 5 (−5) | 2 (0) |
| Ontario | Léger | 7 Sep 2026 | 53 (+7) | 34 (+2) | – | 6 (−4) | 4 (+2) |
| Manitoba and Saskatchewan | Léger | 7 Sep 2026 | 38 (−8) | 47 (+15) | – | 11 (+1) | 3 (+1) |
| Alberta | Léger | 7 Sep 2026 | 24 (−22) | 65 (+32) | – | 7 (−3) | 2 (0) |
| British Columbia | Léger | 7 Sep 2026 | 59 (+13) | 28 (−4) | – | 8 (−2) | 4 (+2) |
| Quebec | Liaison Strategies | 29 Aug 2026 | 46 (0) | 17 (−12) | 26 (+20) | – | – |
| Ontario | Liaison Strategies | 29 Aug 2026 | 50 (+4) | 32 (+3) | – | – | – |
In brackets: the regional figure minus the same release's national figure (for a stand-alone regional poll, minus our national average at the time).
Figures as of . Published by Polling Forecast.
 France
 Germany
 Spain
 Australia