
Canada · ridings
Canada: all 343 riding projections
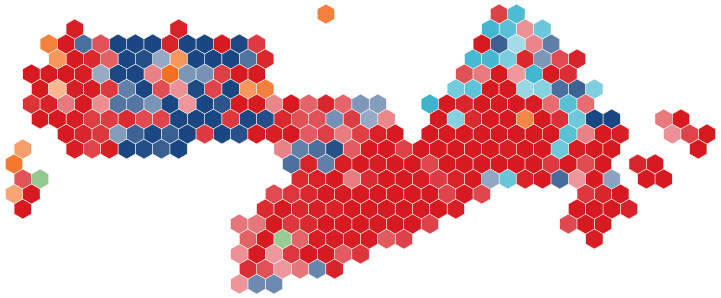
All 343 seats of Canada's House of Commons, each with our projection and its past results; today Liberal 225 seats, with 172 needed for a majority.
How good is the riding step? The 2021 result, transposed onto today's ridings and moved by the true 2025 change in each region, picked the right winner in 303 of 343 ridings. The test →
| Riding | Our projection | Lead | Chance | Second |
|---|---|---|---|---|
| Avalon | Liberal 61 | 31.0 | 99% | Conservative |
| Cape Spear—Mount Pearl—Paradise | Liberal 70 | 50.7 | over 99% | Conservative |
| Coast of Bays—Central—Notre Dame | Conservative 49 | 2.7 | 59% | Liberal |
| Labrador | Liberal 54 | 18.1 | 92% | Conservative |
| Long Range Mountains | Liberal 45 | 0.3 | 51% | Conservative |
| St. John's East | Liberal 64 | 44.5 | over 99% | Conservative |
| The Eastern Peninsulas | Liberal 51 | 8.1 | 73% | Conservative |
| Cardigan | Liberal 59 | 27.6 | 99% | Conservative |
| Charlottetown | Liberal 67 | 44.0 | over 99% | Conservative |
| Egmont | Liberal 54 | 16.7 | 90% | Conservative |
| Malpeque | Liberal 60 | 29.2 | 99% | Conservative |
| Acadie—Annapolis | Liberal 49 | 6.9 | 71% | Conservative |
| Cape Breton—Canso—Antigonish | Liberal 54 | 16.4 | 90% | Conservative |
| Central Nova | Liberal 53 | 17.1 | 91% | Conservative |
| Cumberland—Colchester | Liberal 50 | 10.5 | 80% | Conservative |
| Dartmouth—Cole Harbour | Liberal 69 | 52.9 | over 99% | Conservative |
| Halifax | Liberal 65 | 46.2 | over 99% | NDP |
| Halifax West—Peggy's Cove | Liberal 68 | 46.8 | over 99% | Conservative |
| Kings—Hants | Liberal 63 | 35.4 | over 99% | Conservative |
| Sackville—Bedford—Preston | Liberal 64 | 37.9 | over 99% | Conservative |
| South Shore—St. Margarets | Liberal 58 | 22.2 | 96% | Conservative |
| Sydney—Glace Bay | Liberal 57 | 24.7 | 97% | Conservative |
| Acadie—Bathurst | Liberal 70 | 50.4 | over 99% | Conservative |
| Beauséjour | Liberal 62 | 35.2 | over 99% | Conservative |
| Fredericton—Oromocto | Liberal 63 | 36.9 | over 99% | Conservative |
| Fundy Royal | Conservative 47 | 5.4 | 67% | Liberal |
| Madawaska—Restigouche | Liberal 58 | 23.9 | 97% | Conservative |
| Miramichi—Grand Lake | Liberal 49 | 7.0 | 71% | Conservative |
| Moncton—Dieppe | Liberal 66 | 40.3 | over 99% | Conservative |
| Saint John—Kennebecasis | Liberal 60 | 28.9 | 99% | Conservative |
| New Brunswick Southwest | Conservative 47 | 3.7 | 60% | Liberal |
| Tobique—Mactaquac | Conservative 53 | 15.2 | 89% | Liberal |
| Abitibi—Baie-James—Nunavik—Eeyou | Liberal 43 | 8.5 | 77% | Bloc |
| Abitibi—Témiscamingue | Bloc 50 | 21.6 | 97% | Liberal |
| Ahuntsic-Cartierville | Liberal 63 | 45.9 | over 99% | Bloc |
| Alfred-Pellan | Liberal 57 | 36.0 | over 99% | Bloc |
| Argenteuil—Papineau—Des Collines | Liberal 49 | 26.0 | 99% | Bloc |
| Beauce | Conservative 55 | 34.8 | over 99% | Liberal |
| Vallée-du-Haut-Saint-Laurent | Bloc 44 | 10.8 | 83% | Liberal |
| Beauport—Limoilou | Liberal 37 | 8.1 | 73% | Bloc |
| Bécancour—Nicolet—Saurel—Alnôbak | Bloc 47 | 18.7 | 96% | Liberal |
| Bellechasse—Les Etchemins—Lévis | Conservative 45 | 14.5 | 91% | Liberal |
| Beloeil—Chambly | Bloc 49 | 13.4 | 89% | Liberal |
| Berthier—Maskinongé | Bloc 35 | 9.7 | 78% | Liberal |
| Bourassa | Liberal 60 | 42.9 | over 99% | Bloc |
| Brome—Missisquoi | Liberal 50 | 21.5 | 98% | Bloc |
| Brossard—Saint-Lambert | Liberal 64 | 50.1 | over 99% | Conservative |
| Charlesbourg—Haute-Saint-Charles | Conservative 38 | 1.5 | 55% | Liberal |
| Châteauguay—Les Jardins-de-Napierville | Liberal 47 | 17.3 | 95% | Bloc |
| Chicoutimi—Le Fjord | Liberal 32 | 1.0 | 44% | Bloc |
| Compton—Stanstead | Liberal 47 | 20.5 | 97% | Bloc |
| Côte-du-Sud—Rivière-du-Loup—Kataskomiq—Témiscouata | Conservative 41 | 9.2 | 81% | Liberal |
| Côte-Nord—Kawawachikamach—Nitassinan | Bloc 44 | 15.4 | 92% | Liberal |
| Dorval—Lachine—LaSalle | Liberal 60 | 45.0 | over 99% | Conservative |
| Drummond | Bloc 44 | 13.5 | 89% | Liberal |
| Gaspésie—Les Îles-de-la-Madeleine—Listuguj | Bloc 46 | 6.5 | 71% | Liberal |
| Gatineau | Liberal 62 | 45.7 | over 99% | Bloc |
| Hochelaga—Rosemont-Est | Liberal 48 | 20.2 | 96% | Bloc |
| Honoré-Mercier | Liberal 62 | 45.4 | over 99% | Conservative |
| Hull—Aylmer | Liberal 63 | 51.1 | over 99% | Bloc |
| Joliette—Manawan | Bloc 50 | 17.1 | 94% | Liberal |
| Jonquière—Hébertville—Pays-des-Bleuets | Bloc 40 | 13.0 | 87% | Liberal |
| La Pointe-de-l'Île | Bloc 43 | 4.3 | 66% | Liberal |
| La Prairie—Atateken | Liberal 46 | 10.4 | 83% | Bloc |
| Lac-Saint-Jean | Bloc 47 | 19.2 | 96% | Liberal |
| Lac-Saint-Louis | Liberal 69 | 50.7 | over 99% | Conservative |
| LaSalle—Émard—Verdun | Liberal 52 | 30.7 | over 99% | Bloc |
| Laurentides—Labelle | Bloc 45 | 8.6 | 79% | Liberal |
| Laurier—Sainte-Marie | Liberal 53 | 32.6 | over 99% | NDP |
| Laval—Les Îles | Liberal 52 | 24.4 | 99% | Conservative |
| Les Pays-d'en-Haut | Liberal 42 | 6.0 | 72% | Bloc |
| Lévis—Lotbinière | Conservative 43 | 12.1 | 88% | Liberal |
| Longueuil—Charles-LeMoyne—Greenfield Park | Liberal 51 | 24.0 | 99% | Bloc |
| Longueuil—Saint-Hubert | Liberal 43 | 2.5 | 57% | Bloc |
| Louis-Hébert | Liberal 58 | 35.8 | over 99% | Bloc |
| Louis-Saint-Laurent—Akiawenhrahk | Conservative 40 | 5.6 | 70% | Liberal |
| Marc-Aurèle-Fortin | Liberal 54 | 30.2 | over 99% | Bloc |
| Mégantic—L’Érable—Lotbinière | Conservative 54 | 31.3 | over 99% | Liberal |
| Mirabel | Bloc 40 | 5.5 | 69% | Liberal |
| Mount Royal | Liberal 53 | 17.2 | 94% | Conservative |
| Mont-Saint-Bruno—L’Acadie | Liberal 49 | 13.2 | 88% | Bloc |
| Montcalm | Bloc 48 | 19.0 | 96% | Liberal |
| Montmorency—Charlevoix | Bloc 34 | 3.8 | 52% | Liberal |
| Notre-Dame-de-Grâce—Westmount | Liberal 65 | 50.7 | over 99% | Conservative |
| Outremont | Liberal 57 | 44.5 | over 99% | NDP |
| Papineau | Liberal 55 | 36.3 | over 99% | NDP |
| Pierre-Boucher—Les Patriotes—Verchères | Bloc 47 | 6.3 | 71% | Liberal |
| Pierrefonds—Dollard | Liberal 62 | 36.2 | over 99% | Conservative |
| Pontiac—Kitigan Zibi | Liberal 56 | 33.6 | over 99% | Conservative |
| Saint-Augustin—Portneuf—Jacques-Cartier | Conservative 45 | 14.3 | 92% | Liberal |
| Québec Centre | Liberal 49 | 14.1 | 90% | Bloc |
| Repentigny | Bloc 43 | 2.4 | 58% | Liberal |
| Richmond—Arthabaska—des-Sources | Liberal 34 | 3.9 | 56% | Conservative |
| Rimouski-Neigette—Mitis—Matapédia—Les Basques | Bloc 47 | 9.6 | 81% | Liberal |
| Rivière-des-Mille-Îles | Liberal 47 | 13.9 | 90% | Bloc |
| Rivière-du-Nord | Bloc 45 | 11.4 | 85% | Liberal |
| Rosemont—La Petite-Patrie | NDP 43 | 10.2 | 84% | Liberal |
| Saint-Hyacinthe—Bagot—Acton | Bloc 44 | 9.2 | 79% | Liberal |
| Saint-Jean | Bloc 45 | 9.0 | 80% | Liberal |
| Saint-Laurent | Liberal 60 | 37.0 | over 99% | Conservative |
| Saint-Léonard—Saint-Michel | Liberal 68 | 52.0 | over 99% | Conservative |
| Saint-Maurice—Champlain | Liberal 51 | 29.9 | over 99% | Bloc |
| Shefford | Liberal 41 | 0.3 | 50% | Bloc |
| Sherbrooke | Liberal 53 | 26.0 | 99% | Bloc |
| Terrebonne | Liberal 40 | 1.1 | 55% | Bloc |
| Thérèse-De Blainville | Liberal 48 | 14.8 | 91% | Bloc |
| Trois-Rivières | Liberal 42 | 14.5 | 91% | Bloc |
| Vaudreuil | Liberal 59 | 41.7 | over 99% | Conservative |
| Ville-Marie—Le Sud-Ouest—Île-des-Soeurs | Liberal 65 | 51.6 | over 99% | Conservative |
| Vimy | Liberal 56 | 35.8 | over 99% | Conservative |
| Ajax | Liberal 59 | 28.9 | 99% | Conservative |
| Algonquin—Renfrew—Pembroke | Conservative 47 | 6.5 | 71% | Liberal |
| Aurora—Oak Ridges—Richmond Hill | Conservative 46 | 0.5 | 50% | Liberal |
| Barrie South—Innisfil | Conservative 50 | 8.7 | 76% | Liberal |
| Barrie—Springwater—Oro-Medonte | Liberal 47 | 4.2 | 64% | Conservative |
| Bay of Quinte | Liberal 54 | 17.5 | 93% | Conservative |
| Beaches—East York | Liberal 71 | 56.0 | over 99% | Conservative |
| Bowmanville—Oshawa North | Liberal 48 | 7.2 | 74% | Conservative |
| Brampton Centre | Liberal 51 | 13.0 | 86% | Conservative |
| Brampton—Chinguacousy Park | Liberal 51 | 15.9 | 91% | Conservative |
| Brampton East | Liberal 52 | 15.7 | 90% | Conservative |
| Brampton North—Caledon | Liberal 53 | 13.5 | 87% | Conservative |
| Brampton South | Liberal 53 | 13.6 | 87% | Conservative |
| Brampton West | Liberal 50 | 9.4 | 79% | Conservative |
| Brantford—Brant South | Liberal 44 | 0.1 | 50% | Conservative |
| Bruce—Grey—Owen Sound | Conservative 44 | 1.5 | 55% | Liberal |
| Burlington | Liberal 58 | 26.7 | 99% | Conservative |
| Burlington North—Milton West | Liberal 57 | 20.6 | 95% | Conservative |
| Cambridge | Liberal 49 | 9.3 | 78% | Conservative |
| Carleton | Liberal 54 | 16.8 | 92% | Conservative |
| Chatham-Kent—Leamington | Conservative 49 | 10.2 | 81% | Liberal |
| Davenport | Liberal 61 | 40.7 | over 99% | NDP |
| Don Valley North | Liberal 56 | 22.3 | 98% | Conservative |
| Don Valley West | Liberal 66 | 41.1 | over 99% | Conservative |
| Dufferin—Caledon | Conservative 51 | 13.5 | 88% | Liberal |
| Eglinton—Lawrence | Liberal 52 | 13.1 | 86% | Conservative |
| Elgin—St. Thomas—London South | Liberal 47 | 4.6 | 65% | Conservative |
| Essex | Conservative 50 | 9.7 | 78% | Liberal |
| Etobicoke Centre | Liberal 58 | 21.8 | 96% | Conservative |
| Etobicoke—Lakeshore | Liberal 61 | 30.7 | over 99% | Conservative |
| Etobicoke North | Liberal 55 | 23.1 | 98% | Conservative |
| Flamborough—Glanbrook—Brant North | Liberal 46 | 2.0 | 57% | Conservative |
| Guelph | Liberal 57 | 35.4 | over 99% | Conservative |
| Haldimand—Norfolk | Conservative 49 | 9.7 | 80% | Liberal |
| Haliburton—Kawartha Lakes | Conservative 49 | 6.6 | 71% | Liberal |
| Hamilton Centre | Liberal 40 | 8.2 | 78% | NDP |
| Hamilton East—Stoney Creek | Liberal 51 | 9.6 | 79% | Conservative |
| Hamilton Mountain | Liberal 49 | 15.9 | 92% | Conservative |
| Hamilton West—Ancaster—Dundas | Liberal 59 | 30.8 | 99% | Conservative |
| Hastings—Lennox and Addington—Tyendinaga | Conservative 46 | 2.5 | 58% | Liberal |
| Humber River—Black Creek | Liberal 59 | 31.9 | over 99% | Conservative |
| Huron—Bruce | Conservative 44 | 0.1 | 50% | Liberal |
| Kanata | Liberal 64 | 36.8 | over 99% | Conservative |
| Kapuskasing—Timmins—Mushkegowuk | Liberal 43 | 1.6 | 56% | Conservative |
| Kenora—Kiiwetinoong | Conservative 40 | 2.1 | 58% | Liberal |
| Kingston and the Islands | Liberal 67 | 44.8 | over 99% | Conservative |
| King—Vaughan | Conservative 53 | 14.3 | 89% | Liberal |
| Kitchener Centre | Green 36 | 3.8 | 62% | Liberal |
| Kitchener—Conestoga | Liberal 52 | 12.7 | 86% | Conservative |
| Kitchener South—Hespeler | Liberal 49 | 9.8 | 80% | Conservative |
| Lanark—Frontenac | Liberal 49 | 6.7 | 71% | Conservative |
| Leeds—Grenville—Thousand Islands—Rideau Lakes | Liberal 47 | 5.9 | 68% | Conservative |
| London Centre | Liberal 59 | 37.1 | over 99% | Conservative |
| London—Fanshawe | Liberal 34 | 1.5 | 44% | Conservative |
| London West | Liberal 59 | 30.9 | over 99% | Conservative |
| Markham—Stouffville | Liberal 54 | 17.6 | 93% | Conservative |
| Markham—Thornhill | Liberal 58 | 24.9 | 98% | Conservative |
| Markham—Unionville | Liberal 50 | 8.0 | 75% | Conservative |
| Middlesex—London | Liberal 45 | 1.9 | 58% | Conservative |
| Milton East—Halton Hills South | Liberal 51 | 11.5 | 84% | Conservative |
| Mississauga Centre | Liberal 58 | 23.9 | 98% | Conservative |
| Mississauga East—Cooksville | Liberal 54 | 17.4 | 93% | Conservative |
| Mississauga—Erin Mills | Liberal 58 | 27.2 | 99% | Conservative |
| Mississauga—Lakeshore | Liberal 55 | 19.8 | 96% | Conservative |
| Mississauga—Malton | Liberal 58 | 23.3 | 97% | Conservative |
| Mississauga—Streetsville | Liberal 55 | 18.3 | 94% | Conservative |
| Nepean | Liberal 67 | 42.5 | over 99% | Conservative |
| Newmarket—Aurora | Liberal 51 | 8.2 | 75% | Conservative |
| York—South Simcoe | Conservative 51 | 11.0 | 82% | Liberal |
| Niagara Falls—Niagara-on-the-Lake | Liberal 47 | 7.2 | 73% | Conservative |
| Niagara South | Liberal 46 | 7.6 | 75% | Conservative |
| Niagara West | Liberal 47 | 3.0 | 60% | Conservative |
| Nipissing—Timiskaming | Liberal 50 | 14.3 | 90% | Conservative |
| Northumberland—Clarke | Liberal 48 | 8.4 | 76% | Conservative |
| Oakville East | Liberal 54 | 17.8 | 93% | Conservative |
| Oakville West | Liberal 56 | 20.1 | 96% | Conservative |
| Orléans | Liberal 70 | 50.9 | over 99% | Conservative |
| Oshawa | Liberal 46 | 6.4 | 71% | Conservative |
| Ottawa Centre | Liberal 66 | 43.1 | over 99% | NDP |
| Ottawa South | Liberal 68 | 49.9 | over 99% | Conservative |
| Ottawa—Vanier—Gloucester | Liberal 70 | 57.4 | over 99% | Conservative |
| Ottawa West—Nepean | Liberal 66 | 48.0 | over 99% | Conservative |
| Oxford | Conservative 44 | 3.7 | 61% | Liberal |
| Parry Sound—Muskoka | Liberal 47 | 2.0 | 58% | Conservative |
| Perth—Wellington | Conservative 45 | 0.8 | 52% | Liberal |
| Peterborough | Liberal 57 | 24.7 | 98% | Conservative |
| Pickering—Brooklin | Liberal 57 | 24.5 | 98% | Conservative |
| Prescott—Russell—Cumberland | Liberal 57 | 25.9 | 99% | Conservative |
| Richmond Hill South | Liberal 47 | 3.6 | 62% | Conservative |
| Sarnia—Lambton—Bkejwanong | Conservative 45 | 3.9 | 62% | Liberal |
| Sault Ste. Marie—Algoma | Liberal 50 | 14.2 | 89% | Conservative |
| Scarborough—Agincourt | Liberal 59 | 23.8 | 97% | Conservative |
| Scarborough Centre—Don Valley East | Liberal 62 | 31.7 | over 99% | Conservative |
| Scarborough—Guildwood—Rouge Park | Liberal 68 | 44.5 | over 99% | Conservative |
| Scarborough North | Liberal 68 | 42.8 | over 99% | Conservative |
| Scarborough Southwest | Liberal 64 | 42.4 | over 99% | Conservative |
| Scarborough—Woburn | Liberal 63 | 37.9 | over 99% | Conservative |
| Simcoe—Grey | Liberal 46 | 2.8 | 60% | Conservative |
| Simcoe North | Liberal 47 | 7.8 | 75% | Conservative |
| Spadina—Harbourfront | Liberal 63 | 40.8 | over 99% | Conservative |
| St. Catharines | Liberal 56 | 23.5 | 97% | Conservative |
| Stormont—Dundas—Glengarry | Conservative 48 | 5.1 | 66% | Liberal |
| Sudbury | Liberal 56 | 24.9 | 98% | Conservative |
| Sudbury East—Manitoulin—Nickel Belt | Liberal 44 | 4.7 | 65% | Conservative |
| Taiaiako'n—Parkdale—High Park | Liberal 59 | 32.7 | over 99% | NDP |
| Thornhill | Conservative 58 | 24.0 | 98% | Liberal |
| Thunder Bay—Rainy River | Liberal 52 | 17.3 | 93% | Conservative |
| Thunder Bay—Superior North | Liberal 58 | 31.3 | over 99% | Conservative |
| Toronto Centre | Liberal 67 | 51.6 | over 99% | NDP |
| Toronto—Danforth | Liberal 69 | 53.6 | over 99% | NDP |
| Toronto—St. Paul's | Liberal 64 | 40.3 | over 99% | Conservative |
| University—Rosedale | Liberal 67 | 52.3 | over 99% | Conservative |
| Vaughan—Woodbridge | Conservative 53 | 10.8 | 81% | Liberal |
| Waterloo | Liberal 62 | 38.4 | over 99% | Conservative |
| Wellington—Halton Hills North | Liberal 47 | 5.3 | 68% | Conservative |
| Whitby | Liberal 56 | 20.5 | 96% | Conservative |
| Willowdale | Liberal 58 | 21.7 | 96% | Conservative |
| Windsor—Tecumseh—Lakeshore | Liberal 48 | 11.5 | 83% | Conservative |
| Windsor West | Liberal 33 | 2.9 | 48% | NDP |
| North York | Conservative 48 | 0.7 | 52% | Liberal |
| York—Durham | Conservative 47 | 4.6 | 65% | Liberal |
| York South—Weston—Etobicoke | Liberal 60 | 28.0 | 99% | Conservative |
| Brandon—Souris | Conservative 52 | 24.0 | 98% | Liberal |
| Churchill—Keewatinook Aski | Liberal 50 | 14.9 | 92% | NDP |
| Elmwood—Transcona | NDP 40 | 10.6 | 78% | Conservative |
| Kildonan—St. Paul | Liberal 49 | 12.9 | 86% | Conservative |
| Portage—Lisgar | Conservative 58 | 31.3 | over 99% | Liberal |
| Provencher | Conservative 55 | 25.2 | 98% | Liberal |
| Riding Mountain | Conservative 56 | 30.4 | 99% | Liberal |
| St. Boniface—St. Vital | Liberal 65 | 43.8 | over 99% | Conservative |
| Selkirk—Interlake—Eastman | Conservative 48 | 14.3 | 89% | Liberal |
| Winnipeg Centre | NDP 45 | 6.2 | 71% | Liberal |
| Winnipeg North | Liberal 61 | 39.0 | over 99% | Conservative |
| Winnipeg South | Liberal 63 | 39.6 | over 99% | Conservative |
| Winnipeg South Centre | Liberal 67 | 51.3 | over 99% | Conservative |
| Winnipeg West | Liberal 59 | 29.5 | 99% | Conservative |
| Battlefords—Lloydminster—Meadow Lake | Conservative 65 | 42.5 | over 99% | Liberal |
| Carlton Trail—Eagle Creek | Conservative 67 | 46.1 | over 99% | Liberal |
| Desnethé—Missinippi—Churchill River | Liberal 70 | 54.9 | over 99% | NDP |
| Moose Jaw—Lake Centre—Lanigan | Conservative 60 | 40.0 | over 99% | Liberal |
| Prince Albert | Conservative 61 | 37.8 | over 99% | Liberal |
| Regina—Lewvan | Liberal 47 | 8.5 | 77% | Conservative |
| Regina—Qu'Appelle | Conservative 53 | 22.0 | 97% | Liberal |
| Regina—Wascana | Liberal 48 | 9.1 | 79% | Conservative |
| Saskatoon South | Liberal 44 | 6.6 | 72% | Conservative |
| Saskatoon East | Liberal 45 | 8.0 | 76% | Conservative |
| Saskatoon West | Conservative 41 | 10.1 | 79% | Liberal |
| Souris—Moose Mountain | Conservative 73 | 59.1 | over 99% | Liberal |
| Swift Current—Grasslands—Kindersley | Conservative 72 | 56.4 | over 99% | Liberal |
| Yorkton—Melville | Conservative 66 | 48.0 | over 99% | Liberal |
| Airdrie—Cochrane | Conservative 63 | 37.8 | over 99% | Liberal |
| Battle River—Crowfoot | Conservative 76 | 62.6 | over 99% | Liberal |
| Bow River | Conservative 71 | 52.5 | over 99% | Liberal |
| Calgary Centre | Liberal 47 | 5.9 | 70% | Conservative |
| Calgary Confederation | Liberal 49 | 12.2 | 86% | Conservative |
| Calgary Crowfoot | Conservative 50 | 11.1 | 82% | Liberal |
| Calgary East | Conservative 51 | 18.4 | 93% | Liberal |
| Calgary Heritage | Conservative 53 | 16.7 | 92% | Liberal |
| Calgary McKnight | Liberal 47 | 7.2 | 73% | Conservative |
| Calgary Midnapore | Conservative 58 | 26.0 | 98% | Liberal |
| Calgary Nose Hill | Conservative 51 | 13.0 | 87% | Liberal |
| Calgary Shepard | Conservative 60 | 30.3 | 99% | Liberal |
| Calgary Signal Hill | Conservative 51 | 13.6 | 86% | Liberal |
| Calgary Skyview | Conservative 47 | 7.7 | 74% | Liberal |
| Edmonton Centre | Liberal 46 | 17.0 | 94% | Conservative |
| Edmonton Gateway | Conservative 42 | 3.0 | 58% | Liberal |
| Edmonton Griesbach | NDP 38 | 1.5 | 56% | Conservative |
| Edmonton Manning | Conservative 46 | 7.7 | 73% | Liberal |
| Edmonton Northwest | Conservative 46 | 5.0 | 66% | Liberal |
| Edmonton Riverbend | Liberal 48 | 5.1 | 68% | Conservative |
| Edmonton Southeast | Conservative 44 | 3.8 | 61% | Liberal |
| Edmonton Strathcona | NDP 51 | 26.7 | 99% | Conservative |
| Edmonton West | Conservative 44 | 1.9 | 55% | Liberal |
| Foothills | Conservative 69 | 48.3 | over 99% | Liberal |
| Fort McMurray—Cold Lake | Conservative 71 | 55.3 | over 99% | Liberal |
| Grande Prairie | Conservative 73 | 60.1 | over 99% | Liberal |
| Lakeland | Conservative 72 | 58.5 | over 99% | Liberal |
| Leduc—Wetaskiwin | Conservative 66 | 47.5 | over 99% | Liberal |
| Lethbridge | Conservative 52 | 18.0 | 93% | Liberal |
| Medicine Hat—Cardston—Warner | Conservative 70 | 50.6 | over 99% | Liberal |
| Parkland | Conservative 66 | 47.0 | over 99% | Liberal |
| Peace River—Westlock | Conservative 69 | 55.9 | over 99% | Liberal |
| Ponoka—Didsbury | Conservative 74 | 59.4 | over 99% | NDP |
| Red Deer | Conservative 62 | 39.3 | over 99% | Liberal |
| Sherwood Park—Fort Saskatchewan | Conservative 57 | 28.8 | 99% | Liberal |
| St. Albert—Sturgeon River | Conservative 55 | 24.0 | 98% | Liberal |
| Yellowhead | Conservative 60 | 33.9 | over 99% | Liberal |
| Abbotsford—South Langley | Liberal 39 | 6.9 | 73% | Conservative |
| Burnaby Central | Liberal 49 | 20.3 | 96% | Conservative |
| Burnaby North—Seymour | Liberal 66 | 42.5 | over 99% | Conservative |
| Cariboo—Prince George—Omineca | Conservative 49 | 13.8 | 89% | Liberal |
| Chilliwack—Hope | Conservative 44 | 3.3 | 61% | Liberal |
| Cloverdale—Langley City | Liberal 52 | 14.9 | 90% | Conservative |
| Columbia—Kootenay—Southern Rockies | Conservative 39 | 6.1 | 70% | Liberal |
| Coquitlam—Port Coquitlam | Liberal 52 | 20.5 | 96% | Conservative |
| Courtenay—Alberni | NDP 43 | 14.9 | 90% | Liberal |
| Cowichan—Malahat—Langford | NDP 36 | 2.4 | 56% | Liberal |
| Delta | Liberal 59 | 25.5 | 98% | Conservative |
| Esquimalt—Saanich—Sooke | Liberal 54 | 32.9 | over 99% | NDP |
| Fleetwood—Port Kells | Liberal 54 | 20.1 | 96% | Conservative |
| Kamloops—Shuswap—Central Rockies | Liberal 45 | 2.9 | 60% | Conservative |
| Kamloops—Thompson—Nicola | Liberal 46 | 4.8 | 65% | Conservative |
| Kelowna | Liberal 55 | 18.3 | 94% | Conservative |
| Langley Township—Fraser Heights | Liberal 48 | 7.6 | 74% | Conservative |
| Mission—Matsqui—Abbotsford | Conservative 46 | 4.0 | 64% | Liberal |
| Nanaimo—Ladysmith | Liberal 33 | 8.5 | 72% | Conservative |
| New Westminster—Burnaby—Maillardville | Liberal 40 | 5.6 | 70% | NDP |
| North Island—Powell River | NDP 35 | 4.3 | 57% | Liberal |
| North Vancouver—Capilano | Liberal 65 | 42.2 | over 99% | Conservative |
| Okanagan Lake West—South Kelowna | Liberal 49 | 9.3 | 79% | Conservative |
| Pitt Meadows—Maple Ridge | Liberal 51 | 14.5 | 89% | Conservative |
| Port Moody—Coquitlam | Liberal 49 | 19.3 | 96% | Conservative |
| Prince George—Peace River—Northern Rockies | Conservative 61 | 36.0 | over 99% | Liberal |
| Richmond Centre—Marpole | Liberal 50 | 11.4 | 83% | Conservative |
| Richmond East—Steveston | Liberal 54 | 18.5 | 93% | Conservative |
| Saanich—Gulf Islands | Green 41 | 3.9 | 64% | Liberal |
| Similkameen—South Okanagan—West Kootenay | Liberal 43 | 9.4 | 80% | Conservative |
| Skeena—Bulkley Valley | NDP 42 | 6.2 | 72% | Conservative |
| South Surrey—White Rock | Liberal 56 | 21.3 | 96% | Conservative |
| Surrey Centre | Liberal 53 | 20.9 | 97% | Conservative |
| Surrey Newton | Liberal 55 | 21.9 | 97% | Conservative |
| Vancouver Centre | Liberal 60 | 41.0 | over 99% | Conservative |
| Vancouver East | NDP 47 | 6.1 | 71% | Liberal |
| Vancouver Fraserview—South Burnaby | Liberal 58 | 33.2 | over 99% | Conservative |
| Vancouver Granville | Liberal 68 | 50.4 | over 99% | Conservative |
| Vancouver Kingsway | Liberal 42 | 1.5 | 56% | NDP |
| Vancouver Quadra | Liberal 69 | 49.7 | over 99% | Conservative |
| Vernon—Lake Country—Monashee | Liberal 49 | 8.7 | 77% | Conservative |
| Victoria | Liberal 59 | 31.4 | over 99% | NDP |
| West Vancouver—Sunshine Coast—Sea to Sky Country | Liberal 65 | 42.9 | over 99% | Conservative |
| Yukon | Liberal 51 | 22.0 | 96% | Conservative |
| Northwest Territories | Liberal 52 | 27.7 | 98% | Conservative |
| Nunavut | NDP 48 | 12.3 | 81% | Liberal |
Lead: the projected winner's margin over second place, in points of the riding vote. Chance: how often the projected winner wins in our 5,000 simulations.
Ridings where replaying a past polling miss on today's polls hands the riding to a different party from our projection.
| Riding | Our bet | Miss like 2000 | Miss like 2004 | Miss like 2006 | Miss like 2008 | Miss like 2011 | Miss like 2015 | Miss like 2019 | Miss like 2021 | Miss like 2025 |
|---|---|---|---|---|---|---|---|---|---|---|
| Brantford—Brant South ON | Liberal | Conservative | same | same | Conservative | Conservative | same | Conservative | Conservative | Conservative |
| Long Range Mountains NL | Liberal | Conservative | same | same | Conservative | Conservative | same | Conservative | Conservative | Conservative |
| Shefford QC | Liberal | Bloc | same | same | Bloc | same | same | Bloc | Bloc | Bloc |
| London—Fanshawe ON | Liberal | same | same | same | Conservative | Conservative | same | Conservative | Conservative | Conservative |
| Kapuskasing—Timmins—Mushkegowuk ON | Liberal | same | same | same | Conservative | Conservative | same | Conservative | Conservative | Conservative |
| Cowichan—Malahat—Langford BC | NDP | same | Liberal | Liberal | same | same | Liberal | Liberal | same | Liberal |
| Edmonton Griesbach AB | NDP | same | same | same | Conservative | same | same | Conservative | Conservative | Conservative |
| Huron—Bruce ON | Conservative | same | Liberal | Liberal | same | same | Liberal | same | same | same |
| Aurora—Oak Ridges—Richmond Hill ON | Conservative | same | Liberal | Liberal | same | same | Liberal | same | same | same |
| Chicoutimi—Le Fjord QC | Liberal | Bloc | same | same | Bloc | same | same | same | Bloc | same |
| Terrebonne QC | Liberal | Bloc | same | same | Bloc | same | same | same | Bloc | same |
| North York ON | Conservative | same | Liberal | Liberal | same | same | same | same | same | same |
| Perth—Wellington ON | Conservative | same | Liberal | Liberal | same | same | same | same | same | same |
| Bruce—Grey—Owen Sound ON | Conservative | same | Liberal | Liberal | same | same | same | same | same | same |
| Charlesbourg—Haute-Saint-Charles QC | Conservative | same | Liberal | Liberal | same | same | same | same | same | same |
| Middlesex—London ON | Liberal | same | same | same | Conservative | Conservative | same | same | same | same |
| Edmonton West AB | Conservative | same | Liberal | Liberal | same | same | same | same | same | same |
| Parry Sound—Muskoka ON | Liberal | same | same | same | Conservative | Conservative | same | same | same | same |
| Flamborough—Glanbrook—Brant North ON | Liberal | same | same | same | Conservative | Conservative | same | same | same | same |
| Kenora—Kiiwetinoong ON | Conservative | same | Liberal | Liberal | same | same | same | same | same | same |
| Longueuil—Saint-Hubert QC | Liberal | Bloc | same | same | same | same | same | same | Bloc | same |
| Hastings—Lennox and Addington—Tyendinaga ON | Conservative | same | Liberal | Liberal | same | same | same | same | same | same |
| Coast of Bays—Central—Notre Dame NL | Conservative | same | Liberal | Liberal | same | same | same | same | same | same |
| Simcoe—Grey ON | Liberal | same | same | same | Conservative | Conservative | same | same | same | same |
| Edmonton Gateway AB | Conservative | same | Liberal | Liberal | same | same | same | same | same | same |
| Chilliwack—Hope BC | Conservative | same | Liberal | Liberal | same | same | same | same | same | same |
| New Brunswick Southwest NB | Conservative | same | Liberal | Liberal | same | same | same | same | same | same |
| Oxford ON | Conservative | same | Liberal | Liberal | same | same | same | same | same | same |
| Edmonton Southeast AB | Conservative | same | Liberal | Liberal | same | same | same | same | same | same |
| Sarnia—Lambton—Bkejwanong ON | Conservative | same | Liberal | Liberal | same | same | same | same | same | same |
| Mission—Matsqui—Abbotsford BC | Conservative | same | Liberal | Liberal | same | same | same | same | same | same |
| North Island—Powell River BC | NDP | same | Liberal | same | same | same | same | Liberal | same | same |
| York—Durham ON | Conservative | same | Liberal | Liberal | same | same | same | same | same | same |
| Vancouver Kingsway BC | Liberal | same | same | same | same | NDP | same | same | same | same |
| Repentigny QC | Bloc | same | same | Liberal | same | same | same | same | same | same |
| Kamloops—Shuswap—Central Rockies BC | Liberal | same | same | same | same | Conservative | same | same | same | same |
| Niagara West ON | Liberal | same | same | same | same | Conservative | same | same | same | same |
| Montmorency—Charlevoix QC | Bloc | same | same | Liberal | same | same | same | same | same | same |
| Saanich—Gulf Islands BC | Green | same | Liberal | same | same | same | same | same | same | same |
| La Pointe-de-l'Île QC | Bloc | same | same | Liberal | same | same | same | same | same | same |
| Edmonton Northwest AB | Conservative | same | Liberal | same | same | same | same | same | same | same |
| Stormont—Dundas—Glengarry ON | Conservative | same | Liberal | same | same | same | same | same | same | same |
| Fundy Royal NB | Conservative | same | Liberal | same | same | same | same | same | same | same |
| Mirabel QC | Bloc | same | same | Liberal | same | same | same | same | same | same |
| Pierre-Boucher—Les Patriotes—Verchères QC | Bloc | same | same | Liberal | same | same | same | same | same | same |
| Gaspésie—Les Îles-de-la-Madeleine—Listuguj QC | Bloc | same | same | Liberal | same | same | same | same | same | same |
| Haliburton—Kawartha Lakes ON | Conservative | same | Liberal | same | same | same | same | same | same | same |
Figures as of . Published by Polling Forecast.
 United Kingdom
 France
 Germany
 Spain
 Italy
 Netherlands
 Poland
 Australia