Surrey Centre
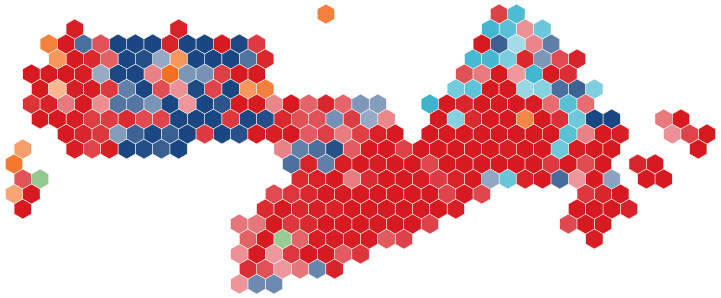
Surrey Centre is one of 343 ridings, in British Columbia. On our projection the Liberals lead here by 20.9 points, as it did last time.
Surrey-Centre
The Liberals win · 97% chance · lead 20.9 points
Chances are counted over our 5,000 simulated elections.
The Liberals won it in 2025. The riding moves with British Columbia: our regional reading has Liberal 47%, Conservative 30%, NDP 16%, Green 4%.
| Party | Projected vote | Win chance | 2025 | 2021* |
|---|---|---|---|---|
| Liberal | 52.9 | 97% | 48.0 | 44.6 |
| Conservative | 32.1 | 3% | 43.2 | 20.7 |
| NDP | 9.6 | 6.8 | 27.6 | |
| Green | 2.5 | 1.0 | 2.2 | |
| Others | 2.0 | 0.4 | 1.1 | |
| PPC | 0.9 | 0.6 | 3.9 |
* 2021 as transposed by Elections Canada onto the 2023 boundaries (a notional result). Shares of valid votes.
Under each reading of the polls
| Reading | Winner |
|---|---|
| The polls as they stand | Liberal |
| Our projection | Liberal |
| If the polls miss like 2000 | Liberal |
| If the polls miss like 2004 | Liberal |
| If the polls miss like 2006 | Liberal |
| If the polls miss like 2008 | Liberal |
| If the polls miss like 2011 | Liberal |
| If the polls miss like 2015 | Liberal |
| If the polls miss like 2019 | Liberal |
| If the polls miss like 2021 | Liberal |
| If the polls miss like 2025 | Liberal |
The same winner under every past miss.
The 2025 result
Electors on the lists: 71,528 · turnout 58.5% · 2021 (transposed): 52.3%
| Candidate | Party | Votes | % |
|---|---|---|---|
| Randeep Sarai ✓ (incumbent) | Liberal | 19,900 | 48.0 |
| Rajvir Dhillon | Conservative | 17,920 | 43.2 |
| Dominic Denofrio | NDP | 2,811 | 6.8 |
| Krishan Khurana | Green | 395 | 1.0 |
| Beverly Tanchak | PPC | 246 | 0.6 |
| Ryan Abbott | Communist Party of Canada | 182 | 0.4 |
Who lives here
2021 census (Statistics Canada) on the 2023 boundaries, against Canada as a whole; rank 1 is the highest of 343.
| Measure | Here | Canada | Rank |
|---|---|---|---|
| Population, 2021 | 119,724 | 36,991,981 | 69 / 343 |
| Population density (per km2 of the area above) | 2,814/km² | 4/km² | 56 / 343 |
| Aged 0 to 14 | 14.5% | 16.3% | 250 / 343 |
| Aged 15 to 64 | 72.5% | 64.8% | 10 / 343 |
| Aged 65 and over | 13.0% | 19.0% | 316 / 343 |
| Aged 85 and over | 1.4% | 2.3% | 298 / 343 |
| Median age | 35.6 | 41.6 | 318 / 343 |
| Average household size | 3.0 | 2.4 | 27 / 343 |
| Mother tongue English (single response) | 34.6% | 54.9% | 252 / 343 |
| Mother tongue French (single response) | 0.5% | 19.6% | 324 / 343 |
| Mother tongue a non-official language (single response) | 57.0% | 21.4% | 14 / 343 |
| First official language spoken: English | 91.2% | 75.5% | 232 / 343 |
| First official language spoken: French | 0.6% | 21.4% | 314 / 343 |
| Knowledge of official languages: English only | 89.0% | 69.0% | 175 / 343 |
| Knowledge of official languages: French only | 0.1% | 11.2% | 119 / 343 |
| Knowledge of official languages: English and French | 3.2% | 18.0% | 327 / 343 |
| Immigrants | 48.6% | 23.0% | 36 / 343 |
| Non-permanent residents | 10.4% | 2.5% | 5 / 343 |
| Visible minority population | 75.8% | 26.5% | 17 / 343 |
| Indigenous identity | 2.8% | 5.0% | 166 / 343 |
| Median total income of household in 2020 | 84,000 $ | 84,000 $ | 162 / 343 |
| Median after-tax income in 2020 among recipients aged 15+ | 32,400 $ | 36,800 $ | 309 / 343 |
| Prevalence of low income (LIM-AT) | 10.3% | 11.1% | 196 / 343 |
| No certificate, diploma or degree (aged 25-64) | 15.4% | 9.9% | 51 / 343 |
| Bachelor's degree or higher (aged 25-64) | 29.7% | 32.9% | 160 / 343 |
| Owner households | 54.2% | 66.5% | 284 / 343 |
| Labour force participation rate | 67.4% | 63.7% | 74 / 343 |
| Unemployment rate (May 2021 reference week) | 9.5% | 10.3% | 195 / 343 |
MPs for this riding since 2025
| MP | Caucus | In office |
|---|---|---|
| Randeep Sarai | Liberal | 28 Apr 2025 |
How Surrey Centre compares
On our projection the Liberals lead here by 20.9 points, the 192nd closest of 343 ridings. In British Columbia the Liberals lead in 32 of 43 ridings, and in 225 nationwide. The Liberals won it last time too.
Most like it (the Liberals ahead by a similar margin): Coquitlam—Port Coquitlam (20.5), South Surrey—White Rock (21.3), Burnaby Central (20.3), Fleetwood—Port Kells (20.1).
The closest: Brantford—Brant South (Liberal, 0.1), Huron—Bruce (Conservative, 0.1), Shefford (Liberal, 0.3).
Results: Elections Canada. Census: Statistics Canada. Contains information licensed under the Open Government Licence – Canada. MPs: House of Commons member lists; reasons for leaving from Wikipedia. Photos: Wikimedia Commons where one is openly licensed (the photographer is in each photo's tooltip); the House of Commons' official portraits are not used.
Figures as of . Published by Polling Forecast.