
Australia · divisions
Australia: all 150 divisions
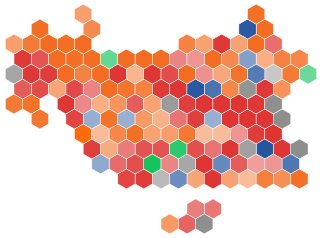
All 150 seats of Australia's House of Representatives, each with our projection and its past results; today One Nation 65 seats, with 76 needed for a majority.
74 divisions change hands on our projection compared with the 2025 result. "Final two" is who we expect to be left when preferences are distributed, with their two-candidate-preferred shares.
| Division | Projection | Final two | Chance | First pref. |
|---|---|---|---|---|
| Bean | Labor | Labor 50.1 v Independent 49.9 | 52% | 35.4% |
| Canberra | Labor | Labor 64.6 v Greens 35.4 | over 99% | 41.0% |
| Fenner | Labor | Labor 67.4 v Coalition 32.6 | over 99% | 46.4% |
| Banks | Coalition (gain) | Coalition 51.0 v Labor 49.0 | 53% | 28.3% |
| Barton | Labor | Labor 57.1 v One Nation 42.9 | 95% | 36.8% |
| Bennelong | Labor | Labor 55.9 v Coalition 44.1 | 96% | 38.4% |
| Berowra | Coalition | Coalition 55.0 v Labor 45.0 | 85% | 30.4% |
| Blaxland | Labor | Labor 58.5 v One Nation 41.5 | 94% | 37.9% |
| Bradfield | Independent | Independent 55.5 v Coalition 44.5 | 91% | 27.7% |
| Calare | One Nation (gain) | One Nation 55.3 v Independent 44.7 | 96% | 31.8% |
| Chifley | Labor | Labor 55.5 v One Nation 44.5 | 96% | 41.7% |
| Cook | Coalition | Coalition 60.5 v Labor 39.5 | 98% | 35.7% |
| Cowper | One Nation (gain) | One Nation 50.0 v Independent 50.0 | 41% | 27.2% |
| Cunningham | Labor | Labor 55.3 v One Nation 44.7 | 92% | 32.4% |
| Dobell | One Nation (gain) | One Nation 54.0 v Labor 46.0 | 88% | 34.2% |
| Eden-Monaro | One Nation (gain) | One Nation 51.3 v Labor 48.7 | 66% | 29.0% |
| Farrer | One Nation (gain) | One Nation 50.8 v Coalition 49.2 | 53% | 28.1% |
| Fowler | Independent | Independent 56.9 v Labor 43.1 | 88% | 28.2% |
| Gilmore | One Nation (gain) | One Nation 51.5 v Labor 48.5 | 50% | 24.4% |
| Grayndler | Labor | Labor 58.3 v Greens 41.7 | 99% | 42.1% |
| Greenway | Labor | Labor 56.6 v One Nation 43.4 | 98% | 41.1% |
| Hughes | One Nation (gain) | One Nation 52.1 v Labor 47.9 | 49% | 24.8% |
| Hume | Coalition | Coalition 50.5 v One Nation 49.5 | 48% | 29.4% |
| Hunter | One Nation (gain) | One Nation 64.4 v Labor 35.6 | over 99% | 50.9% |
| Kingsford Smith | Labor | Labor 56.3 v One Nation 43.7 | 98% | 40.0% |
| Lindsay | One Nation (gain) | One Nation 58.7 v Labor 41.3 | 67% | 28.8% |
| Lyne | One Nation (gain) | One Nation 54.2 v Coalition 45.8 | 95% | 33.8% |
| Macarthur | Labor | Labor 50.5 v One Nation 49.5 | 64% | 35.7% |
| Mackellar | Independent | Independent 57.8 v Coalition 42.2 | 99% | 36.1% |
| Macquarie | One Nation (gain) | One Nation 54.6 v Labor 45.4 | 90% | 34.1% |
| McMahon | One Nation (gain) | One Nation 52.3 v Labor 47.7 | 77% | 34.1% |
| Mitchell | Coalition | Coalition 57.2 v Labor 42.8 | 97% | 33.9% |
| New England | One Nation (gain) | One Nation 50.5 v Coalition 49.5 | 60% | 37.7% |
| Newcastle | Labor | Labor 59.6 v One Nation 40.4 | 97% | 34.5% |
| Page | Coalition | Coalition 55.2 v One Nation 44.8 | 84% | 31.5% |
| Parkes | One Nation (gain) | One Nation 62.1 v Coalition 37.9 | over 99% | 46.9% |
| Parramatta | Labor | Labor 59.2 v Coalition 40.8 | 99% | 40.2% |
| Paterson | One Nation (gain) | One Nation 54.5 v Labor 45.5 | 94% | 31.2% |
| Reid | Labor | Labor 58.7 v Coalition 41.3 | 99% | 41.4% |
| Richmond | Greens (gain) | Greens 55.1 v One Nation 44.9 | 66% | 28.7% |
| Riverina | One Nation (gain) | One Nation 55.5 v Coalition 44.5 | 96% | 38.0% |
| Robertson | One Nation (gain) | One Nation 50.1 v Labor 49.9 | 52% | 28.9% |
| Shortland | One Nation (gain) | One Nation 53.4 v Labor 46.6 | 82% | 34.9% |
| Sydney | Labor | Labor 67.7 v One Nation 32.3 | over 99% | 43.9% |
| Warringah | Independent | Independent 61.4 v Coalition 38.6 | over 99% | 36.6% |
| Watson | Labor | Labor 59.7 v One Nation 40.3 | 99% | 39.7% |
| Wentworth | Independent | Independent 58.3 v Coalition 41.7 | 99% | 33.2% |
| Werriwa | Labor | Labor 52.2 v One Nation 47.8 | 74% | 33.3% |
| Whitlam | One Nation (gain) | One Nation 53.3 v Labor 46.7 | 79% | 31.0% |
| Lingiari | One Nation (gain) | One Nation 54.3 v Labor 45.7 | 90% | 34.2% |
| Solomon | One Nation (gain) | One Nation 55.7 v Labor 44.3 | 57% | 27.6% |
| Blair | One Nation (gain) | One Nation 58.9 v Labor 41.1 | over 99% | 38.2% |
| Bonner | Labor | Labor 51.9 v Coalition 48.1 | 66% | 34.1% |
| Bowman | One Nation (gain) | One Nation 58.1 v Labor 41.9 | 78% | 30.4% |
| Brisbane | Labor | Labor 55.8 v Coalition 44.2 | 56% | 27.4% |
| Capricornia | One Nation (gain) | One Nation 71.3 v Labor 28.7 | over 99% | 52.0% |
| Dawson | One Nation (gain) | One Nation 56.8 v Coalition 43.2 | 98% | 40.6% |
| Dickson | One Nation (gain) | One Nation 53.7 v Labor 46.3 | 51% | 23.7% |
| Fadden | One Nation (gain) | One Nation 51.9 v Coalition 48.1 | 80% | 33.6% |
| Fairfax | One Nation (gain) | One Nation 60.9 v Labor 39.1 | 80% | 31.9% |
| Fisher | Coalition | Coalition 50.3 v One Nation 49.7 | 37% | 25.5% |
| Flynn | One Nation (gain) | One Nation 64.0 v Coalition 36.0 | over 99% | 49.7% |
| Forde | One Nation (gain) | One Nation 61.5 v Labor 38.5 | over 99% | 39.9% |
| Griffith | Labor | Labor 50.1 v Greens 49.9 | 50% | 28.8% |
| Groom | One Nation (gain) | One Nation 55.5 v Coalition 44.5 | 97% | 38.7% |
| Herbert | Coalition | Coalition 55.9 v One Nation 44.1 | 96% | 35.4% |
| Hinkler | One Nation (gain) | One Nation 68.6 v Labor 31.4 | over 99% | 47.2% |
| Kennedy | One Nation (gain) | One Nation 51.2 v Katter's Australian Party 48.8 | 72% | 32.6% |
| Leichhardt | One Nation (gain) | One Nation 56.8 v Labor 43.2 | 98% | 33.5% |
| Lilley | Labor | Labor 56.2 v One Nation 43.8 | 97% | 39.0% |
| Longman | One Nation (gain) | One Nation 61.5 v Labor 38.5 | over 99% | 38.8% |
| Maranoa | One Nation (gain) | One Nation 56.6 v Coalition 43.4 | 97% | 45.3% |
| McPherson | One Nation (gain) | One Nation 59.3 v Labor 40.7 | 52% | 24.2% |
| Moncrieff | Coalition | Coalition 53.0 v One Nation 47.0 | 67% | 29.4% |
| Moreton | Labor | Labor 60.9 v One Nation 39.1 | 99% | 36.3% |
| Oxley | Labor | Labor 57.5 v One Nation 42.5 | 99% | 43.6% |
| Petrie | One Nation (gain) | One Nation 55.1 v Labor 44.9 | 79% | 29.1% |
| Rankin | Labor | Labor 53.3 v One Nation 46.7 | 86% | 40.2% |
| Ryan | Greens | Greens 56.1 v Coalition 43.9 | 72% | 30.0% |
| Wide Bay | One Nation (gain) | One Nation 69.0 v Labor 31.0 | over 99% | 44.5% |
| Wright | One Nation (gain) | One Nation 73.4 v Labor 26.6 | over 99% | 53.3% |
| Adelaide | Labor | Labor 58.7 v One Nation 41.3 | 98% | 37.1% |
| Barker | Coalition | Coalition 50.6 v One Nation 49.4 | 57% | 34.2% |
| Boothby | Labor | Labor 55.7 v Coalition 44.3 | 92% | 34.9% |
| Grey | One Nation (gain) | One Nation 58.3 v Coalition 41.7 | over 99% | 40.6% |
| Hindmarsh | Labor | Labor 53.7 v One Nation 46.3 | 88% | 38.2% |
| Kingston | Labor | Labor 54.7 v One Nation 45.3 | 93% | 41.1% |
| Makin | Labor | Labor 50.4 v One Nation 49.6 | 57% | 36.4% |
| Mayo | Centre Alliance | Centre Alliance 56.2 v One Nation 43.8 | 94% | 0.0% |
| Spence | One Nation (gain) | One Nation 53.9 v Labor 46.1 | 91% | 38.4% |
| Sturt | Labor | Labor 51.2 v Coalition 48.8 | 53% | 28.2% |
| Bass | Labor | Labor 50.3 v One Nation 49.7 | 63% | 31.4% |
| Braddon | One Nation (gain) | One Nation 53.1 v Labor 46.9 | 76% | 28.4% |
| Clark | Independent | Independent 69.6 v One Nation 30.4 | over 99% | 38.1% |
| Franklin | Labor | Labor 56.1 v One Nation 43.9 | 79% | 32.2% |
| Lyons | Labor | Labor 50.7 v One Nation 49.3 | 60% | 34.4% |
| Aston | Coalition (gain) | Coalition 50.2 v Labor 49.8 | 49% | 28.4% |
| Ballarat | One Nation (gain) | One Nation 51.3 v Labor 48.7 | 58% | 29.7% |
| Bendigo | One Nation (gain) | One Nation 53.3 v Labor 46.7 | 67% | 23.4% |
| Bruce | One Nation (gain) | One Nation 51.1 v Labor 48.9 | 57% | 31.2% |
| Calwell | Labor | Labor 52.8 v One Nation 47.2 | 82% | 25.0% |
| Casey | Coalition | Coalition 56.5 v Labor 43.5 | 85% | 30.5% |
| Chisholm | Labor | Labor 52.1 v Coalition 47.9 | 74% | 32.5% |
| Cooper | Labor | Labor 61.8 v One Nation 38.2 | 83% | 31.5% |
| Corangamite | Labor | Labor 54.5 v Coalition 45.5 | 88% | 30.3% |
| Corio | One Nation (gain) | One Nation 50.9 v Labor 49.1 | 69% | 35.6% |
| Deakin | Coalition (gain) | Coalition 50.8 v Labor 49.2 | 59% | 29.9% |
| Dunkley | One Nation (gain) | One Nation 52.2 v Labor 47.8 | 70% | 27.7% |
| Flinders | Coalition | Coalition 55.3 v One Nation 44.7 | 76% | 30.9% |
| Fraser | Labor | Labor 61.8 v One Nation 38.2 | 84% | 32.3% |
| Gellibrand | Labor | Labor 57.4 v One Nation 42.6 | 95% | 36.0% |
| Gippsland | One Nation (gain) | One Nation 56.2 v Coalition 43.8 | 96% | 46.5% |
| Goldstein | Independent (gain) | Independent 50.0 v Coalition 50.0 | 57% | 26.4% |
| Gorton | Labor | Labor 50.9 v One Nation 49.1 | 61% | 33.9% |
| Hawke | One Nation (gain) | One Nation 57.3 v Labor 42.7 | 99% | 35.9% |
| Holt | One Nation (gain) | One Nation 52.5 v Labor 47.5 | 73% | 32.8% |
| Hotham | Labor | Labor 57.1 v One Nation 42.9 | 99% | 39.1% |
| Indi | Independent | Independent 53.3 v One Nation 46.7 | 81% | 34.6% |
| Isaacs | Labor | Labor 56.8 v One Nation 43.2 | 99% | 39.7% |
| Jagajaga | Labor | Labor 59.3 v Coalition 40.7 | 98% | 34.3% |
| Kooyong | Independent | Independent 52.0 v Coalition 48.0 | 74% | 29.6% |
| La Trobe | One Nation (gain) | One Nation 58.6 v Labor 41.4 | 70% | 30.0% |
| Lalor | Labor | Labor 50.9 v One Nation 49.1 | 70% | 32.9% |
| Macnamara | Greens (gain) | Greens 57.7 v Coalition 42.3 | 45% | 29.4% |
| Mallee | One Nation (gain) | One Nation 52.6 v Coalition 47.4 | 80% | 39.1% |
| Maribyrnong | Labor | Labor 55.0 v One Nation 45.0 | 83% | 30.6% |
| McEwen | One Nation (gain) | One Nation 52.9 v Labor 47.1 | 75% | 26.9% |
| Melbourne | Greens (gain) | Greens 58.7 v Labor 41.3 | 97% | 43.3% |
| Menzies | Coalition (gain) | Coalition 52.5 v Labor 47.5 | 79% | 32.0% |
| Monash | One Nation (gain) | One Nation 53.8 v Coalition 46.2 | 90% | 32.1% |
| Nicholls | One Nation (gain) | One Nation 54.3 v Coalition 45.7 | 91% | 40.4% |
| Scullin | Labor | Labor 51.4 v One Nation 48.6 | 65% | 35.1% |
| Wannon | Coalition | Coalition 51.3 v Independent 48.7 | 64% | 33.8% |
| Wills | Greens (gain) | Greens 55.0 v Labor 45.0 | 91% | 38.6% |
| Brand | One Nation (gain) | One Nation 56.3 v Labor 43.7 | 94% | 42.7% |
| Bullwinkel | One Nation (gain) | One Nation 59.4 v Labor 40.6 | over 99% | 33.6% |
| Burt | One Nation (gain) | One Nation 52.2 v Labor 47.8 | 70% | 36.2% |
| Canning | One Nation (gain) | One Nation 54.5 v Coalition 45.5 | 93% | 40.5% |
| Cowan | Labor | Labor 55.5 v One Nation 44.5 | 95% | 39.7% |
| Curtin | Independent | Independent 52.0 v Coalition 48.0 | 74% | 27.3% |
| Durack | One Nation (gain) | One Nation 57.0 v Coalition 43.0 | 99% | 38.0% |
| Forrest | One Nation (gain) | One Nation 64.4 v Labor 35.6 | 94% | 34.3% |
| Fremantle | Labor | Labor 53.9 v One Nation 46.1 | 80% | 31.8% |
| Hasluck | Labor | Labor 53.0 v One Nation 47.0 | 82% | 38.7% |
| Moore | One Nation (gain) | One Nation 53.6 v Labor 46.4 | 68% | 22.8% |
| O'Connor | One Nation (gain) | One Nation 57.7 v Coalition 42.3 | 99% | 40.3% |
| Pearce | One Nation (gain) | One Nation 55.1 v Labor 44.9 | 95% | 34.9% |
| Perth | Labor | Labor 58.1 v One Nation 41.9 | 96% | 34.6% |
| Swan | Labor | Labor 54.5 v One Nation 45.5 | 92% | 35.6% |
| Tangney | Labor | Labor 53.2 v Coalition 46.8 | 83% | 36.6% |
Chance: share of 5,000 simulated elections the projected winner takes the division. 2025: the winning party and its two-candidate-preferred share.
Divisions where replaying a past House-election polling miss on today's polls changes the winner.
| Division | Our bet | Miss like 2007 | Miss like 2010 | Miss like 2013 | Miss like 2016 | Miss like 2019 | Miss like 2022 | Miss like 2025 |
|---|---|---|---|---|---|---|---|---|
| Bean ACT | Labor | Independent | Independent | Independent | Independent | Independent | Independent | = |
| Cowper NSW | One Nation | Independent | Coalition | = | = | Independent | Independent | Independent |
| Macnamara VIC | Greens | = | Labor | Labor | Labor | = | = | Labor |
| McPherson QLD | One Nation | = | Coalition | Coalition | = | Coalition | Coalition | = |
| Sturt SA | Labor | = | Coalition | Coalition | = | Coalition | Coalition | = |
| Goldstein VIC | Independent | = | Coalition | Coalition | Coalition | Coalition | = | = |
| Makin SA | Labor | = | One Nation | One Nation | = | One Nation | One Nation | = |
| Lyons TAS | Labor | = | One Nation | One Nation | = | One Nation | One Nation | = |
| Macarthur NSW | Labor | = | One Nation | One Nation | = | One Nation | One Nation | = |
| Hughes NSW | One Nation | = | Coalition | = | = | Coalition | = | Labor |
| Griffith QLD | Labor | Greens | = | = | = | Greens | Greens | = |
| Gilmore NSW | One Nation | = | Coalition | = | = | Coalition | = | Labor |
| Dickson QLD | One Nation | = | Coalition | Labor | = | Labor | = | = |
| Farrer NSW | One Nation | = | Coalition | = | = | Coalition | = | Coalition |
| Brisbane QLD | Labor | Greens | = | = | = | Greens | Greens | = |
| New England NSW | One Nation | = | Coalition | Coalition | = | Coalition | = | = |
| Gorton VIC | Labor | = | One Nation | = | = | One Nation | One Nation | = |
| Lalor VIC | Labor | = | One Nation | = | = | One Nation | One Nation | = |
| Fisher QLD | Coalition | One Nation | = | = | = | = | = | One Nation |
| Hume NSW | Coalition | One Nation | = | = | = | = | = | One Nation |
| Aston VIC | Coalition | Labor | = | = | = | = | = | Labor |
| Solomon NT | One Nation | = | Coalition | = | = | Coalition | = | = |
| Bass TAS | Labor | = | = | One Nation | = | = | One Nation | = |
| Wannon VIC | Coalition | = | = | = | = | = | Independent | Independent |
| Scullin VIC | Labor | = | One Nation | = | = | = | One Nation | = |
| Bonner QLD | Labor | = | Coalition | = | = | Coalition | = | = |
| Richmond NSW | Greens | = | Labor | = | = | = | = | Labor |
| Lindsay NSW | One Nation | = | Coalition | = | = | Coalition | = | = |
| La Trobe VIC | One Nation | = | Coalition | = | = | Coalition | = | = |
| Chisholm VIC | Labor | = | Coalition | = | = | Coalition | = | = |
| Robertson NSW | One Nation | = | = | = | = | = | = | Labor |
| Banks NSW | Coalition | = | = | = | = | = | = | Labor |
| Bruce VIC | One Nation | = | = | = | = | = | = | Labor |
| Ballarat VIC | One Nation | = | = | = | = | = | = | Labor |
| Deakin VIC | Coalition | = | = | = | = | = | = | Labor |
| Eden-Monaro NSW | One Nation | = | = | = | = | = | = | Labor |
| Moncrieff QLD | Coalition | = | = | = | = | = | = | One Nation |
| Bendigo VIC | One Nation | = | = | = | = | Coalition | = | = |
| Moore WA | One Nation | = | = | = | = | Coalition | = | = |
| Corio VIC | One Nation | = | = | = | = | = | = | Labor |
| Burt WA | One Nation | = | = | = | = | = | = | Labor |
| Dunkley VIC | One Nation | = | = | = | = | = | = | Labor |
| Kennedy QLD | One Nation | = | = | = | = | = | = | Katter's Australian Party |
| Holt VIC | One Nation | = | = | = | = | = | = | Labor |
| Kooyong VIC | Independent | = | Coalition | = | = | = | = | = |
| Werriwa NSW | Labor | = | Coalition | = | = | = | = | = |
| Curtin WA | Independent | = | Coalition | = | = | = | = | = |
| Flinders VIC | Coalition | = | = | = | = | = | = | Independent |
| McMahon NSW | One Nation | = | = | = | = | = | = | Labor |
| Bowman QLD | One Nation | = | Coalition | = | = | = | = | = |
| Menzies VIC | Coalition | = | = | = | = | = | = | Labor |
| Fairfax QLD | One Nation | = | = | = | = | Coalition | = | = |
| Fadden QLD | One Nation | = | = | = | = | Coalition | = | = |
| Maribyrnong VIC | Labor | = | One Nation | = | = | = | = | = |
| Tangney WA | Labor | = | Coalition | = | = | = | = | = |
Figures as of . Published by Polling Forecast.
 United Kingdom
 France
 Germany
 Spain
 Italy
 Netherlands
 Poland
 Canada