Avalon
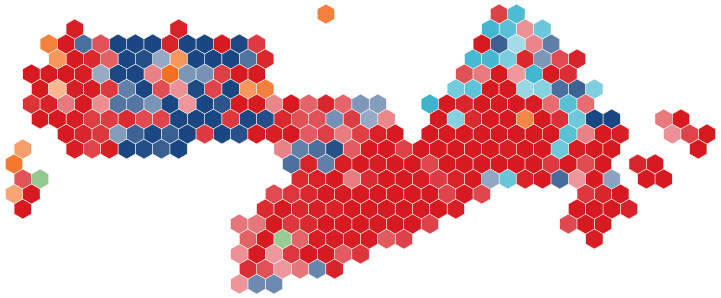
Avalon is one of 343 ridings, in Newfoundland and Labrador. On our projection the Liberals lead here by 31.0 points, as it did last time.
The Liberals win · 99% chance · lead 31.0 points
Chances are counted over our 5,000 simulated elections.
The Liberals won it in 2025. The riding moves with Atlantic Canada: our regional reading has Liberal 57%, Conservative 32%, NDP 7%.
| Party | Projected vote | Win chance | 2025 | 2021* |
|---|---|---|---|---|
| Liberal | 61.1 | 99% | 58.6 | 50.9 |
| Conservative | 30.1 | 1% | 36.0 | 33.0 |
| NDP | 7.3 | 4.9 | 14.3 | |
| Others | 1.5 | 0.5 | – |
* 2021 as transposed by Elections Canada onto the 2023 boundaries (a notional result). Shares of valid votes.
Under each reading of the polls
| Reading | Winner |
|---|---|
| The polls as they stand | Liberal |
| Our projection | Liberal |
| If the polls miss like 2000 | Liberal |
| If the polls miss like 2004 | Liberal |
| If the polls miss like 2006 | Liberal |
| If the polls miss like 2008 | Liberal |
| If the polls miss like 2011 | Liberal |
| If the polls miss like 2015 | Liberal |
| If the polls miss like 2019 | Liberal |
| If the polls miss like 2021 | Liberal |
| If the polls miss like 2025 | Liberal |
The same winner under every past miss.
The 2025 result
Electors on the lists: 70,859 · turnout 66.9% · 2021 (transposed): 52.9%
| Candidate | Party | Votes | % |
|---|---|---|---|
| Paul Connors ✓ | Liberal | 27,563 | 58.6 |
| Steve Kent | Conservative | 16,953 | 36.0 |
| Judy Vanta | NDP | 2,284 | 4.9 |
| Alexander Tilley | Parti Rhinocéros Party | 230 | 0.5 |
Who lives here
2021 census (Statistics Canada) on the 2023 boundaries, against Canada as a whole; rank 1 is the highest of 343.
| Measure | Here | Canada | Rank |
|---|---|---|---|
| Population, 2021 | 81,781 | 36,991,981 | 318 / 343 |
| Population density (per km2 of the area above) | 14/km² | 4/km² | 266 / 343 |
| Aged 0 to 14 | 14.5% | 16.3% | 250 / 343 |
| Aged 15 to 64 | 63.2% | 64.8% | 202 / 343 |
| Aged 65 and over | 22.2% | 19.0% | 81 / 343 |
| Aged 85 and over | 1.5% | 2.3% | 284 / 343 |
| Median age | 47.6 | 41.6 | 41 / 343 |
| Average household size | 2.4 | 2.4 | 158 / 343 |
| Mother tongue English (single response) | 98.9% | 54.9% | 2 / 343 |
| Mother tongue French (single response) | 0.2% | 19.6% | 340 / 343 |
| Mother tongue a non-official language (single response) | 0.6% | 21.4% | 341 / 343 |
| First official language spoken: English | 99.7% | 75.5% | 2 / 343 |
| First official language spoken: French | 0.2% | 21.4% | 340 / 343 |
| Knowledge of official languages: English only | 95.3% | 69.0% | 21 / 343 |
| Knowledge of official languages: French only | 0.0% | 11.2% | 229 / 343 |
| Knowledge of official languages: English and French | 4.6% | 18.0% | 288 / 343 |
| Immigrants | 1.3% | 23.0% | 337 / 343 |
| Non-permanent residents | 0.2% | 2.5% | 330 / 343 |
| Visible minority population | 1.0% | 26.5% | 341 / 343 |
| Indigenous identity | 2.7% | 5.0% | 173 / 343 |
| Median total income of household in 2020 | 79,000 $ | 84,000 $ | 208 / 343 |
| Median after-tax income in 2020 among recipients aged 15+ | 34,800 $ | 36,800 $ | 239 / 343 |
| Prevalence of low income (LIM-AT) | 12.1% | 11.1% | 120 / 343 |
| No certificate, diploma or degree (aged 25-64) | 10.0% | 9.9% | 162 / 343 |
| Bachelor's degree or higher (aged 25-64) | 17.8% | 32.9% | 277 / 343 |
| Owner households | 84.3% | 66.5% | 18 / 343 |
| Labour force participation rate | 57.6% | 63.7% | 295 / 343 |
| Unemployment rate (May 2021 reference week) | 14.3% | 10.3% | 32 / 343 |
MPs for this riding since 2025
| MP | Caucus | In office |
|---|---|---|
| Paul Connors | Liberal | 28 Apr 2025 |
How Avalon compares
On our projection the Liberals lead here by 31.0 points, the 244th closest of 343 ridings. In Newfoundland and Labrador the Liberals lead in 6 of 7 ridings, and in 225 nationwide. The Liberals won it last time too.
Most like it (the Liberals ahead by a similar margin): London West (30.9), Hamilton West—Ancaster—Dundas (30.8), LaSalle—Émard—Verdun (30.7), Etobicoke—Lakeshore (30.7).
The closest: Brantford—Brant South (Liberal, 0.1), Huron—Bruce (Conservative, 0.1), Shefford (Liberal, 0.3).
Results: Elections Canada. Census: Statistics Canada. Contains information licensed under the Open Government Licence – Canada. MPs: House of Commons member lists; reasons for leaving from Wikipedia. Photos: Wikimedia Commons where one is openly licensed (the photographer is in each photo's tooltip); the House of Commons' official portraits are not used.
Figures as of . Published by Polling Forecast.