South Australia: all 10 divisions
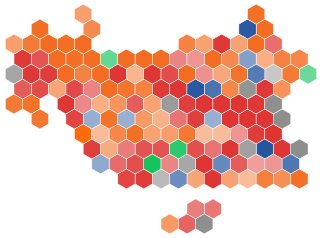
74 divisions change hands on our projection compared with the 2025 result. "Final two" is who we expect to be left when preferences are distributed, with their two-candidate-preferred shares.
| Division | Projection | Final two | Chance | First pref. |
|---|---|---|---|---|
| Adelaide | Labor | Labor 58.7 v One Nation 41.3 | 98% | 37.1% |
| Barker | Coalition | Coalition 50.6 v One Nation 49.4 | 57% | 34.2% |
| Boothby | Labor | Labor 55.7 v Coalition 44.3 | 92% | 34.9% |
| Grey | One Nation (gain) | One Nation 58.3 v Coalition 41.7 | over 99% | 40.6% |
| Hindmarsh | Labor | Labor 53.7 v One Nation 46.3 | 88% | 38.2% |
| Kingston | Labor | Labor 54.7 v One Nation 45.3 | 93% | 41.1% |
| Makin | Labor | Labor 50.4 v One Nation 49.6 | 57% | 36.4% |
| Mayo | Centre Alliance | Centre Alliance 56.2 v One Nation 43.8 | 94% | 0.0% |
| Spence | One Nation (gain) | One Nation 53.9 v Labor 46.1 | 91% | 38.4% |
| Sturt | Labor | Labor 51.2 v Coalition 48.8 | 53% | 28.2% |
Chance: share of 5,000 simulated elections the projected winner takes the division. 2025: the winning party and its two-candidate-preferred share.
Divisions where replaying a past House-election polling miss on today's polls changes the winner.
| Division | Our bet | Miss like 2007 | Miss like 2010 | Miss like 2013 | Miss like 2016 | Miss like 2019 | Miss like 2022 | Miss like 2025 |
|---|---|---|---|---|---|---|---|---|
| Bean ACT | Labor | Independent | Independent | Independent | Independent | Independent | Independent | = |
| Cowper NSW | One Nation | Independent | Coalition | = | = | Independent | Independent | Independent |
| Macnamara VIC | Greens | = | Labor | Labor | Labor | = | = | Labor |
| McPherson QLD | One Nation | = | Coalition | Coalition | = | Coalition | Coalition | = |
| Sturt SA | Labor | = | Coalition | Coalition | = | Coalition | Coalition | = |
| Goldstein VIC | Independent | = | Coalition | Coalition | Coalition | Coalition | = | = |
| Makin SA | Labor | = | One Nation | One Nation | = | One Nation | One Nation | = |
| Lyons TAS | Labor | = | One Nation | One Nation | = | One Nation | One Nation | = |
| Macarthur NSW | Labor | = | One Nation | One Nation | = | One Nation | One Nation | = |
| Hughes NSW | One Nation | = | Coalition | = | = | Coalition | = | Labor |
| Griffith QLD | Labor | Greens | = | = | = | Greens | Greens | = |
| Gilmore NSW | One Nation | = | Coalition | = | = | Coalition | = | Labor |
| Dickson QLD | One Nation | = | Coalition | Labor | = | Labor | = | = |
| Farrer NSW | One Nation | = | Coalition | = | = | Coalition | = | Coalition |
| Brisbane QLD | Labor | Greens | = | = | = | Greens | Greens | = |
| New England NSW | One Nation | = | Coalition | Coalition | = | Coalition | = | = |
| Gorton VIC | Labor | = | One Nation | = | = | One Nation | One Nation | = |
| Lalor VIC | Labor | = | One Nation | = | = | One Nation | One Nation | = |
| Fisher QLD | Coalition | One Nation | = | = | = | = | = | One Nation |
| Hume NSW | Coalition | One Nation | = | = | = | = | = | One Nation |
| Aston VIC | Coalition | Labor | = | = | = | = | = | Labor |
| Solomon NT | One Nation | = | Coalition | = | = | Coalition | = | = |
| Bass TAS | Labor | = | = | One Nation | = | = | One Nation | = |
| Wannon VIC | Coalition | = | = | = | = | = | Independent | Independent |
| Scullin VIC | Labor | = | One Nation | = | = | = | One Nation | = |
| Bonner QLD | Labor | = | Coalition | = | = | Coalition | = | = |
| Richmond NSW | Greens | = | Labor | = | = | = | = | Labor |
| Lindsay NSW | One Nation | = | Coalition | = | = | Coalition | = | = |
| La Trobe VIC | One Nation | = | Coalition | = | = | Coalition | = | = |
| Chisholm VIC | Labor | = | Coalition | = | = | Coalition | = | = |
| Robertson NSW | One Nation | = | = | = | = | = | = | Labor |
| Banks NSW | Coalition | = | = | = | = | = | = | Labor |
| Bruce VIC | One Nation | = | = | = | = | = | = | Labor |
| Ballarat VIC | One Nation | = | = | = | = | = | = | Labor |
| Deakin VIC | Coalition | = | = | = | = | = | = | Labor |
| Eden-Monaro NSW | One Nation | = | = | = | = | = | = | Labor |
| Moncrieff QLD | Coalition | = | = | = | = | = | = | One Nation |
| Bendigo VIC | One Nation | = | = | = | = | Coalition | = | = |
| Moore WA | One Nation | = | = | = | = | Coalition | = | = |
| Corio VIC | One Nation | = | = | = | = | = | = | Labor |
| Burt WA | One Nation | = | = | = | = | = | = | Labor |
| Dunkley VIC | One Nation | = | = | = | = | = | = | Labor |
| Kennedy QLD | One Nation | = | = | = | = | = | = | Katter's Australian Party |
| Holt VIC | One Nation | = | = | = | = | = | = | Labor |
| Kooyong VIC | Independent | = | Coalition | = | = | = | = | = |
| Werriwa NSW | Labor | = | Coalition | = | = | = | = | = |
| Curtin WA | Independent | = | Coalition | = | = | = | = | = |
| Flinders VIC | Coalition | = | = | = | = | = | = | Independent |
| McMahon NSW | One Nation | = | = | = | = | = | = | Labor |
| Bowman QLD | One Nation | = | Coalition | = | = | = | = | = |
| Menzies VIC | Coalition | = | = | = | = | = | = | Labor |
| Fairfax QLD | One Nation | = | = | = | = | Coalition | = | = |
| Fadden QLD | One Nation | = | = | = | = | Coalition | = | = |
| Maribyrnong VIC | Labor | = | One Nation | = | = | = | = | = |
| Tangney WA | Labor | = | Coalition | = | = | = | = | = |
Figures as of . Published by Polling Forecast.