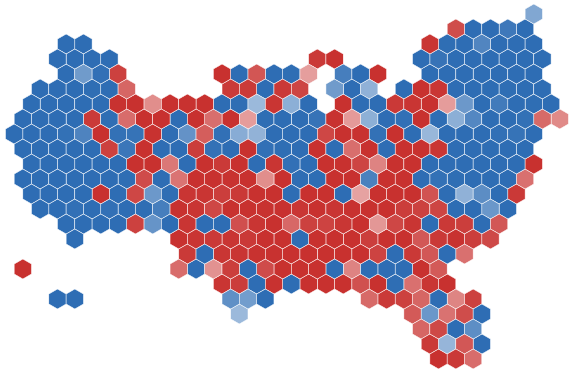
Early projection, based on early and incomplete polling: the likely matchups, each weighted by the betting markets' odds of both nominations, not a result. Each county is its 2024 presidential margin moved by its state's projected swing; set a national vote and every state, district and county moves by the same amount from our projection. Colours run in 100 steps from a safe Republican to a safe Democratic margin. Boundaries: US Census Bureau.
How to use this map
- Each state is coloured by our projected margin: the deeper the red or blue, the safer the state. Click or tap a state to zoom in to its counties and see its numbers.
- The key races: the closest in our forecast. Click one to fly to it.
- Switch between the four 2028 contests: president, Senate, House and governors.
- States or counties: the whole country at either level.
- Choose what the colours mean: our projected margin, or the shift since 2024.
- Results: put any election since 1868, or the 2026 midterms as counted, on the same map, then come back to our forecast.
- Polling misses and the national vote: replay a past polling error on today's numbers, or set the national vote yourself and watch every state follow.
- Sandbox: change any state's or county's votes and see the result change.
- The totals: electoral votes or seats for each party against what is needed to win. Pick a state and this shows that state instead.
What the map says
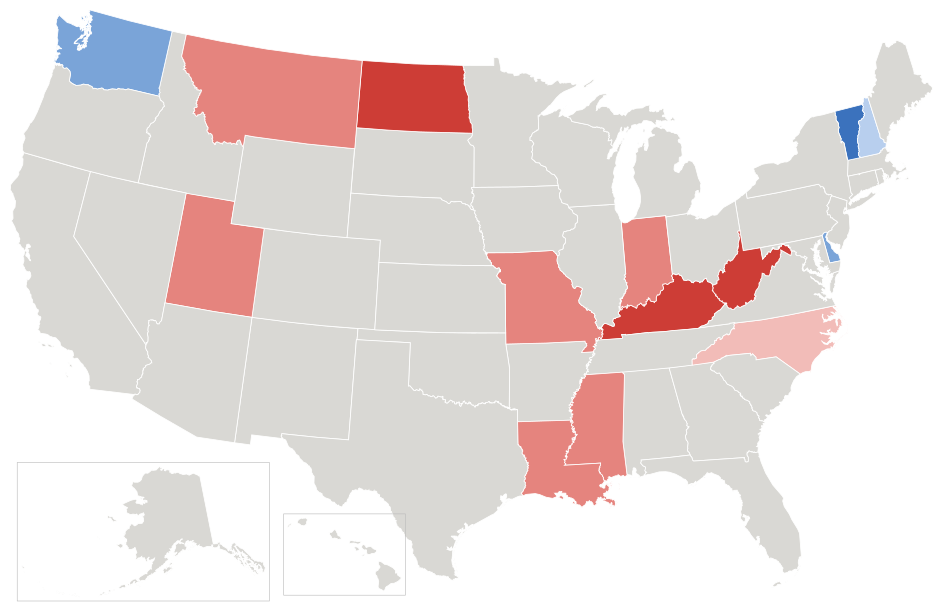
Democrats hold 31 of the 50 governorships on average after the 14 races in 2027 and 2028. On average the Democrats hold 31 of the 50 governorships. The closest governor races: North Carolina (Republican 52%), New Hampshire (Democrat 53%), Delaware (Democrat 66%), Indiana (Republican 67%), Missouri (Republican 67%).
Our forecast as of November 2, 2026. The full forecast, with the odds and the polls →
The closest governor races
- North Carolina Republican 52% · projected R+0.9, 2024 president R+3.2
- New Hampshire Democrat 53% · projected D+1.7, 2024 president D+2.8
- Delaware Democrat 66% · projected D+6.4, 2024 president D+14.7
- Indiana Republican 67% · projected R+7.0, 2024 president R+19.0
- Missouri Republican 67% · projected R+6.7, 2024 president R+18.4
- Montana Republican 68% · projected R+7.3, 2024 president R+19.9
- Washington Democrat 68% · projected D+7.4, 2024 president D+18.2
- Mississippi, 2027 Republican 69% · projected R+8.2, 2024 president R+22.9
Every governor race
| Race | Favorite | Chance | Projected | 2024 president | Held by |
|---|---|---|---|---|---|
| Delaware | Lean Democrat | 66% | D+6.4 | D+14.7 | Democrat |
| Indiana | Lean Republican | 67% | R+7.0 | R+19.0 | Republican |
| Kentucky, 2027 | Lean Republican (gain) | 76% | R+11.3 | R+30.5 | Democrat |
| Louisiana, 2027 | Lean Republican | 70% | R+8.1 | R+22.0 | Republican |
| Mississippi, 2027 | Lean Republican | 69% | R+8.2 | R+22.9 | Republican |
| Missouri | Lean Republican | 67% | R+6.7 | R+18.4 | Republican |
| Montana | Lean Republican | 68% | R+7.3 | R+19.9 | Republican |
| New Hampshire | Toss-up Democrat (gain) | 53% | D+1.7 | D+2.8 | Republican |
| North Carolina | Toss-up Republican (gain) | 52% | R+0.9 | R+3.2 | Democrat |
| North Dakota | Likely Republican | 81% | R+13.8 | R+36.5 | Republican |
| Utah | Lean Republican | 70% | R+8.2 | R+21.6 | Republican |
| Vermont | Lean Democrat (gain) | 78% | D+12.9 | D+31.5 | Republican |
| Washington | Lean Democrat | 68% | D+7.4 | D+18.2 | Democrat |
| West Virginia | Likely Republican | 84% | R+15.9 | R+41.9 | Republican |
How the map is made
Each race's chance and margin come from our 2028 governor forecast: the national mood from the polls, each state's lean, the candidates where they are known, and the uncertainty in all of them, run through thousands of simulated elections. Each county starts from its 2024 presidential margin and moves by its state's projected swing, so you can zoom into any state and see where its votes come from.
The year buttons open every past election we hold: the 2026 midterms as counted, and certified results back to 1868, by state and county (and for the House, by district where we hold that decade's lines). Every past election, year by year · Where the results come from · Results by county · Make your own map · Try a county or state count of your own and see the forecast move
Common questions
- Which governor races are there in 2027 and 2028?
- 14 in all: Delaware, Indiana, Kentucky, 2027, Louisiana, 2027, Mississippi, 2027, Missouri, Montana, New Hampshire, North Carolina, North Dakota, Utah, Vermont, Washington, West Virginia.
- Which governor races are closest?
- The closest in our projection: North Carolina (Republican 52%), New Hampshire (Democrat 53%), Delaware (Democrat 66%), Indiana (Republican 67%), Missouri (Republican 67%), Montana (Republican 68%).
- How often is the map updated?
- Every time a new poll comes in; the projection on this page is as of 2 November 2026. The past years on the map are certified results and do not change.
- Where do the past results come from?
- Certified results from the states' own archives, the MIT Election Data and Science Lab and other published sources, checked state by state; our sources page lists them all.