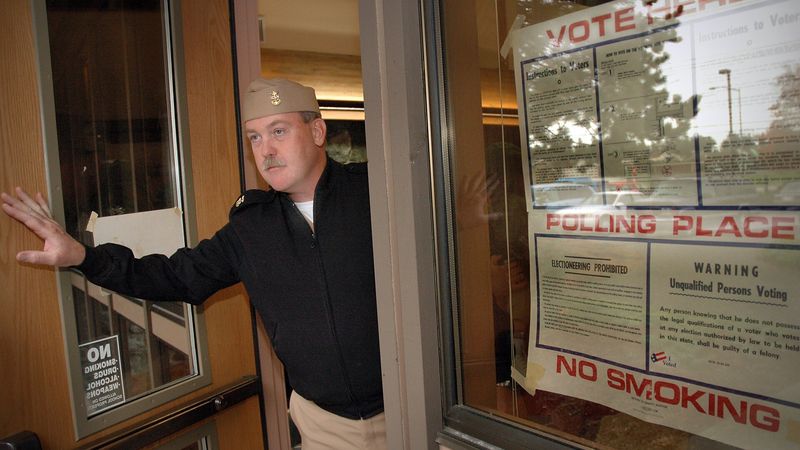
Early vote and turnout
Ballots already cast by mail and at early-voting sites, read from each state's own election office. Where a state publishes dated records we set this year's count against 2022 and 2024 at the same number of days before polling day, and split it by the party voters registered with, where the state records party. 0 days to go.
How far it has missed: in the states we track, reading the 2022 and 2024 early-vote party split as the result missed the final margin by about 15 points on average, and by 7.5 even after correcting for the previous election; our polls three weeks out missed the same races by under 3.
Read our analysis: North Carolina mail ballots trail 2022 pace equally for both parties →
Which way the early vote is pointing
In states that report ballots by party, the party lead among ballots cast so far against the same day in 2024. If the change carried through one for one to the result, the tick is the lead the Democrat would need to draw level with 2024's presidential result. Registration is not a vote, so treat this as a rough guide.
Colorado
We couldn't read the state's latest figures (checked 2 h ago). The state's site refused our request; we don't get round refusals.
| Same day | Change | Final | |
|---|---|---|---|
| 2024 | – | 3,182,959 | |
| 2022 | – | 2,436,473 |
Florida
Figures for 17 November (-14 days out) · source
By mail 2,080,734 · in person 3,467,306 · mail ballots sent 2,460,792
| Same day | Change | Final | |
|---|---|---|---|
| 2024 | not kept | 8,392,165 | |
| 2022 | not kept | 5,059,413 |
The state keeps final counts only for past years, so there is no same-day comparison.
Maine
Figures for 3 November (polling day) · source
mail ballots sent 325,148
| Same day | Change | Final | |
|---|---|---|---|
| 2024 | 378,760 | −18% | 378,760 |
| 2022 | 236,972 | +31% | 236,972 |
Maryland
Figures for 19 November (-16 days out) · source
By mail 509,723 · mail ballots sent 657,388
| Same day | Change | Final | |
|---|---|---|---|
| 2024 | not kept | 765,055 | |
| 2022 | not kept | 541,201 |
The state keeps final counts only for past years, so there is no same-day comparison.
North Carolina
Figures for 3 November (polling day) · source
By mail 108,529 · in person 2,728,826 · mail ballots sent 167,103
| Same day | Change | Final | |
|---|---|---|---|
| 2024 | 4,520,768 | −37% | 4,520,768 |
| 2022 | 2,187,856 | +30% | 2,187,856 |
Pennsylvania
Figures for 3 November (polling day) · source
By mail 1,164,125 · mail ballots sent 1,325,355
| Same day | Change | Final | |
|---|---|---|---|
| 2024 | 1,960,226 | −41% | 1,960,226 |
| 2022 | 1,229,449 | −5.3% | 1,229,449 |
Ballots cast = mail ballots returned and accepted plus in-person early votes, as each state counts them. North Carolina, Pennsylvania and Maine publish one row per ballot with its dates, so 2022 and 2024 are rebuilt day by day from their final files; Colorado's daily spreadsheets start about two weeks out; Florida and Maryland keep only final counts for past years. Pennsylvania has no in-person early voting (its on-demand ballots count as mail). Days out are counted to each year's polling day (8 November 2022, 5 November 2024, 3 November 2026). UF Election Lab figures are not used.
Maryland: ballots cast by county
Figures for 19 November (-16 days out). "Same day" columns show each county at the same number of days before polling day in 2022 and 2024, where the state's past files allow it.
| County | 2026 | 2022 same day | 2024 same day | Dem | Rep | Other |
|---|---|---|---|---|---|---|
| Montgomery | 110,805 | – | – | 73.9% | 8.3% | 17.9% |
| Baltimore County | 73,083 | – | – | 68.6% | 16.4% | 15.1% |
| Prince George's | 69,688 | – | – | 85.4% | 3.9% | 10.7% |
| Anne Arundel | 55,134 | – | – | 59.8% | 19.2% | 21.0% |
| Baltimore City | 39,368 | – | – | 86.9% | 3.7% | 9.3% |
| Howard | 32,346 | – | – | 67.4% | 12.3% | 20.3% |
| Frederick | 25,044 | – | – | 61.8% | 18.5% | 19.7% |
| Harford | 18,093 | – | – | 52.6% | 28.2% | 19.2% |
| Carroll | 13,887 | – | – | 49.0% | 32.2% | 18.8% |
| Charles | 11,927 | – | – | 73.7% | 12.2% | 14.1% |
| Washington | 9,557 | – | – | 53.3% | 28.4% | 18.3% |
| Calvert | 8,335 | – | – | 54.3% | 26.1% | 19.6% |
| Saint Mary's | 7,149 | – | – | 54.2% | 27.3% | 18.5% |
| Cecil | 5,836 | – | – | 45.1% | 36.0% | 18.8% |
| Wicomico | 5,774 | – | – | 57.5% | 26.6% | 16.0% |
| Worcester | 4,599 | – | – | 50.2% | 33.0% | 16.8% |
| Talbot | 3,836 | – | – | 55.6% | 25.4% | 19.0% |
| Queen Anne's | 3,730 | – | – | 50.0% | 31.0% | 19.0% |
| Allegany | 3,705 | – | – | 47.9% | 37.3% | 14.9% |
| Dorchester | 2,097 | – | – | 59.2% | 28.7% | 12.2% |
| Kent | 1,652 | – | – | 61.9% | 22.6% | 15.6% |
| Garrett | 1,602 | – | – | 40.8% | 45.2% | 14.0% |
| Caroline | 1,405 | – | – | 47.5% | 35.2% | 17.3% |
| Somerset | 1,071 | – | – | 51.3% | 33.9% | 14.8% |
We checked every state's election office for early-vote figures (29 September 2026). We read a state only if its figures are an open file that lets a named reader in; a Cloudflare or Incapsula challenge is a refusal, and we never get round one. Full notes, file addresses and terms: research/us/EARLY_VOTE_SOURCES.md.
| State | Status | What the office publishes |
|---|---|---|
| Colorado | Read automatically | Weekday ballot-return spreadsheets by county and party link |
| Florida | Read automatically | Daily county reports by party (vote by mail, early voting) link |
| Maine | Read automatically | Absentee voter file (request, issue and receipt dates) link |
| Maryland | Read automatically | Absentees sent and returned by county and party (once published) link |
| North Carolina | Read automatically | Absentee file, one row per ballot, with dates (daily) link |
| Pennsylvania | Read automatically | Mail-ballot dataset on data.pa.gov (public domain) link |
| Arizona | Official figures, no reader | Counties publish; the Secretary of State's site refused our reader (Cloudflare) |
| California | Official figures, no reader | Vote-by-mail statistics PDF by county link |
| Georgia | Official figures, no reader | Absentee voter files on the My Voter Page; sos.ga.gov refused our reader (Cloudflare) link |
| Iowa | Official figures, no reader | Daily absentee PDF by county and party link |
| Louisiana | Official figures, no reader | Early-voting statistics PDF by parish, party and race link |
| Michigan | Official figures, no reader | Figures in press releases and a dashboard link |
| Minnesota | Official figures, no reader | Statewide totals only link |
| Nevada | Official figures, no reader | Daily turnout by county and party; site blocks automated readers (Incapsula) link |
| Ohio | Official figures, no reader | Absentee and early-voting dashboard link |
| Oregon | Official figures, no reader | Daily ballot returns PDF link |
| South Carolina | Official figures, no reader | Totals in news releases link |
| Texas | Official figures, no reader | Daily early-voting turnout by county; Cloudflare challenge link |
| Washington | Official figures, no reader | Ballot return statistics (the status reports refused our reader) link |
| Wisconsin | Official figures, no reader | Absentee ballot reports; Cloudflare link |
| Alabama | Nothing statewide found | |
| Alaska | Nothing statewide found | |
| Arkansas | Nothing statewide found | |
| Connecticut | Nothing statewide found | |
| Delaware | Nothing statewide found | |
| District of Columbia | Nothing statewide found | |
| Hawaii | Nothing statewide found | |
| Idaho | Nothing statewide found | |
| Illinois | Nothing statewide found | |
| Indiana | Nothing statewide found | |
| Kansas | Nothing statewide found | |
| Kentucky | Nothing statewide found | |
| Massachusetts | Nothing statewide found | |
| Mississippi | Nothing statewide found | |
| Missouri | Nothing statewide found | |
| Montana | Nothing statewide found | |
| Nebraska | Nothing statewide found | |
| New Hampshire | Nothing statewide found | |
| New Jersey | Nothing statewide found | |
| New Mexico | Nothing statewide found | |
| New York | Nothing statewide found | |
| North Dakota | Nothing statewide found | |
| Oklahoma | Nothing statewide found | |
| Rhode Island | Nothing statewide found | |
| South Dakota | Nothing statewide found | |
| Tennessee | Nothing statewide found | |
| Utah | Nothing statewide found | |
| Vermont | Nothing statewide found | |
| Virginia | Nothing statewide found | |
| West Virginia | Nothing statewide found | |
| Wyoming | Nothing statewide found |
Refresh schedule: North Carolina and Florida every 3 hours, Pennsylvania and Colorado every 6, Maryland every 12, Maine once a day; never more than once an hour for any state. Large files are only downloaded when the state says they have changed.
Figures as of . Published by Polling Forecast.