
Labour's 7-point mid-term deficit is normal for Britain, not elsewhere
British governments sink about 8 points below their last result by mid-term, more than three times the drop elsewhere, then win much of it back.
 Polling Forecast
6 min read
Written in house from our poll data and our forecast.
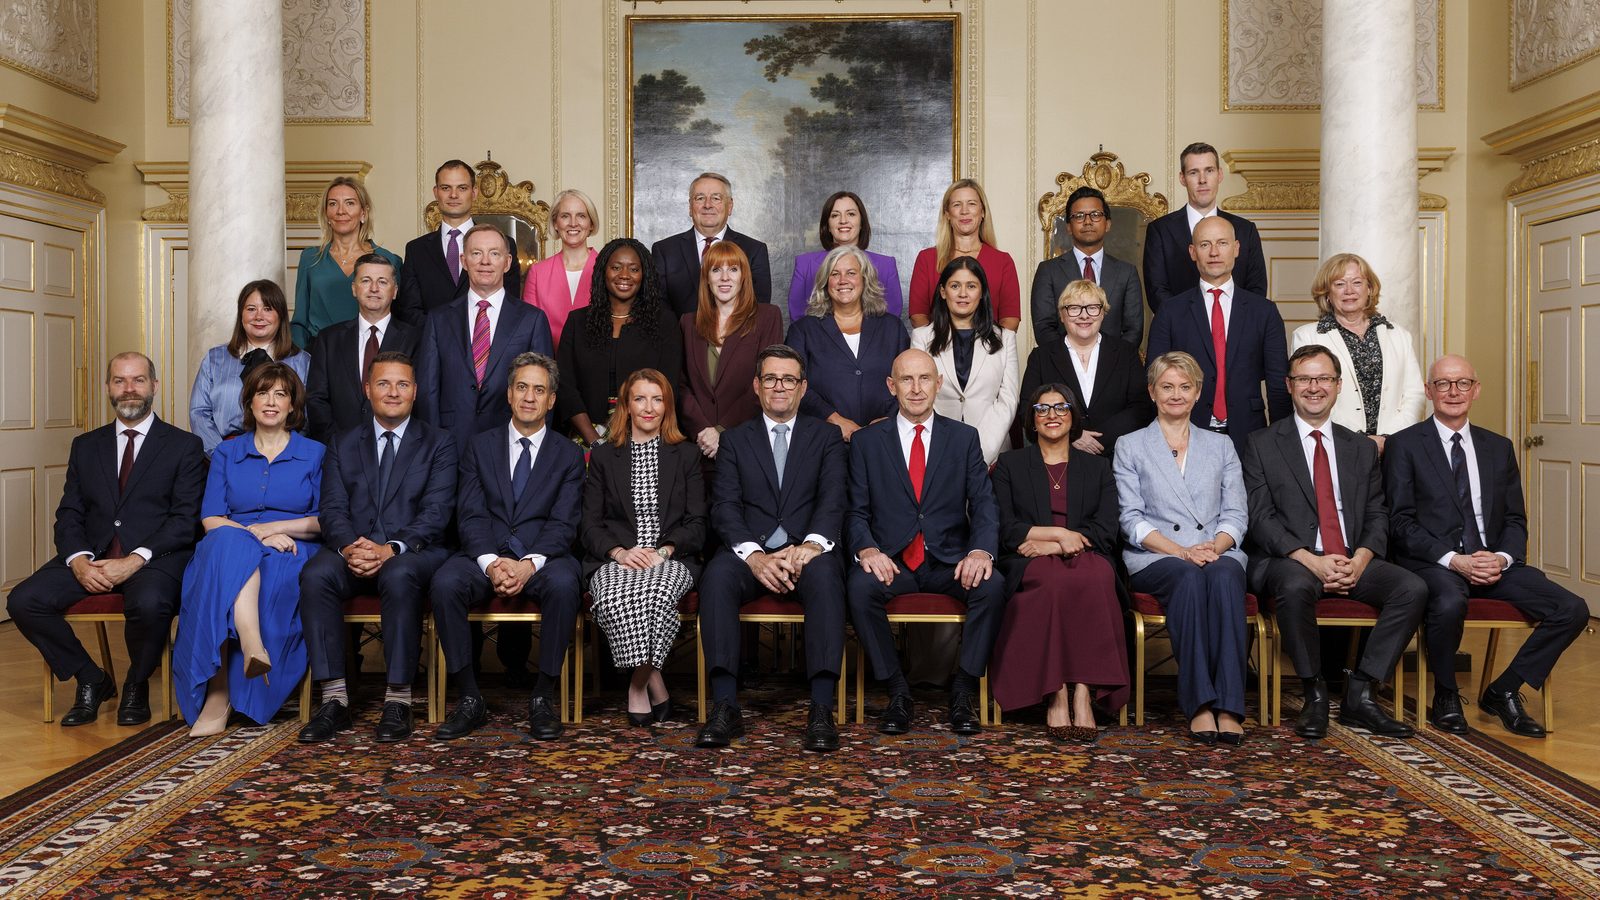

Andy Burnham's Labour stands at 27.3% in our poll average, with polls to 12 October, 7.4 points below the 34.7% it won in Great Britain in July 2024. Set against other democracies, that is a heavy loss for a government barely past the halfway point of a parliament. Set against Britain's own record, it is close to the norm. Across 15 parliaments since 1951, governing parties were on average 7.7 points below their previous result 27 months after an election, which is where Labour is now.
Britain is the outlier. Two years before polling day, British governing parties have averaged 8.0 points below their last result, across 16 elections from 1959 to 2024. Across 28 elections in Australia, Canada, Germany, the Netherlands and Poland, the figure was 2.2 points. Measure it instead two years after the previous election and the gap barely moves: 7.4 points in Britain, 2.6 elsewhere.
What we counted
The figures come from the history tables behind our comeback calculator. For Britain we use PollBase's archive of national polls back to the 1940s; for the other countries, the poll averages we hold at fixed points before each election. For every election we took the party that led the outgoing government and compared its poll average at each point with the share it won last time. Each average covers the polls within a month or so either side of the date in question. For the measures taken a set time after an election, parliaments too short to reach that point drop out.
The 2.2-point figure for other countries is close to what academic work has found. Peter Nannestad and Martin Paldam of Aarhus University estimated that the average government in an established democracy loses about 2.25% of the vote over a normal term. Britain's governments fall about that far by polling day, too. They simply take a deeper detour to get there.
That is the part that has had little attention. By election day, British governing parties in our data had lost 3.7 points on their previous result, against 3.0 elsewhere. From the two-year mark they recovered 4.3 points on average. Governments in the other five countries did not: they slipped a further 0.8 points. Britain's mid-term trough is deep, but it is a mid-term effect, and the polls of that period have been a poor guide to the vote.
How Labour got here
Labour's fall was far steeper than usual. Its simple monthly average in our database bottomed out at 18.2% in December 2025. Eighteen months after the 2024 election it was on 19.0%, 15.7 points below its result, level with the deepest fall at that stage in our British data: the Major government's 15.8 points before 1997. At the two-year mark, in July 2026, it was 12.7 points down, the third-largest deficit at that point after Harold Wilson's government before 1970 (17.4) and Major's (16.3).
Keir Starmer announced his resignation in June, and Burnham became prime minister on 20 July after being elected Labour leader unopposed on 17 July, according to the Wikipedia record of the contest. Labour has gained 6.6 points in our average since July, and now leads Reform UK by 4.2 points. Opinium's poll for the Observer after Burnham's conference speech put Labour on 30%, a level the party had not reached in almost two years, the London Economic reported. Tim Bale of Queen Mary University of London told Al Jazeera that very little of the recovery had come from Reform voters and that the bounce was not necessarily long-lasting.
In three months, then, Labour has gone from one of the worst positions any British government has held at this stage to an ordinary one.
What history says about leads
Labour is now the government and the poll leader, a rarer combination. Across 58 elections outside the United States, the party leading the polls a year before polling day went on to win the most votes 38 times, or 66%. Thirty days out the rate rose to 77%. Britain's record was better than most: 13 of 17 one-year leaders came first. Germany's was 4 of 5, Poland's 3 of 4, Australia's 4 of 6, Spain's and France's 3 of 5, Canada's 5 of 9. In the Netherlands, only one of the 4 one-year leaders in our data came first.
Labour is not a year out. The next election is due by 15 August 2029, nearly three years away. At the point Labour has now reached, 27 months into a parliament, the British poll leader went on to top the vote only 7 times in 15. Governments trailing at that stage won 7 of 12 times. Harold Macmillan's Conservatives were 11 points behind Labour in the second half of 1957 and won comfortably in 1959. Margaret Thatcher's government trailed Labour by 8.5 points in the autumn of 1981 and won in 1983. The Conservatives were 8 points behind in 1989, still under Thatcher, and won again in 1992 under John Major.
Only three governments led at this point. Two held on: Labour in 2001 and in 2005. The third, Labour in 2010, led during Gordon Brown's first months in 2007 and lost. The 2005 cycle is the closest match to today. In the autumn of 2003 Tony Blair's Labour was 6.9 points below its 2001 share but still 1.7 points ahead of the Conservatives. It won in 2005 with 36.1%.
From this stage, British governments regained 3.2 points on average by polling day. The record splits by party. The ten Conservative governments in our set gained 5.2 points on average from here; the five Labour ones lost 0.8. Labour governments that were riding high at this point, in 2001 and 2010, fell back sharply. The Swingometer newsletter on Substack found the same split in post-war mid-term lows, with Conservative governments recovering 9.8 points on average and Labour ones 4.3.
The counter-evidence
The rest of the world may be becoming more British. Friedrich Merz's CDU/CSU stands at 19.8% in our German average, 8.7 points below its 28.5% in February 2025, after only 20 months. In our German data, which begins with the 2009 election, no governing party was more than 5.3 points down two years before polling day. Anthony Albanese's Labor is on 27.7% in our Australian average, 6.9 points below its 34.6% primary vote of May 2025. Pedro Sánchez's PSOE is 5.3 points down in Spain.
The British history also has limits. Polls in the 1950s and 1960s were few, sometimes only three or four in a window. Methods have changed, and the final polls of 1992 missed badly. The Conservatives' 2024 result, 20.3 points below 2019, shows that a deep mid-term deficit can turn into a deeper defeat. The one-year count includes 1978, when the two main parties were level in our average and we credit the Conservatives as leaders. The comparison countries contribute fewer elections each, and the Dutch and Polish series are short.
What it means now
Our projection makes Labour the largest party on 313 seats, 13 short of a majority, with a hung parliament in 64% of our simulations. That rests on today's polls. History cannot say where Labour will be in 2029, but it does say how to read today's figure. A British government 7 points below its last result at this stage is in the usual place. It is the speed of the change since July that is unusual: a party that had been close to the record low for a British government has, in three months, climbed back to the middle of the historical range.
Polling Forecast reads every poll in ten countries, corrects for how pollsters have missed before, and turns them into seats. Our forecasts, the polls and our methods are free to explore.
Elsewhere on Polling Forecast
 When the polls agree too much: herding, and how our forecast guards against it
Polls of a close race should scatter by chance. In 2024 they barely did. Here is why that matters, and the four things our model does so a pack of look-alike polls cannot make it overconfident.
 Polls understated PiS in 31 of 32 final surveys since 2024
At four national votes since Tusk took office, final polls put PiS or its candidate too low. Our forecast makes no allowance for it.
 Private polls understated Spain's PSOE at six of eight elections
104 of 142 private final polls since 2004 had the PSOE too low, but even a repeat of 2023 would probably leave the PP and Vox a majority.