Maryland election results by county
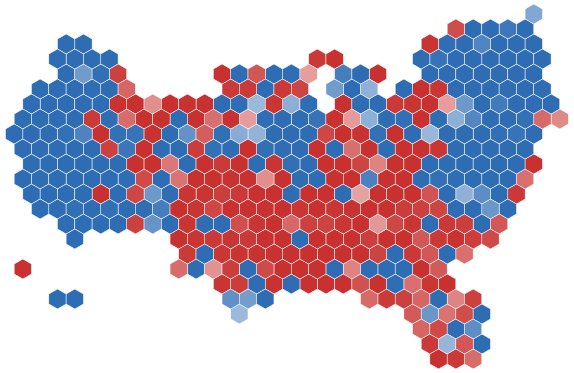
The presidential vote in each of Maryland's 24 counties from 2000 to 2024, and the Senate and governor's races of 2022 and 2024. Pick an earlier election of the same office to see the swing between the two. Hover a county for its numbers; click it, or pick it from the list below, for all its results.
Results: MIT Election Data and Science Lab (president 2000-2016 by county; president 2024, Senate and governor 2022 and 2024 summed from its precinct returns; CC0); president 2020 summed from VEST precinct results (CC BY 4.0). A state is left out of an election when its county figures don't add up to the official state result (within 5% of the votes and 1.5 points of margin): some precinct files miss counties. Alaska reports by election district, so it is shown as one unit. Connecticut's 2020 presidential result is by planning region (the units that replaced its counties), the others by county, so no swing is drawn there across 2020. Boundaries: US Census Bureau, simplified.
Every county in Maryland
The presidential result in 2024 and 2020, and the swing between them. Each county's page has every result back to the 1800s.
| County | 2024 | 2020 | Swing | Votes, 2024 |
|---|---|---|---|---|
| Allegany County | R+40.2 | R+38.3 | R+1.9 | 32,137 |
| Anne Arundel County | D+13.8 | D+14.5 | R+0.7 | 311,572 |
| Baltimore County | D+24.3 | D+27.0 | R+2.7 | 412,915 |
| Baltimore City | D+72.4 | D+76.6 | R+4.2 | 230,754 |
| Calvert County | R+10.9 | R+5.6 | R+5.3 | 54,191 |
| Caroline County | R+37.9 | R+32.8 | R+5.1 | 16,330 |
| Carroll County | R+24.7 | R+23.7 | R+1.1 | 102,651 |
| Cecil County | R+30.7 | R+26.6 | R+4.1 | 52,831 |
| Charles County | D+40.5 | D+40.9 | R+0.4 | 92,097 |
| Dorchester County | R+14.5 | R+11.9 | R+2.6 | 16,772 |
| Frederick County | D+8.7 | D+9.6 | R+0.9 | 156,114 |
| Garrett County | R+53.8 | R+55.9 | D+2.0 | 15,838 |
| Harford County | R+13.7 | R+12.0 | R+1.7 | 150,090 |
| Howard County | D+41.3 | D+44.3 | R+2.9 | 182,291 |
| Kent County | R+2.8 | D+1.2 | R+4.0 | 11,128 |
| Montgomery County | D+52.8 | D+59.6 | R+6.9 | 519,221 |
| Prince George's County | D+74.8 | D+80.5 | R+5.8 | 404,009 |
| Queen Anne's County | R+27.6 | R+26.5 | R+1.1 | 32,347 |
| Somerset County | R+17.3 | R+14.8 | R+2.5 | 10,137 |
| St. Mary's County | R+17.0 | R+13.8 | R+3.2 | 58,954 |
| Talbot County | Even | D+0.5 | R+0.5 | 22,830 |
| Washington County | R+22.9 | R+20.9 | R+2.0 | 73,332 |
| Wicomico County | R+5.4 | R+1.9 | R+3.5 | 46,912 |
| Worcester County | R+21.9 | R+19.0 | R+2.9 | 32,881 |
Figures as of . Published by Polling Forecast.