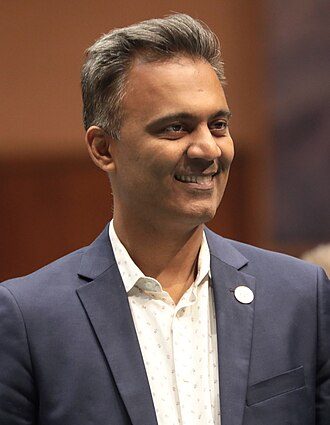
Amish Shah
Feely's chances fade to 14% as Shah extends the lead
Democratic nominee for the House, Arizona's 1st district (AZ-01). Chance of winning in our forecast: 86%.Vote share: 52.6% of the vote · polls 51.6%.
| Race | Arizona's 1st district |
|---|---|
| Our forecast | 86% to win · projection D+5.9 · 52.6% of the vote |
| Status | Open seat: David Schweikert (R) is retiring |
| FEC candidate | H4AZ01194 · campaign committee C00836502 |
Photo: Gage Skidmore, CC BY-SA 3.0, via Wikimedia Commons (https://commons.wikimedia.org/wiki/File:Amish_Shah_by_Gage_Skidmore_2.jpg)
Money
| From individuals | $1,194,233 |
|---|---|
| From PACs and other committees | $146,250 |
| From party committees | $0 |
| From the candidate | $4,885; loans $425,770 |
| Debts | $210,070 |
| Latest report | through 1 July 2026 |
The campaign's own committees, 2025-26. Every filing at the FEC
Outside spending
For: $325k · against: $5.4m (primaries: $3.0m)
| Spender | Amount | Latest | |
|---|---|---|---|
| CLF Hybrid PAC | against | $2.1m | 25 Sep |
| BOLD AMERICA Super PAC | against, primary | $1.7m | 17 Jul |
| PRO-CHOICE MAJORITY ACTION Hybrid PAC | against, primary | $695k | 14 Jul |
| THANK YOU FOR YOUR ATTENTION TO THIS MATTER PAC Super PAC | against | $363k | 15 Sep |
| CRUSH MAGA PAC Hybrid PAC | against, primary | $275k | 7 Jul |
| FIGHT TO WIN Super PAC | against, primary | $134k | 17 Jul |
| PHYSICIAN VOICES UNITED Super PAC | for, primary | $127k | 13 Jul |
| PROGRESSIVE TURNOUT PROJECT Hybrid PAC | for | $127k | 26 Sep |
| NO GOING BACK PAC INC. Super PAC | against | $84k | 24 Sep |
| WORKER POWER PAC Super PAC | for | $21k | 27 Aug |
| DEMOCRATIC MESSAGING PROJECT Super PAC | for | $20k | 21 Sep |
| HEALTHCARE FOR ACTION PAC Hybrid PAC | for, primary | $18k | 7 Jul |
The largest 12 of 13 spenders. All of them at the FEC
Data: FEC bulk data, 2026 cycle (candidate summaries) (as of 28 September 2026); FEC independent expenditures (as of 28 September 2026). Grade A: official data from the body that holds it. All sources
Also in this race
- Jay Feely (R) · raised $2.5m
Past results in this district
| Year | Winner | Runner-up |
|---|---|---|
| 2024 | David Schweikert (R) 51.9 | Amish Shah (D) 48.1 |
| 2022 | Schweikert, David (R) 50.4 | Hodge, Jevin (D) 49.6 |
| 2020 | O'Halleran, Tom (D) 51.6 | Shedd, Tiffany (R) 48.4 |
| 2018 | O'Halleran, Tom (D) 53.8 | Rogers, Wendy (R) 46.1 |
| 2016 | O'Halleran, Tom (D) 50.7 | Babeu, Paul (R) 43.4 |
| 2014 | Kirkpatrick, Ann (D) 52.6 | Tobin, Andy (R) 47.4 |
| 2012 | Kirkpatrick, Ann (D) 48.8 | Paton, Jonathan (R) 45.2 |
| 2010 | Paul (R) 49.7 | Ann (D) 43.7 |
| 2008 | Kirkpatrick, Ann (D) 55.9 | Hay, Sydney (R) 39.4 |
| 2006 | Renzi, Rick (R) 51.8 | Simon, Ellen (D) 43.4 |
| 2004 | Renzi, Rick (R) 58.5 | Babbitt, Paul (D) 36.2 |
| 2002 | Renzi, Rick (R) 49.2 | Cordova, George (D) 45.6 |
The district with this number on the lines of each year. Highlighted: a candidate with the same surname. Sources: FEC and the Clerk of the House (House), MIT Election Data and Science Lab (Senate), J. Cha (governors).
Figures as of . Published by Polling Forecast.