Kamala Harris would beat JD Vance 52–48: 2028 election prediction
Kamala Harris against JD Vance, 736 days before the 2028 election: Kamala Harris wins 68% of our simulated elections, with 292 electoral votes on average against 246 and 51.6% of the two-party vote. Below: the state-by-state map, every head-to-head poll of the pair, and what each candidate adds or costs against a generic nominee.
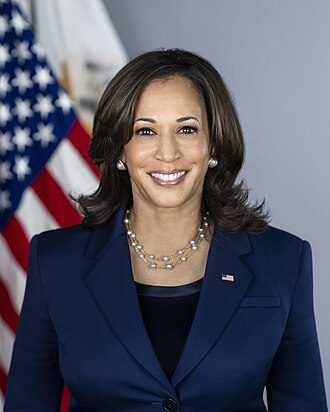 DemocratKamala Harris
68%51.6% of the vote
31%48.4% of the vote
RepublicanJD Vancewith Tulsi Gabbard

736 days out, so this is a sketch, not a call: few head-to-head polls exist and most candidates are barely tested. Why so uncertain?
* The 22nd Amendment bars anyone elected president twice from being elected again. Included only because pollsters ask about him; this is not a view that he can run.
The Electoral College, state by state
One hexagon per electoral vote; the legend counts electoral votes. Maine and Nebraska also give one vote to the winner of each congressional district: the marked hexes.
Your extras
Our estimate 67% → with your extras 68% for Kamala Harris; national vote 51.6–48.4 → 51.6–48.4 (D+3.2 → D+3.2)
Running mates history
- Hawaii Tulsi Gabbard +6.6 to the ticket; Democratic chance there over 99% → over 99%
Since 1948 a running mate's home state has moved towards their ticket by more in a small state than a big one (Delaware and Alaska 6 to 8 points; New York, Texas and California nothing measurable), and by more when the running mate had already won statewide there (30 nominees); nothing measurable elsewhere. Where a running mate would matter most in this pairing
Why this is only a sketch
Few head-to-head polls exist yet, most possible candidates have barely been tested, and the election is more than two years away. The model is tested on all seven elections from 2000 to 2024, each forecast again without its own result: two years out it called about nine states in ten and beat both repeating the last result and the raw polls. What nobody can know this early is much more than which way a close race leans, so the ranges are wide. How the model works.
Electoral votes across the simulations
Share of 10,000 simulations in each band of five electoral votes; blue: the Democrat reaches 270.
The states that decide it
| State | EV | Decides it in | Margin | Vote D–R | Chance D |
|---|---|---|---|---|---|
| Pennsylvania | 19 | 17% | D+2.9 | 51.5–48.5 | 67% |
| Georgia | 16 | 13% | D+2.5 | 51.2–48.8 | 65% |
| North Carolina | 16 | 12% | D+1.4 | 50.7–49.3 | 59% |
| Michigan | 15 | 12% | D+3.2 | 51.6–48.4 | 68% |
| Wisconsin | 10 | 8% | D+3.7 | 51.9–48.1 | 70% |
| Arizona | 11 | 7% | R+0.9 | 49.5–50.5 | 45% |
| Nevada | 6 | 4% | R+0.5 | 49.7–50.3 | 47% |
| Minnesota | 10 | 4% | D+9.0 | 54.5–45.5 | 89% |
Who runs strongest
Each candidate against the party's average candidate, in points of the national margin by November 2028: the dot is our estimate, the line its 80% range. Right is better for that candidate's party. Click a name for the evidence.
Democrats
-
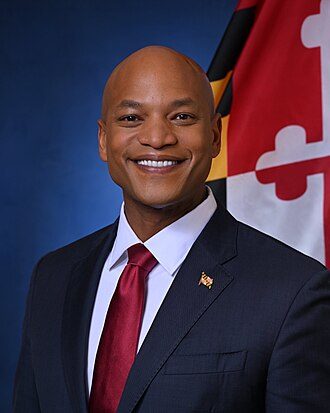 Wes Moore
+1.6
-
 JB Pritzker
+1.4
-
 Amy Klobuchar
+1.3
-
 Josh Shapiro
+1.1
-
 Roy Cooper
+1.0
-
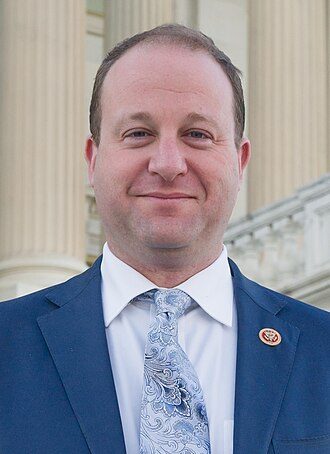 Jared Polis
+0.9
-
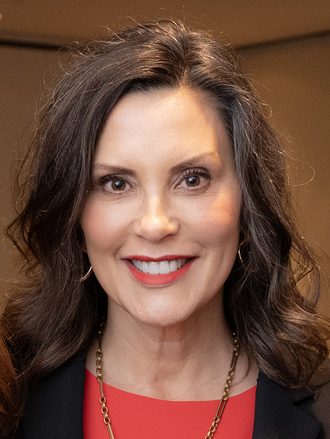 Gretchen Whitmer
+0.8
-
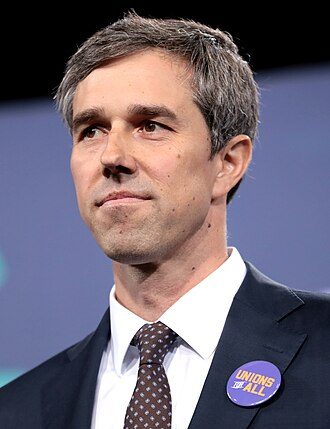 Beto O'Rourke
+0.8
-
 Mark Kelly
+0.6
-
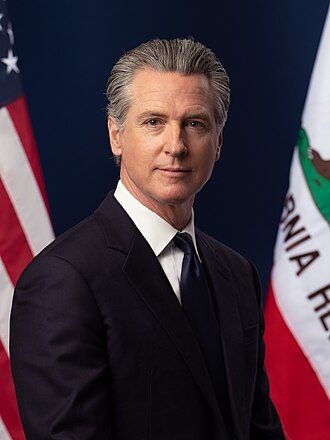 Gavin Newsom
+0.5
Republicans
-
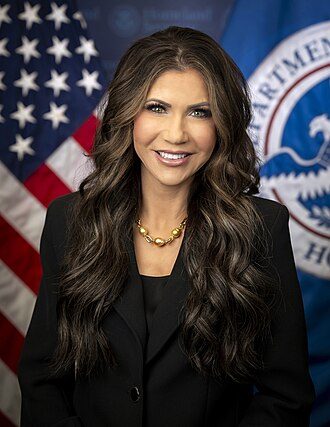 Kristi Noem
+1.0
-
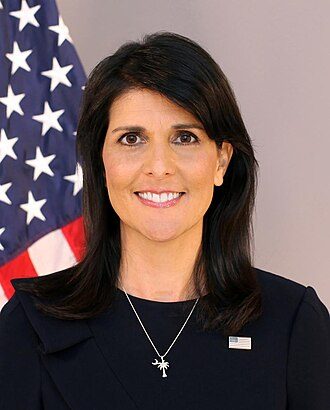 Nikki Haley
+0.6
-
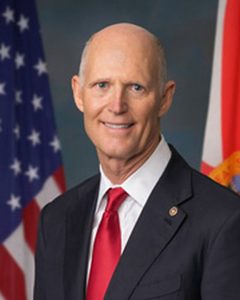 Rick Scott
+0.5
-
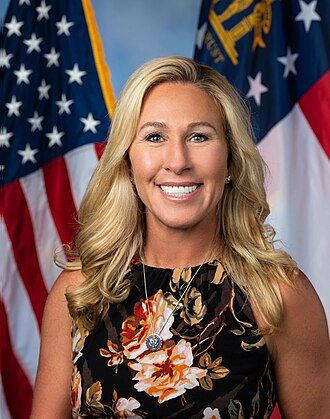 Marjorie Taylor Greene
+0.4
-
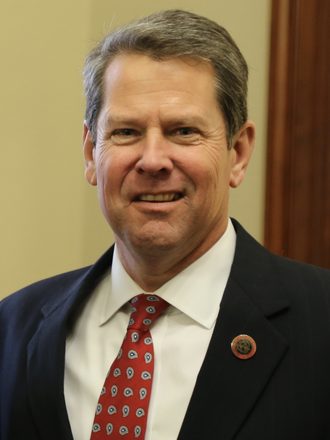 Brian Kemp
+0.4
-
 Rand Paul
+0.4
-
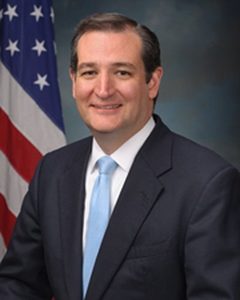 Ted Cruz
+0.3
-
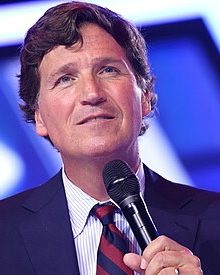 Tucker Carlson
+0.3
-
JD Vance
+0.1
-
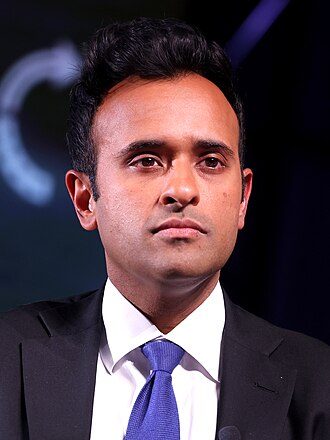 Vivek Ramaswamy
+0.1
The groups in Kamala Harris v JD Vance
Net appeal: the Democrat's appeal minus the Republican's in each group, in points of that group's two-party margin (+ toward the Democrat). Group shares and 2024 votes: the Cooperative Election Study, calibrated to the official results. Who is in each group.
Adds up to D+0.12 on the national margin (D+3.2 in all, against D+3.0 for the generic contest).
Which groups decide the swing states
For the states most likely to tip the Electoral College in this pairing: each group's share of the state's voters, its Democratic share of the two-party vote on today's generic baseline, the pair's net appeal, and how far that group's margin would have to move on its own to flip the state. The group marked ▶ needs the smallest move against its uncertainty: it decides.
Voters the group's share of the state's votersD share its Democratic share of the two-party voteAppeal this pair's net pull with the group, + to the Democrat, − to the RepublicanTo flip how far the group's margin must move to tie the state, toward the Democrat or the Republican; the smaller, the more it decides
| Group | Voters | D share | Appeal | To flip |
|---|---|---|---|---|
| Trump-aligned Republicans | 32% | 1% | 0.0 | 9 to R |
| Other Republicans | 13% | 11% | -0.8 | 23 to R |
| ▶ Independentsdecides it | 8% | 54% | +0.3 | 36 to R |
| Moderate Democrats | 27% | 97% | +0.5 | 11 to R |
| Progressive Democrats | 20% | 97% | +0.3 | 15 to R |
| Group | Voters | D share | Appeal | To flip |
|---|---|---|---|---|
| Trump-aligned Republicans | 33% | 0% | 0.0 | 8 to R |
| Other Republicans | 11% | 8% | -0.8 | 22 to R |
| ▶ Independentsdecides it | 11% | 52% | +0.3 | 23 to R |
| Moderate Democrats | 31% | 99% | +0.5 | 8 to R |
| Progressive Democrats | 14% | 99% | +0.3 | 17 to R |
| Group | Voters | D share | Appeal | To flip |
|---|---|---|---|---|
| Trump-aligned Republicans | 33% | 1% | 0.0 | 4 to R |
| Other Republicans | 12% | 9% | -0.8 | 12 to R |
| ▶ Independentsdecides it | 11% | 59% | +0.3 | 13 to R |
| Moderate Democrats | 28% | 99% | +0.5 | 5 to R |
| Progressive Democrats | 16% | 99% | +0.3 | 9 to R |
| Group | Voters | D share | Appeal | To flip |
|---|---|---|---|---|
| Trump-aligned Republicans | 31% | 1% | 0.0 | 10 to R |
| Other Republicans | 15% | 13% | -0.8 | 22 to R |
| ▶ Independentsdecides it | 11% | 58% | +0.3 | 29 to R |
| Moderate Democrats | 22% | 99% | +0.5 | 14 to R |
| Progressive Democrats | 21% | 99% | +0.3 | 15 to R |
| Group | Voters | D share | Appeal | To flip |
|---|---|---|---|---|
| Trump-aligned Republicans | 31% | 1% | 0.0 | 12 to R |
| Other Republicans | 16% | 17% | -0.8 | 24 to R |
| ▶ Independentsdecides it | 10% | 60% | +0.3 | 39 to R |
| Moderate Democrats | 21% | 99% | +0.5 | 18 to R |
| Progressive Democrats | 22% | 99% | +0.3 | 17 to R |
| Group | Voters | D share | Appeal | To flip |
|---|---|---|---|---|
| Trump-aligned Republicans | 33% | 1% | 0.0 | 3 to D |
| Other Republicans | 14% | 14% | -0.8 | 7 to D |
| ▶ Independentsdecides it | 11% | 48% | +0.3 | 8 to D |
| Moderate Democrats | 23% | 99% | +0.5 | 4 to D |
| Progressive Democrats | 19% | 99% | +0.3 | 5 to D |
Your scenario: a candidate's appeal by group
Drag a candidate's appeal with any group. This is your scenario, shown next to our estimate; it never replaces the forecast.
Approval predictor
What history alone says. Trump's approval is 36.8% today (33% on Gallup's scale, which the past elections were measured on). Choose who runs for the Republicans and how far his approval moves by election day. This is not our forecast: no polls of the pairing and no candidate effects, just the president's approval and 5 past elections.
| Approval on election day | 36.8% (33% on Gallup's scale) |
|---|---|
| Republican share of the two-party vote | 49.6% (80%: 42.7% to 56.5%) |
| National vote | D+0.8 |
| Republican chance of the popular vote | 47% |
| Republican Electoral College chance | 50% (Democrat 50%; Republican electoral votes on average 268) |
If approval moves: −10 (26.8%): Republican 47%, 49.0% of the vote −5 (31.8%): Republican 49%, 49.3% of the vote no change (36.8%): Republican 50%, 49.6% of the vote +5 (41.8%): Republican 52%, 49.9% of the vote +10 (46.8%): Republican 56%, 50.1% of the vote
Based on 5 elections (1960, 1968, 1988, 2000, 2024): Gallup approval about two weeks before election day against the governing party's share of the two-party vote. A president running again follows his approval closely (about 0.4 points of share per point); his party's nominee when he stands down about 0.17; the five sitting vice presidents barely at all, which five cases cannot settle. The Electoral College comes from that national vote and each state's lean, as in the forecast. Donald Trump*: the 22nd Amendment bars a third term; shown as a what-if only. Method.
Your scenario
Set Trump's approval in the summer of 2028 yourself. Your scenario is shown beside the forecast; it never replaces it.
Presets: Today: 37% Today's path (our projection): 39% A rise like Reagan 1982-84 (+12): 49.5% A rise like Clinton 1994-96 (+12): 48.5% A fall like Bush 1990-92 (-22): 25% A fall like Bush 2002-04 (-17): 25%
The workings: how the number is made, the polls behind it and every state
How the national number is made
| Trump's approval today | 36.8% (each pollster's latest poll, 28 pollsters); 33.0 on Gallup's scale |
|---|---|
| Approval in June 2028, projected | 39.2% (80%: 30-48%). Approval tends to drift back toward the middle over two years, with a wide spread. |
| Fundamentals | D+3.6 ± 4.2: a governing party with this approval, fitted on 7 elections since 2000 |
| Polls: party baseline | D+1.0 from 24 head-to-head polls of the last 240 days, after candidate and pollster effects |
| Weight on the polls | 21% at 730 days out (measured on 2000-2024) |
| Generic Democrat v generic Republican | 51.5–48.5, D+3.0 ± 4.5 (one standard deviation); Democratic Electoral College chance 66% |
| Check: the 1948+ fit | D+4.0 ± 5.6, Democratic chance 70% (swings twice as large; shown for comparison) |
The last election is used only for each state's lean, never for the national level. Margins are two-party, Democrat minus Republican.
Head-to-head polls today
From the same polls: how far each named candidate runs ahead of or behind the party's baseline today. Effects are shrunk hard (less-known candidates more), and only about 12% of today's effect is expected to last to November 2028 (0.59 per six months, measured on 2008-2024).
Democrats
| Candidate | Today | Matchups |
|---|---|---|
| Gavin Newsom | runs 0.8 points ahead of party (80%: -1.9 to +3.5) | 8 |
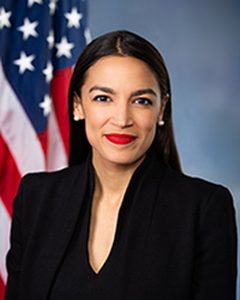 Alexandria Ocasio-Cortez | runs 3.4 points behind party (80%: -6.1 to -0.7) | 7 |
| Kamala Harris | runs 0.1 points ahead of party (80%: -3.1 to +3.3) | 5 |
No head-to-head evidence. Jon Ossoff (2 matchups, one pollster), Pete Buttigieg (2 matchups, one pollster), Gretchen Whitmer, Josh Shapiro, Stephen A. Smith.
Republicans
| Candidate | Today | Matchups |
|---|---|---|
| JD Vance | runs 1.2 points behind party (80%: -4.8 to +2.4) | 16 |
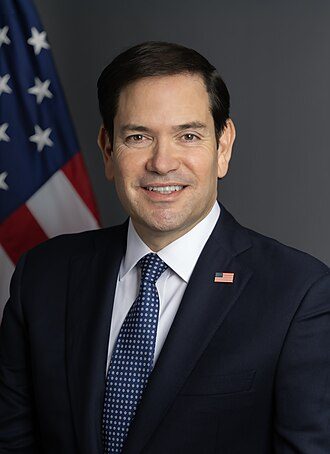 Marco Rubio | runs 1.7 points ahead of party (80%: -2.1 to +5.4) | 8 |
Polls behind the party baseline
| End | Pollster | Matchup | Margin | Correction | Weight |
|---|---|---|---|---|---|
| 14 Oct 2026 | YouGov tier 2 | Gavin Newsom v JD Vance | D+6.5 | -1.9 | 0.88 |
| 4 Oct 2026 | UMass Amherst / YouGov tier 1 | Gavin Newsom v JD Vance | D+4.5 | -0.5 | 1.09 |
| 29 Aug 2026 | Quantus Insights tier 3 | Alexandria Ocasio-Cortez v JD Vance | R+3.8 | +1.5 | 0.56 |
| 17 Aug 2026 | Emerson College tier 1 | Pete Buttigieg v JD Vance | D+5.6 | -1.1 | 0.96 |
| 17 Aug 2026 | Emerson College tier 1 | Pete Buttigieg v Marco Rubio | D+4.9 | -1.1 | 0.96 |
| 17 Aug 2026 | Emerson College tier 1 | Kamala Harris v Marco Rubio | R+5.4 | -1.1 | 0.96 |
| 17 Aug 2026 | Emerson College tier 1 | Kamala Harris v JD Vance | D+4.4 | -1.1 | 0.96 |
| 17 Aug 2026 | Emerson College tier 1 | Gavin Newsom v Marco Rubio | D+1.9 | -1.1 | 0.96 |
| 17 Aug 2026 | Emerson College tier 1 | Gavin Newsom v JD Vance | D+4.8 | -1.1 | 0.96 |
| 17 Aug 2026 | Emerson College tier 1 | Alexandria Ocasio-Cortez v JD Vance | R+2.5 | -1.1 | 0.96 |
| 17 Aug 2026 | Emerson College tier 1 | Alexandria Ocasio-Cortez v Marco Rubio | R+5.3 | -1.1 | 0.96 |
| 17 Aug 2026 | Emerson College tier 1 | Jon Ossoff v JD Vance | D+5.4 | -1.1 | 0.96 |
| 17 Aug 2026 | Emerson College tier 1 | Jon Ossoff v Marco Rubio | D+3.6 | -1.1 | 0.96 |
| 4 Jul 2026 | Zogby Interactive tier 4 | Harris v Vance | D+5.5 | +0.6 | 0.19 |
| 4 Jul 2026 | Zogby Interactive tier 4 | Newsom v Vance | R+8.4 | +0.6 | 0.19 |
| 4 Jul 2026 | Zogby Interactive tier 4 | Ocasio-Cortez v Vance | R+8.4 | +0.6 | 0.19 |
| 4 Jul 2026 | Zogby Interactive tier 4 | Harris v Rubio | D+5.7 | +0.6 | 0.19 |
| 4 Jul 2026 | Zogby Interactive tier 4 | Newsom v Rubio | R+5.3 | +0.6 | 0.19 |
| 4 Jul 2026 | Zogby Interactive tier 4 | Ocasio-Cortez v Rubio | R+1.3 | +0.6 | 0.19 |
| 21 May 2026 | TPSI tier 3 | Harris v Vance | D+9.3 | 0.0 | 0.32 |
| 20 May 2026 | Overton Insights tier 3 | Newsom v Vance | D+6.0 | 0.0 | 0.34 |
| 30 Mar 2026 | UMass Amherst / YouGov tier 1 | Newsom v Vance | R+4.3 | -0.5 | 0.37 |
| 30 Mar 2026 | UMass Amherst / YouGov tier 1 | Ocasio-Cortez v Vance | R+4.3 | -0.5 | 0.37 |
| 10 Mar 2026 | Focaldata tier 4 | Ocasio-Cortez v Vance | D+3.6 | -2.1 | 0.16 |
Margin on the decided vote. Correction: the firm's past lean against results, from our pollster audit, applied the same way for both parties. Weight: recency (half-life 120 days) × the firm's accuracy and disclosure weight × one half for polls paid for by a party, campaign, PAC or advocacy group.
Every state
| State | EV | 2024 | Lean | Polls | Margin | Vote D–R | Chance D |
|---|---|---|---|---|---|---|---|
| Nebraska 3rd district | 1 | R+54.4 | R+52.6 | – | R+49.5 | 25.2–74.8 | 0% |
| Wyoming | 3 | R+47.0 | R+45.2 | – | R+42.2 | 28.9–71.1 | 0% |
| West Virginia | 4 | R+42.7 | R+40.9 | – | R+37.9 | 31.1–68.9 | 0% |
| Idaho | 4 | R+37.5 | R+35.8 | – | R+32.8 | 33.6–66.4 | 0% |
| North Dakota | 3 | R+37.4 | R+35.7 | – | R+32.6 | 33.7–66.3 | 0% |
| Oklahoma | 7 | R+34.9 | R+33.2 | – | R+30.2 | 34.9–65.1 | 0% |
| Arkansas | 6 | R+31.3 | R+29.7 | – | R+26.5 | 36.7–63.3 | under 1% |
| Kentucky | 8 | R+31.0 | R+29.4 | – | R+26.3 | 36.9–63.1 | 0% |
| Alabama | 9 | R+30.9 | R+29.2 | – | R+26.1 | 36.9–63.1 | under 1% |
| Tennessee | 11 | R+30.1 | R+28.5 | – | R+25.4 | 37.3–62.7 | 0% |
| South Dakota | 3 | R+29.9 | R+28.2 | – | R+25.2 | 37.4–62.6 | under 1% |
| Mississippi | 6 | R+23.1 | R+21.5 | – | R+18.4 | 40.8–59.2 | under 1% |
| Louisiana | 8 | R+22.4 | R+20.7 | – | R+17.6 | 41.2–58.8 | 1% |
| Utah | 6 | R+22.2 | R+20.6 | – | R+17.5 | 41.2–58.8 | 1% |
| Nebraska | 2 | R+20.8 | R+19.2 | – | R+16.1 | 41.9–58.1 | 1% |
| Montana | 4 | R+20.6 | R+19.0 | – | R+15.9 | 42.1–57.9 | 1% |
| Indiana | 11 | R+19.3 | R+17.7 | – | R+14.6 | 42.7–57.3 | 2% |
| Missouri | 10 | R+18.7 | R+17.1 | – | R+14.0 | 43.0–57.0 | 3% |
| South Carolina | 9 | R+18.1 | R+16.5 | – | R+13.4 | 43.3–56.7 | 3% |
| Kansas | 6 | R+16.4 | R+14.8 | – | R+11.7 | 44.1–55.9 | 5% |
| Texas | 40 | R+13.9 | R+12.3 | – | R+9.2 | 45.4–54.6 | 9% |
| Alaska | 3 | R+13.7 | R+12.1 | – | R+9.0 | 45.5–54.5 | 10% |
| Iowa | 6 | R+13.4 | R+11.9 | – | R+8.8 | 45.6–54.4 | 11% |
| Nebraska 1st district | 1 | R+13.2 | R+11.7 | – | R+8.6 | 45.7–54.3 | 13% |
| Florida | 30 | R+13.2 | R+11.7 | – | R+8.5 | 45.7–54.3 | 12% |
| Ohio | 17 | R+11.3 | R+9.8 | – | R+6.6 | 46.7–53.3 | 18% |
| Maine 2nd district | 1 | R+9.2 | R+7.7 | – | R+4.5 | 47.7–52.3 | 28% |
| Arizona | 11 | R+5.6 | R+4.1 | – | R+0.9 | 49.5–50.5 | 45% |
| Nevada | 6 | R+3.2 | R+3.7 | R+3.2 (1) | R+0.5 | 49.7–50.3 | 47% |
| North Carolina | 16 | R+3.3 | R+1.8 | – | D+1.4 | 50.7–49.3 | 59% |
| Georgia | 16 | R+2.2 | R+0.7 | – | D+2.5 | 51.2–48.8 | 65% |
| Pennsylvania | 19 | R+1.7 | R+0.2 | – | D+2.9 | 51.5–48.5 | 67% |
| Michigan | 15 | R+1.4 | D+0.1 | – | D+3.2 | 51.6–48.4 | 68% |
| Wisconsin | 10 | R+0.9 | D+0.6 | – | D+3.7 | 51.9–48.1 | 70% |
| New Hampshire | 4 | D+2.8 | D+4.3 | – | D+7.5 | 53.7–46.3 | 86% |
| Minnesota | 10 | D+4.3 | D+5.8 | – | D+9.0 | 54.5–45.5 | 89% |
| Nebraska 2nd district | 1 | D+4.7 | D+6.1 | – | D+9.2 | 54.6–45.4 | 89% |
| Virginia | 13 | D+5.9 | D+7.3 | – | D+10.5 | 55.3–44.7 | 93% |
| New Jersey | 14 | D+6.0 | D+7.5 | – | D+10.7 | 55.3–44.7 | 94% |
| New Mexico | 5 | D+6.1 | D+7.6 | – | D+10.8 | 55.4–44.6 | 93% |
| Maine | 2 | D+7.1 | D+8.5 | – | D+11.7 | 55.9–44.1 | 95% |
| Illinois | 19 | D+11.1 | D+12.6 | – | D+15.7 | 57.9–42.1 | 99% |
| Colorado | 10 | D+11.3 | D+12.7 | – | D+15.9 | 57.9–42.1 | 99% |
| New York | 28 | D+12.7 | D+14.1 | – | D+17.3 | 58.7–41.3 | 99% |
| Rhode Island | 4 | D+14.2 | D+15.6 | – | D+18.8 | 59.4–40.6 | over 99% |
| Connecticut | 7 | D+14.8 | D+16.2 | – | D+19.4 | 59.7–40.3 | over 99% |
| Oregon | 8 | D+14.9 | D+16.3 | – | D+19.5 | 59.7–40.3 | over 99% |
| Delaware | 3 | D+15.0 | D+16.4 | – | D+19.6 | 59.8–40.2 | over 99% |
| Hawaii | 4 | D+23.6 | D+24.9 | – | D+21.5 | 60.8–39.2 | over 99% |
| Washington | 12 | D+18.9 | D+20.3 | – | D+23.5 | 61.8–38.2 | over 99% |
| California | 54 | D+20.8 | D+22.2 | – | D+25.4 | 62.7–37.3 | over 99% |
| Maine 1st district | 1 | D+22.1 | D+23.5 | – | D+26.6 | 63.3–36.7 | over 99% |
| Massachusetts | 11 | D+25.9 | D+27.2 | – | D+30.5 | 65.3–34.7 | over 99% |
| Maryland | 10 | D+29.5 | D+30.8 | – | D+34.1 | 67.0–33.0 | over 99% |
| Vermont | 3 | D+32.8 | D+34.1 | – | D+37.3 | 68.7–31.3 | over 99% |
| District of Columbia | 3 | D+86.6 | D+87.6 | – | D+91.0 | 95.5–4.5 | over 99% |
Lean: the state's 2024 two-party margin against the nation's, times 0.99 (how much of a state's lean has carried to the next election since 2000); a state poll moves it by its measured value. Each simulation draws the national vote, a shift for each census division (sd 3.4) and each state (sd 4.6); Maine's and Nebraska's districts add their own. 2024 results: MIT Election Data and Science Lab.
The 2028 election: common questions
- When is the 2028 presidential election?
- Tuesday 7 November 2028, 736 days from today. A candidate needs 270 of the 538 electoral votes to win.
- Who is favoured to win in 2028?
- In our early projection, with Kamala Harris against JD Vance, Kamala Harris wins 68% of our simulated elections and JD Vance 31%, with 292 electoral votes on average. Pick any other Democrat and Republican above to see their odds; this far out few head-to-head polls exist, so the numbers will move.
- How does this 2028 prediction work?
- It starts from the national vote between the two parties, adds what head-to-head polls say about each candidate, then simulates every state many times, with shared errors so that states move together. The share of simulations each candidate wins is their chance. The full method and its backtests are on the method page.
- Can Donald Trump run in 2028?
- No. The 22nd Amendment bars anyone elected president twice from being elected again. He appears in the picker only because pollsters still ask about him; that is not a view that he can run.
- Can I see a state-by-state 2028 electoral map?
- Yes: the map above colours every state by the chosen candidates' chance of winning it, and you can make and share your own map on the make-your-own-map page.
How this forecast works, and how it did in its backtests
Candidate photo credits
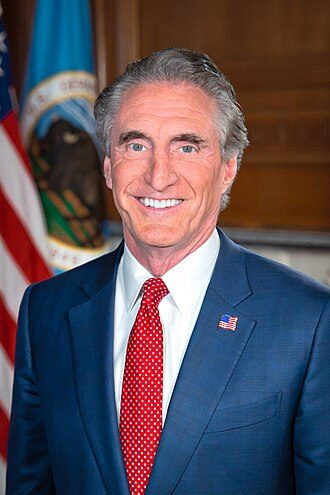
- Gavin Newsom: Photo: Charles Ommanney – Office of the Governor of California, CC BY-SA 4.0, via Wikimedia Commons (https://commons.wikimedia.org/wiki/File:Governor_of_California_Gavin_Newsom_(cropped_3x4).jpg)
- Alexandria Ocasio-Cortez: Official portrait: Biographical Directory of the United States Congress (US government work, public domain) (https://bioguide.congress.gov/photo/O000172.jpg)
- Kamala Harris: Photo: The White House, Public domain, via Wikimedia Commons (https://commons.wikimedia.org/wiki/File:Kamala_Harris_Vice_Presidential_Portrait.jpg)
- Jon Ossoff: Official portrait: Biographical Directory of the United States Congress (US government work, public domain) (https://bioguide.congress.gov/photo/O000174.jpg)
- Pete Buttigieg: Photo: United States Department of Transportation, Public domain, via Wikimedia Commons (https://commons.wikimedia.org/wiki/File:Pete_Buttigieg,_Secretary_of_Transportation.jpg)
- Amy Klobuchar: Official portrait: Biographical Directory of the United States Congress (US government work, public domain) (https://bioguide.congress.gov/photo/K000367.jpg)
- Andy Beshear: Photo: Dale Greer, Public domain, via Wikimedia Commons (https://commons.wikimedia.org/wiki/File:Kentucky_Air_Guard_supports_governor's_inauguration_(1)_(cropped).jpg)
- Bernie Sanders: Official portrait: Biographical Directory of the United States Congress (US government work, public domain) (https://bioguide.congress.gov/photo/S000033.jpg)
- Beto O'Rourke: Photo: Gage Skidmore from Peoria, AZ, United States of America, CC BY-SA 2.0, via Wikimedia Commons (https://commons.wikimedia.org/wiki/File:Beto_O'Rourke_April_2019.jpg)
- Chris Murphy: Official portrait: Biographical Directory of the United States Congress (US government work, public domain) (https://bioguide.congress.gov/photo/M001169.jpg)
- Chris Van Hollen: Official portrait: Biographical Directory of the United States Congress (US government work, public domain) (https://bioguide.congress.gov/photo/V000128.jpg)
- Cory Booker: Official portrait: Biographical Directory of the United States Congress (US government work, public domain) (https://bioguide.congress.gov/photo/B001288.jpg)
- Gretchen Whitmer: Photo: LBJLibraryNow, Public domain, via Wikimedia Commons (https://commons.wikimedia.org/wiki/File:2025_Gretchen_Whitmer_(cropped).jpg)
- JB Pritzker: Photo: Maryland GovPics, CC BY 2.0, via Wikimedia Commons (https://commons.wikimedia.org/wiki/File:J.B._Pritzker_April_2023.jpg)
- Jared Polis: Photo: US House Office of Photography, Public domain, via Wikimedia Commons (https://commons.wikimedia.org/wiki/File:Jared_Polis_official_photo.jpg)
- Jasmine Crockett: Official portrait: Biographical Directory of the United States Congress (US government work, public domain) (https://bioguide.congress.gov/photo/C001130.jpg)
- John Fetterman: Official portrait: Biographical Directory of the United States Congress (US government work, public domain) (https://bioguide.congress.gov/photo/F000479.jpg)
- Josh Shapiro: Photo: Governor Tom Wolf, CC BY 2.0, via Wikimedia Commons (https://commons.wikimedia.org/wiki/File:Josh_Shapiro_2022_(cropped).jpg)
- Mark Kelly: Official portrait: Biographical Directory of the United States Congress (US government work, public domain) (https://bioguide.congress.gov/photo/K000377.jpg)
- Phil Murphy: Photo: Montclair Film, CC BY 4.0, via Wikimedia Commons (https://commons.wikimedia.org/wiki/File:Phil_Murphy_Montclair_2025.jpg)
- Rahm Emanuel: Photo: U.S. Embassy in Japan, Public domain, via Wikimedia Commons (https://commons.wikimedia.org/wiki/File:Ambassador-emanuel-portrait.jpg)
- Raphael Warnock: Official portrait: Biographical Directory of the United States Congress (US government work, public domain) (https://bioguide.congress.gov/photo/W000790.jpg)
- Ro Khanna: Official portrait: Biographical Directory of the United States Congress (US government work, public domain) (https://bioguide.congress.gov/photo/K000389.jpg)
- Roy Cooper: Photo: NCDOTcommunications, CC BY 2.0, via Wikimedia Commons (https://commons.wikimedia.org/wiki/File:Gov._Cooper_Cropped.jpg)
- Ruben Gallego: Official portrait: Biographical Directory of the United States Congress (US government work, public domain) (https://bioguide.congress.gov/photo/G000574.jpg)
- Stephen A. Smith: Photo: Moody College of Communication, CC BY-SA 2.0, via Wikimedia Commons (https://commons.wikimedia.org/wiki/File:Stephen_A._Smith_in_January_2023_(3x4_cropped_c).jpg)
- Tim Walz: Photo: Gage Skidmore, CC BY-SA 3.0, via Wikimedia Commons (https://commons.wikimedia.org/wiki/File:Tim_Walz_by_Gage_Skidmore.jpg)
- Wes Moore: Photo: Maryland State Government, CC BY-SA 4.0, via Wikimedia Commons (https://commons.wikimedia.org/wiki/File:Wes_Moore_Official_Governor_Portrait.jpg)
- JD Vance: Photo: Emily J. Higgins, Public domain, via Wikimedia Commons (https://commons.wikimedia.org/wiki/File:March_2026_Official_Vice_Presidential_Portrait_of_JD_Vance.jpg)
- Marco Rubio: Photo: U.S. Department of State, Public domain, via Wikimedia Commons (https://commons.wikimedia.org/wiki/File:Official_portrait_of_Secretary_Marco_Rubio.jpg)
- Brian Kemp: Photo: Office of U.S. Senator David Perdue, Public domain, via Wikimedia Commons (https://commons.wikimedia.org/wiki/File:David_Perdue_and_Brian_Kemp_(cropped).jpg)
- Donald Trump Jr.: Photo: Gage Skidmore from Surprise, AZ, United States of America, CC BY-SA 2.0, via Wikimedia Commons (https://commons.wikimedia.org/wiki/File:Donald_Trump,_Jr._(53808883476)_(cropped).jpg)
- Doug Burgum: Photo: United States Department of the Interior, Public domain, via Wikimedia Commons (https://commons.wikimedia.org/wiki/File:Doug_Burgum_2025_DOI_portrait.jpg)
- Elise Stefanik: Official portrait: Biographical Directory of the United States Congress (US government work, public domain) (https://bioguide.congress.gov/photo/S001196.jpg)
- Glenn Youngkin: Photo: Kate Magee Joyce for Glenn Youngkin from Virginia, United States, CC BY-SA 2.0, via Wikimedia Commons (https://commons.wikimedia.org/wiki/File:Glenn_Youngkin_Headshot.jpg)
- Greg Abbott: Photo: NASA Johnson Space Center / NASA-JSC/ROBERT MARKOWITZ, Public domain, via Wikimedia Commons (https://commons.wikimedia.org/wiki/File:Greg_Abbott_at_NASA_2024_(cropped).jpg)
- Josh Hawley: Official portrait: Biographical Directory of the United States Congress (US government work, public domain) (https://bioguide.congress.gov/photo/H001089.jpg)
- Kristi Noem: Photo: U.S. Department of Homeland Security, Public domain, via Wikimedia Commons (https://commons.wikimedia.org/wiki/File:Official_Portrait_of_Secretary_Kristi_Noem.jpg)
- Larry Hogan: Photo: Maryland GovPics, CC BY 2.0, via Wikimedia Commons (https://commons.wikimedia.org/wiki/File:Larry_Hogan_(2021)_(cropped).jpg)
- Lee Zeldin: Photo: U.S. Environmental Protection Agency, Public domain, via Wikimedia Commons (https://commons.wikimedia.org/wiki/File:Lee-Zeldin-EPA-Official-Portrait.jpg)
- Marjorie Taylor Greene: Photo: House Creative Services, Public domain, via Wikimedia Commons (https://commons.wikimedia.org/wiki/File:Marjorie_Taylor_Greene_117th_Congress_portrait.jpeg)
- Nikki Haley: Photo: United States Department of State, Public domain, via Wikimedia Commons (https://commons.wikimedia.org/wiki/File:Nikki_Haley_official_photo.jpg)
- Rand Paul: Official portrait: Biographical Directory of the United States Congress (US government work, public domain) (https://bioguide.congress.gov/photo/P000603.jpg)
- Rick Scott: Official portrait: Biographical Directory of the United States Congress (US government work, public domain) (https://bioguide.congress.gov/photo/S001217.jpg)
- Robert F. Kennedy Jr.: Photo: U.S. Department of Health and Human Services, Public domain, via Wikimedia Commons (https://commons.wikimedia.org/wiki/File:Robert_F._Kennedy_Jr.,_official_portrait_(2025)_(cropped_3-4).jpg)
- Ron DeSantis: Photo: United States Congress, Public domain, via Wikimedia Commons (https://commons.wikimedia.org/wiki/File:Ron_DeSantis_113th_Congress.jpg)
- Sarah Huckabee Sanders: Photo: Gage Skidmore, CC BY-SA 4.0, via Wikimedia Commons (https://commons.wikimedia.org/wiki/File:Governor_Sarah_Huckabee_Sanders_2026.jpg)
- Spencer Cox: Photo: Maryland GovPics, CC BY 2.0, via Wikimedia Commons (https://commons.wikimedia.org/wiki/File:Spencer_Cox_at_the_Economic_Club_of_Washington_D.C._(53545313288).jpg)
- Ted Cruz: Official portrait: Biographical Directory of the United States Congress (US government work, public domain) (https://bioguide.congress.gov/photo/C001098.jpg)
- Thomas Massie: Official portrait: Biographical Directory of the United States Congress (US government work, public domain) (https://bioguide.congress.gov/photo/M001184.jpg)
- Tim Scott: Official portrait: Biographical Directory of the United States Congress (US government work, public domain) (https://bioguide.congress.gov/photo/S001184.jpg)
- Tom Cotton: Official portrait: Biographical Directory of the United States Congress (US government work, public domain) (https://bioguide.congress.gov/photo/C001095.jpg)
- Tucker Carlson: Photo: Gage Skidmore, CC BY-SA 4.0, via Wikimedia Commons (https://commons.wikimedia.org/wiki/File:Tucker_Carlson_2025.jpg)
- Tulsi Gabbard: Photo: Office of the Director of National Intelligence, Public domain, via Wikimedia Commons (https://commons.wikimedia.org/wiki/File:Director_Tulsi_Gabbard_Official_Portrait.jpg)
- Vivek Ramaswamy: Photo: Gage Skidmore, CC BY-SA 4.0, via Wikimedia Commons (https://commons.wikimedia.org/wiki/File:Vivek_Ramaswamy_(55241367373)_(cropped).jpg)
- Donald Trump: Photo: The White House, Public domain, via Wikimedia Commons (https://commons.wikimedia.org/wiki/File:January_2025_Official_Presidential_Portrait_of_Donald_J._Trump.jpg)