
Seats · South East · old boundaries (ENG-2010)
Arundel and South Downs
Arundel and South Downs as it was drawn from 2010 to 2024: the results of the 5 elections fought on these boundaries, and the seats that replaced it.
Results
2019 general election
Con hold · turnout 75.1% · majority 22,521
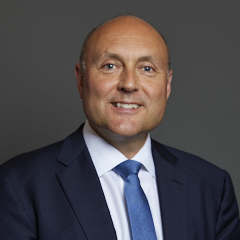 Andrew Griffith Con
57.9%
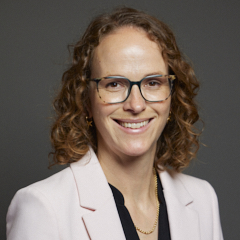 Alison Bennett LD
21.2%
Bella Sankey Lab
15.8%
Isabel Thurston Green
4.1%
Robert Wheal
0.9%
2017 general election
Con hold · turnout 75.8% · majority 23,883
Nick Herbert Con · MP
62.4%
Caroline Fife Lab
22.7%
Shweta Kapadia LD
7.9%
Johanna Prior Green
4.2%
John Wallace UKIP
2.8%
2015 general election
Con hold · turnout 73.1% · majority 26,177
Nick Herbert Con · MP
60.8%
Peter Grace UKIP
14.4%
Christopher Wellbelove Lab
11.2%
Shweta Kapadia LD
7.2%
Isabel Thurston Green
6.4%
2010 general election
Con hold · turnout 72.9% · majority 16,691
Nick Herbert Con · MP
57.8%
Derek Deedman LD
27.9%
Tim Lunnon Lab
8.6%
Stuart Bower UKIP
5.7%
2005 general election (notional result on these boundaries)
· turnout 70.8% · majority 12,291
Conservative
50.3%
Liberal Democrat
26.5%
Labour
17.3%
UK Independence Party
5.3%
0.6%
Boundary changes
| Seat | Boundaries | Share of population |
|---|---|---|
| Arundel and South Downs | ENG-2024 (successor) | 67% of this seat's people |
| Mid Sussex | ENG-2024 (successor) | 17% of this seat's people |
| Worthing West | ENG-2024 (successor) | 11% of this seat's people |
| Horsham | ENG-2024 (successor) | 5% of this seat's people |
Figures as of . Published by Polling Forecast.




