
Seats · West Midlands · old boundaries (ENG-2010)
Warwick and Leamington
Warwick and Leamington as it was drawn from 2010 to 2024: the results of the 5 elections fought on these boundaries, and the seats that replaced it.
Results
2019 general election
Lab hold · turnout 71.0% · majority 789
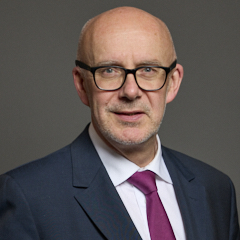 Matt Western Lab · MP
43.8%
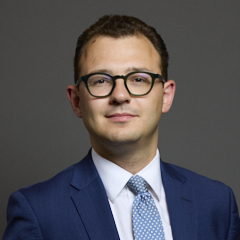 Jack Rankin Con
42.3%
Louis Adam LD
9.2%
Jonathan Chilvers Green
2.8%
Tim Griffiths BRX
1.5%
Bob Dhillon
0.3%
Xander Bennett SDP
0.1%
2017 general election
Lab gain from Con · turnout 72.8% · majority 1,206
Matt Western Lab46.7%
Chris White Con · MP
44.4%
Nick Solman LD
5.2%
Jonathan Chilvers Green
2.2%
Bob Dhillon UKIP
1.5%
2015 general election
Con hold · turnout 70.7% · majority 6,606
Chris White Con · MP
47.9%
Lynnette Kelly Lab
34.9%
Alastair MacBrayne UKIP
8.3%
Haseeb Arif LD
5.0%
Azzees Minott Green
3.9%
2010 general election
Con gain from Lab · turnout 72.3% · majority 3,513
Chris White Con
42.6%
James Plaskitt Lab · MP
35.4%
Alan Beddow LD
18.3%
Christopher Lenton UKIP
1.9%
Ian Davison Green
1.4%
Jim Cullinane
0.4%
2005 general election (notional result on these boundaries)
· turnout 65.7% · majority 4,393
Labour
44.7%
Conservative
34.4%
Liberal Democrat
15.9%
Green Party
3.4%
UK Independence Party
1.7%
Boundary changes
| Seat | Boundaries | Share of population |
|---|---|---|
| Warwick and Leamington | ENG-2024 (successor) | 94% of this seat's people |
| Kenilworth and Southam | ENG-2024 (successor) | 6% of this seat's people |
Figures as of . Published by Polling Forecast.




