
Seats · North East · old boundaries (ENG-2010)
Tynemouth
Tynemouth as it was drawn from 2010 to 2024: the results of the 5 elections fought on these boundaries, and the seats that replaced it.
Results
2019 general election
Lab hold · turnout 72.5% · majority 4,857
Alan Campbell Lab · MP
48.1%
Lewis Bartoli Con
39.4%
John Appleby LD
6.8%
Ed Punchard BRX
3.5%
Julia Erskine Green
2.3%
2017 general election
Lab hold · turnout 73.4% · majority 11,666
Alan Campbell Lab · MP
57.0%
Nick Varley Con
36.5%
John Appleby LD
3.0%
Stuart Houghton UKIP
2.2%
Julia Erskine Green
1.1%
Anthony Jull
0.2%
2015 general election
Lab hold · turnout 69.0% · majority 8,240
Alan Campbell Lab · MP
48.2%
Glenn Hall Con
32.8%
Gary Legg UKIP
12.2%
Julia Erskine Green
3.8%
John Paton Day LD
3.0%
2010 general election
Lab hold · turnout 69.6% · majority 5,739
Alan Campbell Lab · MP
45.3%
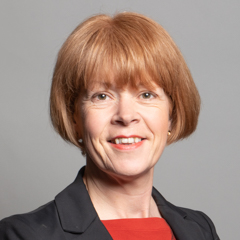 Wendy Morton Con
34.4%
John Appleby LD
14.9%
Dorothy Brooke BNP
2.7%
Natasha Payne UKIP
1.7%
Julia Erskine Green
1.0%
2005 general election (notional result on these boundaries)
· turnout 66.0% · majority 5,490
Labour
48.3%
Conservative
36.6%
Liberal Democrat
15.1%
Boundary changes
| Seat | Boundaries | Share of population |
|---|---|---|
| Tynemouth | ENG-2024 (successor) | 86% of this seat's people |
| Cramlington and Killingworth | ENG-2024 (successor) | 14% of this seat's people |
Figures as of . Published by Polling Forecast.




