
Seats · East of England · old boundaries (ENG-2010)
Suffolk Coastal
Suffolk Coastal as it was drawn from 2010 to 2024: the results of the 5 elections fought on these boundaries, and the seats that replaced it.
Results
2019 general election
Con hold · turnout 71.2% · majority 20,533
Thérèse Coffey Con · MP
56.5%
Cameron Matthews Lab
21.3%
Jules Ewart LD
15.0%
Rachel Smith-Lyte Green
4.7%
Tony Love
2.6%
2017 general election
Con hold · turnout 73.2% · majority 16,012
Therese Coffey Con · MP
58.1%
Cameron Matthews Lab
30.5%
James Sandbach LD
7.0%
Eamonn O'Nolan Green
3.1%
Philip Young
1.4%
2015 general election
Con hold · turnout 71.4% · majority 18,842
Therese Coffey Con · MP
51.9%
Russell Whiting Lab
18.0%
Daryll Pitcher UKIP
15.6%
James Sandbach LD
8.6%
Rachel Smith-Lyte Green
5.9%
2010 general election
Con hold · turnout 71.7% · majority 9,128
Therese Coffey Con
46.4%
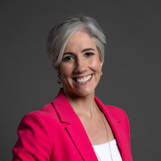 Daisy Cooper LD
29.8%
Adam Leeder Lab
16.1%
Stephen Bush UKIP
5.7%
Rachel Fulcher Green
2.0%
2005 general election (notional result on these boundaries)
· turnout 67.2% · majority 9,674
Conservative
44.6%
Labour
26.1%
Liberal Democrat
22.1%
UK Independence Party
3.8%
Green Party
3.3%
Boundary changes
| Seat | Boundaries | Share of population |
|---|---|---|
| Suffolk Coastal | ENG-2024 (successor) | 90% of this seat's people |
| Waveney Valley | ENG-2024 (successor) | 8% of this seat's people |
| Central Suffolk and North Ipswich | ENG-2024 (successor) | 2% of this seat's people |
Figures as of . Published by Polling Forecast.




