
Seats · Wales · old boundaries (WAL-2010)
Monmouth
Monmouth as it was drawn from 2010 to 2024: the results of the 5 elections fought on these boundaries, and the seats that replaced it.
Results
2019 general election
Con hold · turnout 74.8% · majority 9,982
David T. C. Davies Con · MP
52.1%
Yvonne Murphy Lab
32.2%
Alison Willott LD
9.8%
Ian Chandler Green
2.7%
Hugh Kocan PC
2.4%
Martyn Ford
0.9%
2017 general election
Con hold · turnout 76.6% · majority 8,206
David Davies Con · MP
53.1%
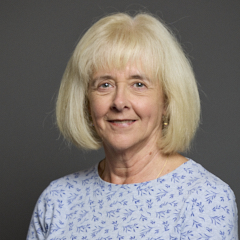 Ruth Jones Lab
36.6%
Veronica German LD
4.2%
Carole Damon PC
2.7%
Ian Chandler Green
1.9%
Roy Neale UKIP
1.5%
2015 general election
Con hold · turnout 76.2% · majority 10,982
David Davies Con · MP
49.9%
Ruth Jones Lab26.8%
Gareth Dunn UKIP
10.4%
Veronica German LD
5.3%
Jonathan Clark PC
4.0%
Chris Were Green
3.4%
Stephen Morris ED
0.2%
2010 general election
Con hold · turnout 72.1% · majority 10,425
David Davies Con · MP
48.3%
Hamish Sandison Lab
25.9%
Martin Blakebrough LD
19.4%
Jonathan Clark PC
2.7%
Derek Rowe UKIP
2.4%
Stephen Millson Green
1.3%
2005 general election (notional result on these boundaries)
· turnout 73.4% · majority 4,527
Conservative
46.9%
Labour
37.0%
Liberal Democrat
12.8%
Plaid Cymru
2.2%
UK Independence Party
1.2%
0.0%
Boundary changes
| Seat | Boundaries | Share of population |
|---|---|---|
| Monmouthshire | WAL-2024 (successor) | 89% of this seat's people |
| Torfaen | WAL-2024 (successor) | 11% of this seat's people |
Figures as of . Published by Polling Forecast.




