
Seats · London · old boundaries (ENG-2010)
Old Bexley and Sidcup
Old Bexley and Sidcup as it was drawn from 2010 to 2024: the results of the 6 elections fought on these boundaries, and the seats that replaced it.
Results
By-election, 2 December 2021
Con hold · turnout 33.5% · majority 4,478
Louie French Con
51.5%
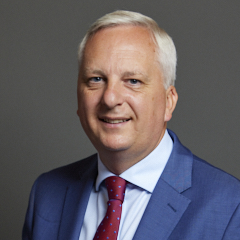 Daniel Francis Lab
30.9%
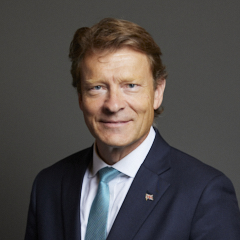 Richard Tice RUK
6.6%
Jonathan Rooks Green
3.8%
Simone Reynolds LD
3.0%
Elaine Cheeseman ED
1.2%
John Poynton UKIP
0.8%
Richard Hewison REU
0.7%
David Kurten HPUK
0.5%
Carol Valinejad CPA
0.5%
Mad Mike Young MRLP
0.4%
2019 general election
Con hold · turnout 69.8% · majority 18,952
James Brokenshire Con · MP
64.5%
David Tingle Lab
23.5%
Simone Reynolds LD
8.3%
Matt Browne Green
3.2%
Carol Valinejad CPA
0.5%
2017 general election
Con hold · turnout 72.8% · majority 15,466
James Brokenshire Con · MP
61.5%
Danny Hackett Lab
29.3%
Freddy Vachha UKIP
3.4%
Drew Heffernan LD
3.3%
Derek Moran Green
1.7%
Michael Jones BNP
0.7%
Chinwe Nwadikeduruibe CPA
0.2%
2015 general election
Con hold · turnout 70.8% · majority 15,803
James Brokenshire Con · MP
52.8%
Ibby Mehmet Lab
19.0%
Catherine Reilly UKIP
18.2%
Jennifer Keen LD
3.5%
Derek Moran Green
2.9%
Bob Gill NHAP
2.6%
Laurence Williams CHP
0.5%
Nicola Finch BNP
0.5%
2010 general election
Con hold · turnout 69.2% · majority 15,857
James Brokenshire Con · MP
54.1%
Rick Everitt Lab
19.3%
Duncan Borrowman LD
15.4%
John Brooks BNP
4.7%
David Coburn UKIP
3.4%
Elaine Cheeseman ED
1.1%
John Hemming-Clark ISQM
0.9%
Jonathan Rooks Green
0.8%
Napoleon Dynamite MRLP
0.3%
2005 general election (notional result on these boundaries)
· turnout 65.2% · majority 9,309
Conservative
50.0%
Labour
28.0%
Liberal Democrat
13.9%
UK Independence Party
4.5%
British National Party
2.9%
0.7%
Boundary changes
| Seat | Boundaries | Share of population |
|---|---|---|
| Old Bexley and Sidcup | ENG-2024 (successor) | 100% of this seat's people |
Figures as of . Published by Polling Forecast.




