
Seats · East of England · old boundaries (ENG-2010)
Norwich South
Norwich South as it was drawn from 2010 to 2024: the results of the 5 elections fought on these boundaries, and the seats that replaced it.
Results
2019 general election
Lab hold · turnout 66.4% · majority 12,760
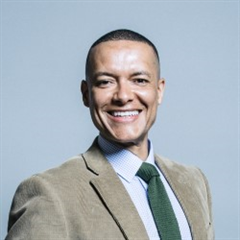 Clive Lewis Lab · MP
53.7%
Mike Spencer Con
29.0%
James Wright LD
9.2%
Catherine Rowett Green
4.8%
Sandy Gilchrist BRX
3.2%
2017 general election
Lab hold · turnout 69.2% · majority 15,596
Clive Lewis Lab · MP61.0%
Lana Hempsall Con
30.6%
James Wright LD
5.5%
Richard Bearman Green
2.9%
2015 general election
Lab gain from LD · turnout 64.7% · majority 7,654
Clive Lewis Lab39.3%
Lisa Townsend Con
23.5%
Lesley Grahame Green
13.9%
Simon Wright LD · MP
13.6%
Steve Emmens UKIP
9.4%
David Peel CW
0.2%
Cengiz Ceker
0.1%
2010 general election
LD gain from Lab · turnout 64.6% · majority 310
Simon Wright LD
29.4%
Charles Clarke Lab · MP
28.7%
Antony Little Con
22.9%
 Adrian Ramsay Green
14.9%
Steve Emmens UKIP
2.4%
Leonard Heather BNP
1.5%
Gabriel Polley WRP
0.2%
2005 general election (notional result on these boundaries)
· turnout 59.0% · majority 3,023
Labour
37.4%
Liberal Democrat
30.0%
Conservative
21.8%
Green Party
7.4%
1.9%
UK Independence Party
1.5%
Boundary changes
| Seat | Boundaries | Share of population |
|---|---|---|
| Norwich South | ENG-2024 (successor) | 98% of this seat's people |
| Norwich North | ENG-2024 (successor) | 2% of this seat's people |
Figures as of . Published by Polling Forecast.




