
Seats · North East · old boundaries (ENG-2010)
North Tyneside
North Tyneside as it was drawn from 2010 to 2024: the results of the 5 elections fought on these boundaries, and the seats that replaced it.
Results
2019 general election
Lab hold · turnout 63.9% · majority 9,561
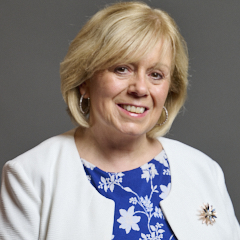 Mary Glindon Lab · MP
49.7%
Dean Carroll Con
30.7%
Andrew Husband BRX
10.4%
Christopher Boyle LD
6.4%
John Buttery Green
2.8%
2017 general election
Lab hold · turnout 65.8% · majority 19,284
Mary Glindon Lab · MP64.5%
Henry Newman Con
27.3%
Gary Legg UKIP
4.0%
Greg Stone LD
2.9%
Martin Collins Green
1.3%
2015 general election
Lab hold · turnout 59.0% · majority 17,194
Mary Glindon Lab · MP55.9%
Martin McGann Con
19.2%
Scott Hartley UKIP
16.3%
John Appleby LD
4.4%
Martin Collins Green
3.1%
Tim Wall TUSC
0.6%
Bob Batten NF
0.4%
2010 general election
Lab hold · turnout 59.7% · majority 12,884
Mary Glindon Lab50.7%
David Ord LD
22.9%
Gagan Mohindra Con
18.3%
John Burrows BNP
4.0%
Claudia Blake UKIP
2.8%
Bob Batten NF
1.3%
2005 general election (notional result on these boundaries)
· turnout 55.4% · majority 14,929
Labour
59.4%
Liberal Democrat
22.0%
Conservative
18.6%
Boundary changes
| Seat | Boundaries | Share of population |
|---|---|---|
| Newcastle upon Tyne East and Wallsend | ENG-2024 (successor) | 43% of this seat's people |
| Cramlington and Killingworth | ENG-2024 (successor) | 30% of this seat's people |
| Newcastle upon Tyne North | ENG-2024 (successor) | 20% of this seat's people |
| Tynemouth | ENG-2024 (successor) | 7% of this seat's people |
Figures as of . Published by Polling Forecast.




