
Seats · East Midlands · old boundaries (ENG-2010)
Newark
Newark as it was drawn from 2010 to 2024: the results of the 6 elections fought on these boundaries, and the seats that replaced it.
Results
2019 general election
Con hold · turnout 72.2% · majority 21,816
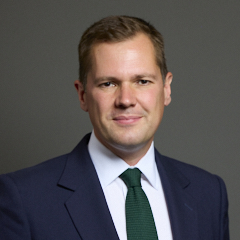 Robert Jenrick Con · MP
63.3%
James Baggaley Lab
23.5%
David Watts LD
9.7%
Jay Henderson Green
3.6%
2017 general election
Con hold · turnout 72.9% · majority 18,149
Robert Jenrick Con · MP62.7%
Chantal Lee Lab
29.7%
David Watts LD
5.1%
Xandra Arundel UKIP
2.6%
2015 general election
Con hold · turnout 70.9% · majority 18,474
Robert Jenrick Con · MP57.0%
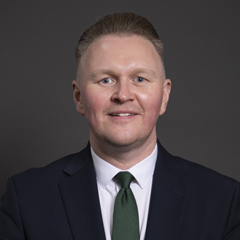 Michael Payne Lab
21.7%
Brian Mapletoft UKIP
12.0%
David Dobbie LD
4.6%
Elayne Forster Green
3.4%
Helen Tyrer Cnsn
1.2%
By-election, 5 June 2014
Con hold · turnout 52.7% · majority 7,403
Robert Jenrick Con45.0%
Roger Helmer UKIP
25.9%
Michael Payne Lab17.7%
Paul Baggaley
4.9%
David Kirwan Green
2.7%
Dave Watts LD
2.6%
Nick The Flying Brick Delves MRLP
0.4%
Andy Hayes
0.3%
David Bishop Elvis
0.2%
Dick Rodgers CG
0.2%
Lee Woods PSP
0.0%
2010 general election
Con hold · turnout 71.4% · majority 16,152
Patrick Mercer Con · MP
53.9%
Ian Campbell Lab
22.3%
Pauline Jenkins LD
20.0%
Tom Irvine UKIP
3.8%
2005 general election (notional result on these boundaries)
· turnout 63.3% · majority 10,077
Conservative
50.5%
Labour
28.3%
Liberal Democrat
18.4%
UK Independence Party
2.8%
Boundary changes
| Seat | Boundaries | Share of population |
|---|---|---|
| Newark | ENG-2024 (successor) | 94% of this seat's people |
| Sherwood Forest | ENG-2024 (successor) | 6% of this seat's people |
Figures as of . Published by Polling Forecast.




