
Seats · London · old boundaries (ENG-2010)
Ilford North
Ilford North as it was drawn from 2010 to 2024: the results of the 5 elections fought on these boundaries, and the seats that replaced it.
Results
2019 general election
Lab hold · turnout 68.7% · majority 5,218
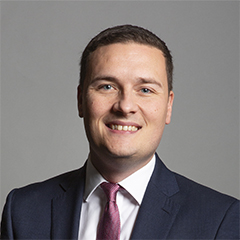 Wes Streeting Lab · MP
50.5%
Howard Berlin Con
40.1%
Mark Johnson LD
5.3%
Neil Anderson BRX
1.9%
David Reynolds Green
1.7%
Donald Akhigbe CPA
0.4%
2017 general election
Lab hold · turnout 72.5% · majority 9,639
Wes Streeting Lab · MP57.8%
Lee Scott Con
39.6%
Richard Clare LD
2.0%
Doris Osen
0.7%
2015 general election
Lab gain from Con · turnout 65.0% · majority 589
Wes Streeting Lab43.9%
Lee Scott Con · MP
42.7%
Philip Hyde UKIP
8.9%
Richard Clare LD
2.3%
David Reynolds Green
2.1%
Doris Osen
0.2%
2010 general election
Con hold · turnout 65.0% · majority 5,404
Lee Scott Con · MP
45.7%
Sonia Klein Lab
34.2%
Alex Berhanu LD
12.7%
Danny Warville BNP
3.3%
Henri van der Stighelen UKIP
1.9%
Caroline Allen Green
1.2%
Robert Hampson CPA
1.0%
2005 general election (notional result on these boundaries)
· turnout 61.1% · majority 1,735
Conservative
43.8%
Labour
39.6%
Liberal Democrat
13.8%
UK Independence Party
2.1%
0.7%
Boundary changes
| Seat | Boundaries | Share of population |
|---|---|---|
| Ilford North | ENG-2024 (successor) | 79% of this seat's people |
| Chingford and Woodford Green | ENG-2024 (successor) | 16% of this seat's people |
| Leyton and Wanstead | ENG-2024 (successor) | 5% of this seat's people |
Figures as of . Published by Polling Forecast.




