
Seats · North West · old boundaries (ENG-2010)
Heywood and Middleton
Heywood and Middleton as it was drawn from 2010 to 2024: the results of the 6 elections fought on these boundaries, and the seats that replaced it.
Results
2019 general election
Con gain from Lab · turnout 59.2% · majority 663
Chris Clarkson Con
43.1%
Liz McInnes Lab · MP
41.7%
Colin Lambert BRX
8.3%
Anthony Smith LD
4.4%
Nigel Ainsworth-Barnes Green
2.6%
2017 general election
Lab hold · turnout 62.4% · majority 7,617
Liz McInnes Lab · MP
53.3%
Chris Clarkson Con
38.0%
Lee Seville UKIP
6.5%
Bill Winlow LD
2.2%
2015 general election
Lab hold · turnout 60.7% · majority 5,299
Liz McInnes Lab · MP
43.1%
John Bickley UKIP
32.2%
Iain Gartside Con
19.1%
Anthony Smith LD
3.3%
Abi Jackson Green
2.3%
By-election, 9 October 2014
Lab hold · turnout 36.0% · majority 617
Liz McInnes Lab
40.9%
John Bickley UKIP
38.7%
Iain Gartside Con
12.3%
Anthony Smith LD
5.1%
Abi Jackson Green
3.1%
2010 general election
Lab hold · turnout 57.5% · majority 5,971
Jim Dobbin Lab · MP
40.1%
Mike Holly Con
27.2%
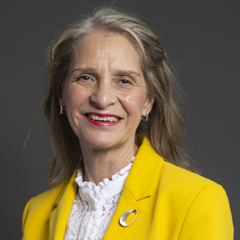 Wera Hobhouse LD
22.7%
Peter Greenwood BNP
7.0%
Victoria Cecil UKIP
2.6%
Chrissy Lee
0.4%
2005 general election (notional result on these boundaries)
· turnout 53.9% · majority 11,034
Labour
48.3%
Conservative
21.7%
Liberal Democrat
20.2%
British National Party
4.5%
3.3%
UK Independence Party
1.9%
Boundary changes
| Seat | Boundaries | Share of population |
|---|---|---|
| Heywood and Middleton North | ENG-2024 (successor) | 81% of this seat's people |
| Blackley and Middleton South | ENG-2024 (successor) | 19% of this seat's people |
Figures as of . Published by Polling Forecast.




