
Seats · London · old boundaries (ENG-2010)
Greenwich and Woolwich
Greenwich and Woolwich as it was drawn from 2010 to 2024: the results of the 5 elections fought on these boundaries, and the seats that replaced it.
Results
2019 general election
Lab hold · turnout 66.4% · majority 18,464
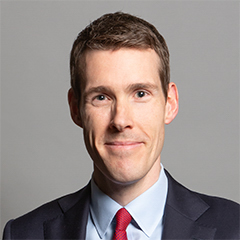 Matthew Pennycook Lab · MP
56.8%
Thomas Turrell Con
22.1%
Rhian O'Connor LD
13.7%
Victoria Rance Green
4.4%
Kailash Trivedi BRX
2.3%
Eunice Odesanmi CPA
0.5%
Sushil Gaikwad
0.2%
2017 general election
Lab hold · turnout 68.8% · majority 20,714
Matthew Pennycook Lab · MP64.4%
Caroline Attfield Con
25.4%
Chris Adams LD
7.1%
Daniel Garrun Green
3.0%
2015 general election
Lab hold · turnout 63.7% · majority 11,946
Matthew Pennycook Lab52.2%
Matt Hartley Con
26.6%
Ryan Acty UKIP
8.3%
Abbey Akinoshun Green
6.4%
Tom Holder LD
5.7%
Lynne Chamberlain TUSC
0.8%
2010 general election
Lab hold · turnout 62.9% · majority 10,153
Nick Raynsford Lab · MP
49.2%
Spencer Drury Con
24.5%
Joseph Lee LD
18.2%
Lawrence Rustem BNP
2.8%
Andy Hewett Green
2.6%
Edward Adeleye CHP
1.1%
Raden Wresniwiro ED
0.8%
Onay Kasab TUSC
0.6%
Tammy Alingham
0.2%
2005 general election (notional result on these boundaries)
· turnout 53.2% · majority 11,638
Labour
52.5%
Liberal Democrat
19.7%
Conservative
17.6%
Green Party
4.4%
3.6%
UK Independence Party
2.2%
Boundary changes
| Seat | Boundaries | Share of population |
|---|---|---|
| Greenwich and Woolwich | ENG-2024 (successor) | 87% of this seat's people |
| Erith and Thamesmead | ENG-2024 (successor) | 13% of this seat's people |
Figures as of . Published by Polling Forecast.




