
Seats · South East · old boundaries (ENG-2010)
Fareham
Fareham as it was drawn from 2010 to 2024: the results of the 5 elections fought on these boundaries, and the seats that replaced it.
Results
2019 general election
Con hold · turnout 73.1% · majority 26,086
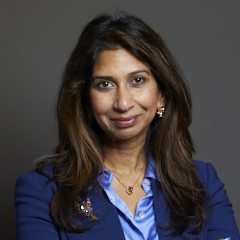 Suella Braverman Con · MP
63.7%
Matthew Randall Lab
18.1%
Matthew Winnington LD
14.0%
Nick Lyle Green
4.2%
2017 general election
Con hold · turnout 72.3% · majority 21,555
Suella Fernandes Con · MP
63.0%
Matthew Randall Lab
25.2%
Matthew Winnington LD
6.8%
Tony Blewett UKIP
2.7%
Miles Grindey Green
2.3%
2015 general election
Con hold · turnout 70.9% · majority 22,262
Suella Fernandes Con
56.1%
Malcolm Jones UKIP
15.4%
Stuart Rose Lab
14.3%
Matthew Winnington LD
8.8%
Miles Grindey Green
3.9%
Nick Gregory
1.3%
Harvey Hines
0.2%
2010 general election
Con hold · turnout 71.6% · majority 17,092
Mark Hoban Con · MP
55.3%
Alex Bentley LD
23.8%
Jim Carr Lab
14.2%
Steve Richards UKIP
4.1%
Peter Doggett Green
1.5%
Joe Jenkins ED
1.1%
2005 general election (notional result on these boundaries)
· turnout 66.9% · majority 11,702
Conservative
49.7%
Labour
25.6%
Liberal Democrat
21.7%
UK Independence Party
2.9%
Boundary changes
| Seat | Boundaries | Share of population |
|---|---|---|
| Fareham and Waterlooville | ENG-2024 (successor) | 54% of this seat's people |
| Hamble Valley | ENG-2024 (successor) | 46% of this seat's people |
Figures as of . Published by Polling Forecast.




