
Seats · London · old boundaries (ENG-2010)
Dulwich and West Norwood
Dulwich and West Norwood as it was drawn from 2010 to 2024: the results of the 5 elections fought on these boundaries, and the seats that replaced it.
Results
2019 general election
Lab hold · turnout 69.4% · majority 27,310
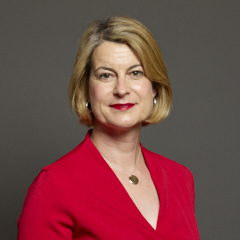 Helen Hayes Lab · MP
65.5%
Jonathan Bartley Green
16.5%
Jane Lyons Con
16.4%
Julia Stephenson BRX
1.0%
Anthony Hodgson CPA
0.4%
John Plume UKIP
0.1%
2017 general election
Lab hold · turnout 71.9% · majority 28,156
Helen Hayes Lab · MP69.6%
Rachel Wolf Con
19.5%
Gail Kent LD
8.0%
Rashid Nix Green
2.5%
Robin Lambert
0.2%
Yen Chong
0.2%
2015 general election
Lab hold · turnout 67.1% · majority 16,122
Helen Hayes Lab54.1%
Resham Kotecha Con
22.7%
James Barber LD
9.8%
Rashid Nix Green
9.4%
Rathy Alagaratnam UKIP
3.1%
Steve Nally TUSC
0.5%
Robin Lambert
0.2%
Amadu Kanumansa APPL
0.1%
2010 general election
Lab hold · turnout 66.2% · majority 9,365
Tessa Jowell Lab · MP
46.6%
Jonathan Mitchell LD
27.2%
Kemi Adegoke Con
22.2%
Shane Collins Green
2.6%
Elizabeth Jones UKIP
1.5%
2005 general election (notional result on these boundaries)
· turnout 56.9% · majority 7,853
Labour
44.2%
Conservative
24.5%
Liberal Democrat
23.1%
Green Party
6.3%
1.1%
UK Independence Party
0.7%
Boundary changes
| Seat | Boundaries | Share of population |
|---|---|---|
| Dulwich and West Norwood | ENG-2024 (successor) | 85% of this seat's people |
| Lewisham West and East Dulwich | ENG-2024 (successor) | 15% of this seat's people |
| Streatham and Croydon North | ENG-2024 (successor) | 0% of this seat's people |
Figures as of . Published by Polling Forecast.




