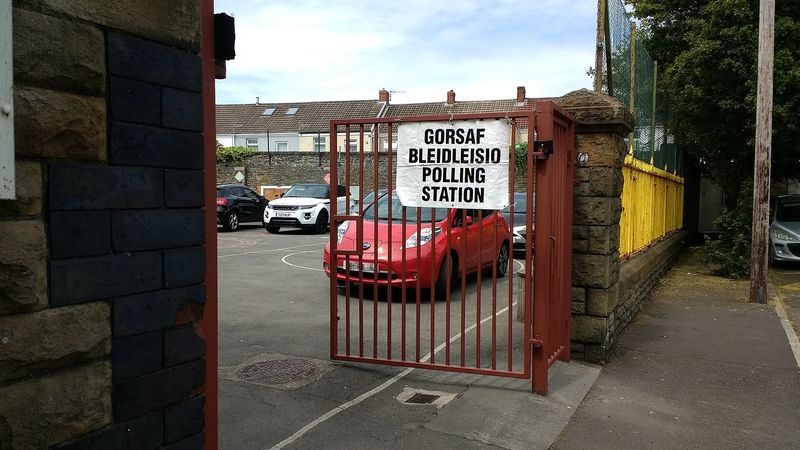
Scotland and Wales: sparse polls and no steady lean
Abstract. Scotland-only and Wales-only final polls have missed by roughly as much as England's since 2015, but not in the same direction from one election to the next. Correcting them by their own average past miss made them worse when each election was predicted from the others, so our projection leaves Scotland and Wales as polled, and their own error records are used only for the scenario lenses, the SNP and Plaid Cymru ranges and the simulation.
What has changed since this paper was written
Updated 9 November 2026. The rest of the paper is as first published, except where a sentence below says it was corrected.
- Holyrood and the Senedd (3 October). The next Scottish Parliament and Senedd elections have their own nowcasts at /uk/holyrood and /uk/senedd, built apart from the Westminster model described here.
- Pollster grades rescaled (13 October) (Rating the British pollsters: accuracy, the Labour–Conservative lead and openness).
Why the nations need their own treatment
The core of our method is built on England. England is where polling error can be measured most cleanly, because removing Scotland and Wales removes the SNP and Plaid Cymru, whose support is concentrated in a small part of the Great Britain sample; and England holds 543 of the 632 seats in Great Britain (see Measuring British polling error in England, 2015–2024). But the site forecasts the whole of Great Britain, and the other 89 seats (57 in Scotland, 32 in Wales) are not a rounding error. In 2024 they decided the size of Labour's majority as much as any region of England did, and the SNP's collapse from 48 seats to 9 was one of the largest single movements of the night.
Scotland and Wales differ from England in two ways that matter for a forecaster. Their party systems are different: in Scotland the main contest has been between the SNP and Labour, and in Wales Plaid Cymru and, increasingly, Reform UK compete with Labour and the Conservatives. And they are polled far less. A pollster that publishes a GB poll every week may publish a Scotland-only Westminster poll a few times a year and a Wales-only one rarely, if at all.
This paper describes how we measured the accuracy of Scottish and Welsh polls at the last four general elections, what we found, the test that decided how the forecast uses those findings, and how the two nations enter the averages, the lenses and the simulation. The short version is that the nations' polls have not been more accurate than England's, but their errors have not repeated from one election to the next, so we do not try to correct them.
The data
Nation polls, not subsamples
The benchmark is each nation's own polls: Scotland-only and Wales-only Westminster voting-intention polls, one per pollster, being each pollster's final such poll before polling day, with every figure taken from the pollster's own tables. Database script 11 stores them in poll.NationPoll and poll.NationPollShare, each with its source file and table reference. The nations' actual results come from our constituency results, summed by nation (web.vw_NationResult), and match the published nation totals. Error is defined as in the England work: poll minus result, per party, in percentage points, so a positive error means the poll overstated the party. UKIP, the Brexit Party and Reform UK are treated as one family, as elsewhere on the site.
The sample is small. Scotland has 15 benchmark polls: three each in 2015, 2017 and 2019, and six in 2024. Wales has four, all from YouGov, one per election. That is not a design choice. It is how much Scotland-only and Wales-only Westminster polling was published close to recent elections and could be reached in its original form.
What was left out, and why
Three kinds of exclusion shape the dataset.
The first is polls we could not reach. Several final polls exist but could not be retrieved from the pollster's own tables during the research, and under our evidence rules they are not loaded from secondary transcriptions. In Scotland these are Panelbase in 2015, 2017 and 2019, TNS BMRB in 2015, BMG in 2017, and Norstat and Redfield & Wilton in 2024 (Norstat's site disallows all automated access in its robots.txt file, which we respect). In Wales they are ICM in 2015 and More in Common, Redfield & Wilton and Savanta in 2024. All are listed for retrieval by hand in a browser. Adding them would roughly double the Welsh sample and add about half again to the Scottish one.
The second is a Welsh poll that was a model rather than a survey. YouGov's last Wales Westminster figure in 2024 came from its MRP model. The benchmark uses its last conventional Wales poll instead, the "first call" with fieldwork from 30 May to 3 June 2024, a month before polling day. This matters for interpretation, as section 3 explains.
The third concerns YouGov in 2015. YouGov's 2015 final-call document prints Scotland and Wales columns alongside its GB figures, but those columns are its separate Scotland and Wales polls, not subsamples of the GB poll. They are loaded once, as nation polls, and not a second time as subsamples, so that the same respondents are not counted twice.
One further judgement: for Survation's 2015 Scotland poll, the standard voting-intention question is used (SNP 48.9, Labour 24.8, Conservative 15.5). Survation also asked a version prompting constituency candidates, with slightly different figures. Which version the commissioning newspaper printed is still to be checked.
GB subsamples, kept apart
Every GB poll has a Scotland column and usually a Wales column. They are tempting to use, since there are many of them, but they are small (weighted bases of roughly 45 to 350 people in the final polls we hold) and they are not designed to represent the nation: GB polls are generally weighted to GB targets, so a Scottish subsample's age, past vote and other characteristics are right only on average across the whole sample. We stored the Scotland and Wales columns of the final GB polls (20 for Scotland and 18 for Wales across the four elections) with the flag InPrimary = 0, so that they can be compared with the nation polls but never enter the benchmark. For a few polls with no printed Wales column, Wales was derived as GB minus England minus Scotland; those rows are marked as such.
The comparison is clear. Averaging the absolute error over each nation's main parties (SNP, Labour, Conservative and Lib Dem in Scotland; Labour, Conservative, Plaid Cymru, Lib Dem and Reform in Wales):
| Nation | Election | Nation polls | Miss | GB subsamples | Miss |
|---|---|---|---|---|---|
| Scotland | 2015 | 3 | 2.0 | 3 | 2.8 |
| Scotland | 2017 | 3 | 2.5 | 5 | 4.7 |
| Scotland | 2019 | 3 | 2.0 | 6 | 3.5 |
| Scotland | 2024 | 6 | 1.9 | 6 | 4.5 |
| Wales | 2015 | 1 | 1.7 | 2 | 3.1 |
| Wales | 2017 | 1 | 1.7 | 4 | 6.2 |
| Wales | 2019 | 1 | 0.5 | 6 | 4.6 |
| Wales | 2024 | 1 | 3.3 | 6 | 4.5 |
Table: Mean absolute error per main party, nation-only final polls against the nation columns of final GB polls, points.
The subsamples missed by roughly twice as much in Scotland and by more still in Wales. That is what sampling theory would lead one to expect from samples a fifth or a tenth the size, made less efficient by weights designed for another population (Kish, 1965). It is the reason the forecast does not use GB subsamples for Scotland and Wales at all.1
How far the nations' polls missed
The live table below gives, for each nation and election, the average error per party across that nation's benchmark polls, followed by the result of the leave-one-out test described in section 4.
| Nation | Election | Polls | Error by party |
|---|---|---|---|
| Scotland | 2015 | 3 | SNP +0.3, Lab 0.0, Con +0.6, LD −1.6, Green +0.5, Reform −0.3 |
| Scotland | 2017 | 3 | SNP +4.1, Lab −0.9, Con −2.9, LD −1.2, Green +0.8, Reform −0.2 |
| Scotland | 2019 | 3 | SNP −1.3, Lab −1.6, Con +2.2, LD +0.6, Green +0.2, Reform −0.4 |
| Scotland | 2024 | 6 | SNP +2.4, Lab −0.5, Con +1.0, LD −1.6, Green −0.6, Reform −0.7 |
| Scotland | Leave-one-out | as polled 2.10, corrected 2.25 (mean abs. error) | |
| Wales | 2015 | 1 | Lab +2.1, Con −2.2, Plaid +0.9, LD +1.5, Reform −1.6, Green −0.6 |
| Wales | 2017 | 1 | Lab −3.0, Con +0.4, Plaid −1.4, LD +0.5, Reform +3.0, Green −0.3 |
| Wales | 2019 | 1 | Lab −0.9, Con +0.9, Plaid +0.1, LD 0.0, Reform −0.4, Green 0.0 |
| Wales | 2024 | 1 | Lab +8.0, Con −0.2, Plaid −2.8, LD −1.5, Reform −4.0, Green −0.7 |
| Wales | Leave-one-out | as polled 1.77, corrected 2.31 (mean abs. error) |
Scotland
Scotland's polls have missed by about two points per main party at every election, which is close to the England figure for published polls. What stands out is the absence of a direction. The SNP was overstated in 2017 and 2024 but understated in 2019, and was close in 2015. The Conservatives were understated in 2017 and overstated in 2019 and, more mildly, in 2024. Labour's average error has been small and mostly negative. The one regularity is that the Liberal Democrats were understated in three of the four elections, typically by one to two points, which may reflect their concentrated support in a handful of seats that a national sample finds hard to capture.
Within each election the pollsters also disagreed with each other by more than their average missed. In 2024 the six Scottish polls ranged from understating the SNP by about one point to overstating it by six; in 2015 they ranged from about two points under to four points over. An average error of two points built from polls that disagree this much is a weak basis for any correction, since most of the variation is between pollsters rather than common to all of them.
Wales
Wales has one poll per election, so each row of the table is a single poll's error rather than an average. The polls did well in 2019 (an average miss of 0.5), reasonably in 2015 and 2017, and badly in 2024, when Labour was overstated by eight points and Reform understated by four. The 2024 poll, however, was taken a month before polling day, before most of the campaign, and Labour's polling share fell over the campaign across Britain. Part of that eight-point error is therefore movement of opinion, not error in measurement, and with one poll there is no way to separate the two. In 2017, by contrast, Labour was understated by three points in a Welsh poll taken on the eve of polling day, so that miss cannot be put down to timing.
The test: does correcting the nations' polls help?
Method
For England, our projection corrects each pollster's raw answers by half of the average past miss, and that choice was made because it beat the pollsters' published figures when tested out of sample (see Correcting the raw answers: the method behind our UK projection). The natural question is whether the same kind of correction helps in Scotland and Wales. The test is the same leave-one-out design (Stone, 1974). For each nation \(n\) and each election \(t\), the correction for party \(p\) is the average of that party's per-election mean error at the other three elections,
where \(\bar{e}_{n,p,s}\) is the average error of nation \(n\)'s benchmark polls for party \(p\) at election \(s\). Each benchmark poll \(i\) at election \(t\) is then corrected, \(e'_{i,p} = e_{i,p} - c_{n,p}^{(-t)}\), and its mean absolute error over the nation's main parties is compared with that of the poll as published. A party that a poll did not print is left out of that poll's average. The test applies the full average past miss, not half; it is the simplest version, and the one the "average error" lens uses.
Result
The correction made things worse in both nations. In Scotland the average miss rose from 2.10 points as polled to 2.25 corrected; in Wales from 1.77 to 2.31. These figures are in the last row for each nation in the table above. Year by year, the corrected Scottish polls were worse in 2015 and 2019 and slightly better in 2017 and 2024; the corrected Welsh poll was worse at all four elections. The reason is visible in the error table: when the SNP is overstated at two elections and understated at a third, the average of any three is a poor guess at the fourth, and subtracting it moves the poll away from the result about as often as towards it.
For England the published headlines tell a similar story (correcting them by their past miss did not beat them), and the correction that works there starts from the pollsters' raw answers before their own adjustments, whose errors are steadier. That route is not open for Scotland and Wales, because we do not hold the raw-stage tables of the historical nation polls. We have not tested a partial correction (a half or a quarter of the past miss) for the nations. Given that the full correction was worse in Wales at every election, and in Scotland at two of four, a smaller one would at best be a smaller loss.2
What follows for the forecast
The decision follows the rule set at the start of the project: a correction is adopted only if it improves consistently out of sample. This one does not, so:
- Our projection (the headline) and the pollster-record lens leave Scotland and Wales as polled. Their corrections are measured in England, and there is no evidence that carrying them across the border would help.
- The average-error lens and the "as wrong as in 20XX" lenses use each nation's own error there, including for the SNP and Plaid Cymru. These lenses are scenarios, not predictions: they answer "what if the polls miss the way they did before?", and for Scotland the honest answer to that question uses Scotland's record, not England's.
- The what-if tool and the "best for X" pollster lenses apply their shifts to the GB-wide parties in all three nations. These are adjustments the reader or the pollster choice implies for Britain as a whole, and the SNP and Plaid Cymru are left untouched by them.
See Lenses: reading the same British polls several ways for the full set of lenses and how each treats the three nations.
The nation averages
Latest poll per pollster within 120 days
Scotland and Wales are averaged by the same rule as England and Great Britain: the latest qualifying poll from each pollster, equally weighted, with Others set to 100 minus the named parties and Restore Britain averaged only over the polls that prompt it. The difference is the window. England and Great Britain use polls whose fieldwork ended in the last 28 days; Scotland and Wales use 120 days, because a 28-day window would often contain no Scottish poll and almost never a Welsh one. The cost is staleness: a Welsh average may rest on a poll three months old, and it will not register a movement that GB polls pick up within a week. We accept that trade because the alternative, a four-week window, would leave the nations without an average most of the time.
The sources are the Scotland-only and Wales-only Westminster polls in our regional-poll store, indexed from a public list of polls and checked against the pollster's tables where those could be reached. As the code stands, the average takes every stored poll for the nation within the window, including polls not yet checked against the pollster's tables. The decisions log treats unchecked polls as suitable for sensitivity analysis only, so this is a gap between our rules and the code, which we record here rather than hide. The Alba Party is counted in Others. GB polls' Scotland and Wales columns are not used, for the reasons given in section 2.
Fallback: the 2024 result moved by the GB change
If a nation has no poll at all in the last 120 days, the site does not leave it empty. It takes the nation's 2024 result and adds, for each party, the change in that party's GB share since 2024:
then rescales to 100. Here \(y_{\mathrm{GB},p}\) is the party's current GB polling average and \(v_{\mathrm{GB},p}^{2024}\) its 2024 GB share, built from the three nations' results weighted by their valid votes. This is uniform swing applied at nation level (Butler and Stokes, 1969), and it is crude: it assumes, for example, that Labour has lost as many points in Scotland as in Britain as a whole, which need not be so. The forecast page states when a nation is being estimated this way rather than from its own polls.
From nations to Great Britain
The GB figures shown on the site are the three nations combined, each weighted by its share of the 2024 GB valid vote. They are checked against the GB polls rather than taken from them. Because Scotland and Wales together are only about an eighth of the GB vote, even a large difference in the nation averages moves the GB shares by little; it is in the seat counts, especially the SNP's, that the nation averages matter.
Uncertainty and the simulation
Ranges for the SNP and Plaid Cymru
On the forecast pages each party's 80% vote band comes from its root-mean-square error at past elections. For the GB-wide parties that is England's record. For the SNP and Plaid Cymru it is their own nation's record: the root mean square of the party's per-election average error in Scotland or Wales, 2015–2024, multiplied by 1.2816 (the 90th percentile of the standard normal). Before the nation errors were measured, the SNP and Plaid had no measured error at all and were left untouched in every lens and every simulated run, which understated the uncertainty in their seat counts.
Same-year patterns
The simulation (see Simulating UK polling error: where the chances come from) runs 1,000 elections. In each run it picks one past election's England error pattern at random, multiplies it by a factor \(z^{(r)}\) drawn from a standard normal distribution, adds independent national noise to each party, and applies the result. Scotland and Wales are tied to that draw. If run \(r\) replays election \(t_r\), then Scotland's error for party \(p\) is Scotland's own average error at the same election, scaled by the same factor, plus the same national noise as England:
where \(\eta^{(r)}_p \sim \mathcal{N}(0, 1)\) (a standard deviation of one point) is the national noise for party \(p\) in that run, shared with England for the GB-wide parties and drawn fresh for the SNP and Plaid Cymru, which have no England counterpart. The simulated share is the projected share minus this error, rescaled to 100, before seats are re-projected.
The design has two purposes. Using the same year keeps whatever joint structure the errors had: 2017, for instance, was a year when England's polls understated Labour and Scotland's overstated the SNP, and a simulated 2017 reproduces both. And using each nation's own pattern means that a bad year for the polls is bad everywhere, but each nation misses in its own way, rather than Scotland simply inheriting England's error on parties whose competitive position there is quite different. Where a nation has no measured error for a year, the England pattern is used instead; at present all four years are measured in both nations.
Equation (1) scales the nation pattern by a symmetric random factor, so the simulation does not assume the SNP will be overstated. It assumes only that it could be missed by about as much, in either direction, as it has been.
Limitations
The evidence is thin. Fifteen Scottish polls and four Welsh ones, spread over four elections, is enough to show that the polls have not leaned consistently, but not enough to show that they will not. In Wales in particular each election's error is one pollster's poll, so "Wales's error in 2024" is really "YouGov's Wales error in 2024, a month out". A single house effect and the country's polling error cannot be separated.
The Welsh 2024 poll's timing mixes measurement error with campaign movement. This inflates Wales's apparent error and, through the replay lens and the simulation, the width of its scenarios. Recovering the other 2024 Welsh polls, which were taken closer to polling day, would help more than any modelling change.
The missing polls are not missing at random. Panelbase's three Scottish final polls and the four Welsh polls we could not reach are exactly the ones that would tell us whether our pollster mix is representative. Until they are retrieved, the nation benchmarks lean heavily on YouGov, Ipsos and Survation.
Today's nation averages rest on few polls, some of them old, and (as noted above) not all checked against the pollster's tables. When no poll is available, the fallback assumes uniform change from 2024, which Scotland's recent history, with large swings between the SNP and Labour, gives little reason to trust.
Finally, the correction was tested only in its full form and only on published figures. A method built on the nations' raw answers, as ours is for England, might behave differently, but we do not have the historical raw tables to test it.
Conclusion
Scottish and Welsh Westminster polls have missed by about as much as England's, around two points per main party, but in no steady direction: the SNP has been overstated twice and understated once, Scotland's Conservatives understated once and overstated, mostly mildly, at the other three, and Wales's single poll per election has swung from very good to poor. Correcting the polls by their own past miss made them worse out of sample in both nations, so the forecast leaves them as polled in our projection and uses their records only where a record is what is wanted: in the scenario lenses, in the ranges for the SNP and Plaid Cymru, and in a simulation that replays each nation's own error from the same election year. The larger gains for Scotland and Wales lie in data rather than method: more of the missing final polls, and a steadier supply of current ones.
References
Butler, D. and Stokes, D. (1969). Political Change in Britain. London: Macmillan.
Efron, B. and Morris, C. (1975). Data analysis using Stein's estimator and its generalizations. Journal of the American Statistical Association, 70(350), 311–319.
Kish, L. (1965). Survey Sampling. New York: Wiley.
Stone, M. (1974). Cross-validatory choice and assessment of statistical predictions. Journal of the Royal Statistical Society: Series B, 36(2), 111–147.
-
The early project plan envisaged using each GB poll's non-English remainder (GB minus England) as an extra source for Scotland and Wales. The comparison above is why that was not built: the nation averages use nation-only polls, with the fallback described in section 5 when there are none.↩
-
Shrinking a noisy estimate towards zero is the idea behind Stein-type estimators (Efron and Morris, 1975), and it is what the half correction in England does. It helps when the quantity being estimated is stable and the estimate of it is noisy. In Scotland and Wales the difficulty is that the errors themselves change sign between elections, so there is little stable quantity to estimate.↩
How to cite
Polling Forecast (2026). Scotland and Wales: sparse polls and no steady lean. Retrieved 20 November 2026 from https://www.pollingforecast.com/research/uk-scotland-and-wales. Live figures change as new polls arrive; the date above is when the text was last revised.