Reading Dutch polls: the correction and its test
Abstract. The core methods paper for the Netherlands. Taking off half the average past miss, with each election predicted from the others, was closer on average at the seven Tweede Kamer elections since 2006, by a small margin, so Dutch polls are corrected. The gain comes from PRO and the SP, overstated at almost every election; the PVV and the VVD, whose misses change sign, are made slightly worse. We set out what the correction does to today's polls, why there is no raw-figure test and the seat count that reproduces 2021 to 2025.
Summary
This paper sets out how Polling Forecast reads Dutch opinion polls for the next Tweede Kamer election, and why it corrects them. Final polls at the seven elections since 2006 missed by about a point per party, and some parties were missed the same way time after time: PRO's predecessors, GroenLinks and the PvdA, and the SP were overstated at six of the seven. Taking off half the average past miss, with each election predicted from the others, was closer on average, by a small margin, so the correction is on. The seats then follow from the Kieswet, which our count reproduces exactly for 2021, 2023 and 2025.
What has changed since this paper was written
Updated 9 November 2026. The rest of the paper is as first published, except where a sentence below says it was corrected.
- Only elections from 2000 shape the forecast (28 September). Earlier elections stay in the long view and on the history pages but no longer feed any test, correction or error size. In the Netherlands the gemeente swing is now tested on the eight pairs of elections from 2002; proportional swing was closer at all eight, so it stays.
- Our figures beside the polls (26 October). Our projection differs from the poll average in the Netherlands, so both are shown on the hub, the leader cards and the polls page.
The electoral system
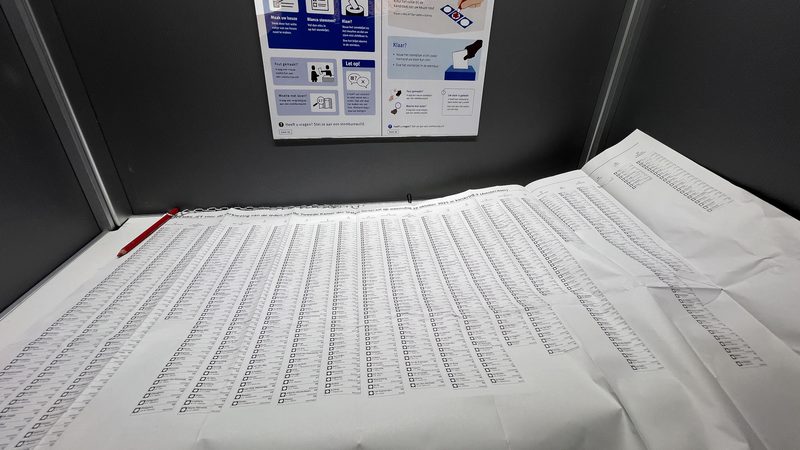
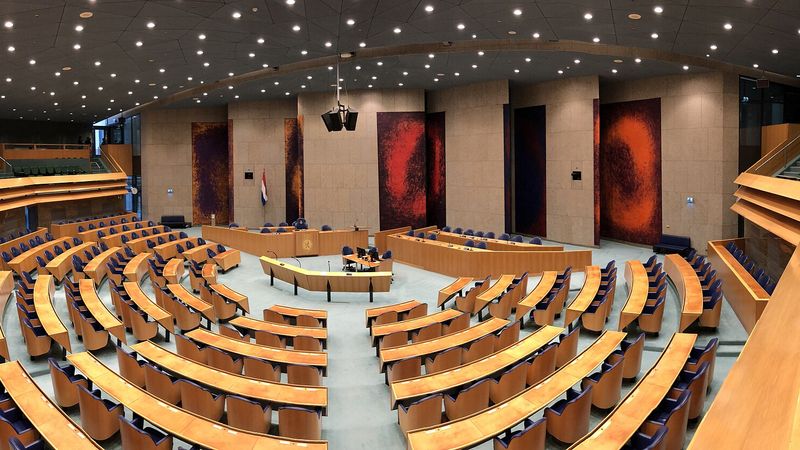
The Tweede Kamer has 150 seats, elected in one national count. Voters choose a candidate on a party list; the vote counts first for the list. The seats are shared under chapter P of the Kieswet:
- The kiesdeler. The valid vote divided by 150: in 2025, 10,571,990 votes, so a kiesdeler of 70,480 votes, about 0.67% of the vote.
- Full seats. Each list gets one seat for every full kiesdeler.
- Remainder seats. The seats left over go one at a time to the list with the highest average, its votes divided by its seats so far plus one. Only lists with at least one full kiesdeler take part.
A majority is 76. List combinations, which let lists pool their remainders, were abolished for elections from 2021. From votes to seats: the Kieswet gives the details.
The data
Results come from the Kiesraad under CC0: national results for every election since 1946, results by gemeente since 2012. Polls come from the pollsters' own reports where we could read them (Ipsos I&O's and Verian's PDFs, Peil.nl's open posts) and otherwise from Wikipedia's poll tables, graded C and marked on the site. The Dutch data: results, maps, statistics, members and polls gives every source.
The seat calculation
Our implementation of the law, given the Kiesraad's official votes, reproduces the official seats for every party at all three elections since list combinations were abolished:
| Election | Kiesdeler (votes) | Full seats | Remainder seats | Lists with seats | Every seat matches |
|---|---|---|---|---|---|
| 2021 | 69,485.68 | 139 | 11 | 17 | yes |
| 2023 | 69,551.51 | 140 | 10 | 15 | yes |
| 2025 | 70,479.93 | 139 | 11 | 15 | yes |
How far Dutch polls have missed
Final-poll average minus result, in points, party by party:
| Party | 2002 | 2006 | 2010 | 2012 | 2017 | 2021 | 2023 | 2025 | Average |
|---|---|---|---|---|---|---|---|---|---|
| CDA | −5.9 | +0.4 | +2.4 | −0.3 | +1.2 | +1.3 | −0.2 | +1.0 | 0.0 |
| CU | +1.1 | +0.6 | +0.8 | +0.4 | +0.5 | +0.6 | +0.4 | −0.1 | +0.5 |
| D66 | +0.6 | −0.4 | −0.3 | −0.5 | −0.6 | −2.9 | 0.0 | −1.6 | −0.7 |
| PRO (GL + PvdA) | +3.9 | +1.8 | +1.0 | −0.9 | +3.3 | +2.9 | +1.4 | +2.6 | +2.0 |
| SGP | −0.4 | 0.0 | +0.3 | −0.5 | −0.2 | 0.0 | −0.3 | −0.1 | −0.2 |
| SP | −0.6 | +0.5 | −0.5 | +4.1 | +1.1 | +1.4 | +0.4 | +1.1 | +0.9 |
| VVD | +1.2 | −0.2 | +1.5 | −2.6 | −3.9 | +0.5 | +2.5 | −2.3 | −0.4 |
| PvdD | – | −0.5 | 0.0 | −0.2 | −0.1 | 0.0 | +0.9 | 0.0 | 0.0 |
| PVV | – | −2.4 | −4.1 | +1.5 | +1.4 | +2.1 | −5.4 | −0.4 | −1.1 |
| 50PLUS | – | – | – | −0.1 | +0.3 | −0.6 | −0.2 | +0.3 | −0.1 |
| BBB | – | – | – | – | – | −0.3 | −0.9 | +0.1 | −0.4 |
| DENK | – | – | – | – | – | −0.6 | +0.3 | +0.1 | −0.1 |
| FvD | – | – | – | – | – | −1.5 | +0.4 | −0.4 | −0.5 |
| JA21 | – | – | – | – | – | −0.9 | +0.2 | +0.4 | −0.1 |
| Volt | – | – | – | – | – | −0.4 | +0.6 | +0.4 | +0.2 |
| NSC | – | – | – | – | – | – | +0.1 | 0.0 | 0.0 |
The final polls are taken the day before the vote; there is no publication ban (Measuring Dutch polling error, 2006–2025). PRO (GroenLinks and the PvdA together before 2023) was overstated by 1.0 to 3.3 points at six of seven elections, and the SP by up to 4.1 points at six. The PVV was missed by the most, 5.4 points in 2023, but in both directions. So was the VVD.
The test
Each election was predicted with the correction learned from the other six: half the mean error, for parties measured at two or more of them, followed by a rescale so the shares keep the same total.
| Election | Polls' average miss | Corrected, leave one out | Verdict |
|---|---|---|---|
| 2002 | 1.96 | 2.10 | further out |
| 2006 | 0.75 | 0.53 | closer |
| 2010 | 1.21 | 1.18 | closer |
| 2012 | 1.11 | 1.18 | further out |
| 2017 | 1.26 | 1.16 | closer |
| 2021 | 1.08 | 1.08 | level |
| 2023 | 0.89 | 0.87 | closer |
| 2025 | 0.68 | 0.59 | closer |
| Average | 1.12 | 1.09 |
The correction was closer at 5 elections, level at 1 and further out at 2, and closer on average: 1.09 points per party against 1.12. That beats the uncorrected polls by more than the 0.01 points the rule asks for, so our Dutch projection uses the correction.
Party by party, the gain has a clear source. Summing, over the seven elections, how much closer each party's corrected figure was than its poll average (before the rescale), PRO gains the most, about 3.9 points in all, then the SP (1.9), D66 (1.5), the CU (1.1) and the CDA (0.8). The PVV (−1.2) and the VVD (−1.1) are made worse: their average miss is small next to their misses at single elections, so half the average moves them the wrong way about as often as the right way.
Election by election:
- 2006 and 2025: closer. Both years the centre-left was overstated and D66 understated, the pattern the correction learns.
- 2017 and 2021: closer. The centre-left was overstated by about three points in both.
- 2010: level. Ipsos's single final poll; the gains and losses cancel.
- 2012 and 2023: further out. In 2012 GroenLinks and the PvdA were understated, so taking points off them moved them the wrong way, and the VVD's miss of 2.6 points was larger than anything the correction adds. In 2023 the VVD was overstated by 2.5 points, and the correction learned from the other years, in which the VVD was more often understated, adds to it; D66, polled exactly, is moved too.
So the correction wins where the centre-left was overstated, which is most elections, and loses where the story was a single late mover. The code checks the rule each time the forecast is built: after the next election, if the correction no longer beat the polls on average, it would switch off without any change to the method.
What the correction does today
| Party | Elections | Average miss | Typical miss (RMS) | Taken off today |
|---|---|---|---|---|
| PRO (GL + PvdA) | 8 | +2.0 | 2.5 | −1.0 |
| PVV | 7 | −1.1 | 3.0 | +0.5 |
| SP | 8 | +0.9 | 1.7 | −0.5 |
| D66 | 8 | −0.7 | 1.2 | +0.4 |
| CU | 8 | +0.5 | 0.6 | −0.3 |
| FvD | 3 | −0.5 | 0.9 | +0.3 |
| VVD | 8 | −0.4 | 2.2 | +0.2 |
| BBB | 3 | −0.4 | 0.5 | +0.2 |
| Volt | 3 | +0.2 | 0.5 | −0.1 |
| SGP | 8 | −0.2 | 0.3 | +0.1 |
| DENK | 3 | −0.1 | 0.4 | 0.0 |
| JA21 | 3 | −0.1 | 0.6 | 0.0 |
| 50PLUS | 5 | −0.1 | 0.4 | 0.0 |
| NSC | 2 | 0.0 | 0.1 | 0.0 |
| PvdD | 7 | 0.0 | 0.4 | 0.0 |
| CDA | 8 | 0.0 | 2.4 | 0.0 |
PRO loses −1.0 points, half its average miss of +2.0. The SP loses about 0.6, the CDA 0.4; the PVV gains +0.5, D66 about 0.4 and the VVD 0.3. Parties with no record (the DNA) are not corrected and move only through the rescale. PRO's correction is measured on GroenLinks and the PvdA added together, and on their joint list in 2023 and 2025.
| Party | Polls | Our bet | Seats | 80% range | 2025 | Largest party | Wins a seat |
|---|---|---|---|---|---|---|---|
| PRO | 20.0 | 19.0 | 30 | 25–34 | 20 | 91% | over 99% |
| PVV | 13.4 | 13.9 | 21 | 16–27 | 26 | 9% | over 99% |
| JA21 | 11.7 | 11.8 | 18 | 16–20 | 9 | 0% | over 99% |
| D66 | 10.0 | 10.4 | 16 | 13–18 | 26 | 0% | over 99% |
| VVD | 9.0 | 9.2 | 14 | 10–18 | 22 | under 1% | over 99% |
| CDA | 8.7 | 8.7 | 13 | 9–18 | 18 | under 1% | over 99% |
| FvD | 7.3 | 7.6 | 11 | 10–13 | 7 | 0% | over 99% |
| 50PLUS | 3.3 | 3.3 | 5 | 4–6 | 2 | 0% | over 99% |
| PvdD | 3.0 | 3.0 | 4 | 3–5 | 3 | 0% | over 99% |
| SP | 3.3 | 2.8 | 4 | 1–7 | 3 | 0% | 91% |
| SGP | 2.7 | 2.8 | 4 | 3–5 | 3 | 0% | over 99% |
| Volt | 2.4 | 2.3 | 3 | 2–4 | 1 | 0% | over 99% |
| CU | 2.4 | 2.1 | 3 | 1–4 | 3 | 0% | 99% |
| DENK | 2.0 | 2.0 | 3 | 2–3 | 3 | 0% | over 99% |
| BBB | 1.0 | 1.2 | 1 | 0–2 | 4 | 0% | 83% |
In seats the correction moves a few seats from PRO and the SP to the PVV, D66 and the VVD. It rarely changes the largest party, because PRO's lead in the polls is larger than its correction, but it changes which combinations reach 76 (Coalitions: the largest party, the 76 line and who ruled out whom).
Raw figures
In Britain the forecast starts from what respondents say before the pollster's adjustments (Why we start from British pollsters' raw answers rather than the published headline). No Dutch pollster publishes such figures. Ipsos I&O weights on the 2025 vote and publishes its weighted shares with margins; Verian publishes weighted shares and counts uncertain voters less; Peil.nl publishes seats. So there is no raw-figure test in the Netherlands.
From the average to the seats
- Average. Each pollster's latest poll within 21 days of the newest counts once. Where a poll gives only seats, its share is seats ÷ 150 (Polls that publish only seats: deriving shares from seat headlines).
- Correction. Equation (1) of Forecasting the Tweede Kamer from imperfect polls: an overview, half the average past miss.
- Seats. The Kieswet count on the national shares. Parties not in the model are grouped as "others" and take no seats.
- Simulation. 2,000 runs, each party moved by its typical final-poll miss (Simulating Dutch polling error: where the chances come from).
- Coalitions. Every combination of two to four parties that reaches 76, with the statements parties made against each other (Coalitions: the largest party, the 76 line and who ruled out whom).
Limitations
- Seven elections, and a correction that passes by less than a tenth of a point per party, driven by PRO and the SP.
- PRO's record before 2023 is two parties added together; the PVV's record belongs to a party that has since split.
- The largest Dutch misses are late movers, which a historical average cannot foresee.
- Most final polls before 2021 published only seats.
- What we don't know yet: limitations of the Dutch forecast collects the rest.
References
Kieswet, hoofdstuk P (Zetelverdeling).
Jennings, W. and Wlezien, C. (2018). Election polling errors across time and space. Nature Human Behaviour, 2(4), 276–283.
How to cite
Polling Forecast (2026). Reading Dutch polls: the correction and its test. Retrieved 21 November 2026 from https://www.pollingforecast.com/research/netherlands-method. Live figures change as new polls arrive; the date above is when the text was last revised.