
Your polling error
Points by which the polls are wrong about each party's share. Shares are rescaled to the same total.
Loading…
Loading…
Illustrative: the Kamer is elected nationally.
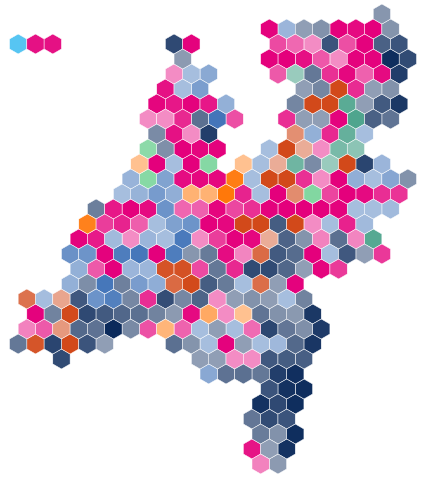
Gemeenten with a different leading party
Loading…
How big is a realistic polling error?
The biggest miss here: the polls had CDA 5.9 points too low (2002). On average they have put PRO 2.0 points too high, and our forecast allows for that.
| Party | 2002 2 polls | 2006 3 polls | 2010 1 polls | 2012 3 polls | 2017 7 polls | 2021 4 polls | 2023 3 polls | 2025 3 polls | Average | We adjust |
|---|---|---|---|---|---|---|---|---|---|---|
| PVV | – | −2.4 | −4.1 | +1.5 | +1.4 | +2.1 | −5.4 | −0.4 | −1.1 | +0.5 |
| D66 | +0.6 | −0.4 | −0.3 | −0.5 | −0.6 | −2.9 | 0.0 | −1.6 | −0.7 | +0.4 |
| VVD | +1.2 | −0.2 | +1.5 | −2.6 | −3.9 | +0.5 | +2.5 | −2.3 | −0.4 | +0.2 |
| CDA | −5.9 | +0.4 | +2.4 | −0.3 | +1.2 | +1.3 | −0.2 | +1.0 | 0.0 | 0.0 |
| PRO | +3.9 | +1.8 | +1.0 | −0.9 | +3.3 | +2.9 | +1.4 | +2.6 | +2.0 | −1.0 |
| JA21 | – | – | – | – | – | −0.9 | +0.2 | +0.4 | −0.1 | 0.0 |
| FvD | – | – | – | – | – | −1.5 | +0.4 | −0.4 | −0.5 | +0.3 |
| BBB | – | – | – | – | – | −0.3 | −0.9 | +0.1 | −0.4 | +0.2 |
| SP | −0.6 | +0.5 | −0.5 | +4.1 | +1.1 | +1.4 | +0.4 | +1.1 | +0.9 | −0.5 |
| PvdD | – | −0.5 | 0.0 | −0.2 | −0.1 | 0.0 | +0.9 | 0.0 | 0.0 | 0.0 |
| CU | +1.1 | +0.6 | +0.8 | +0.4 | +0.5 | +0.6 | +0.4 | −0.1 | +0.5 | −0.3 |
| SGP | −0.4 | 0.0 | +0.3 | −0.5 | −0.2 | 0.0 | −0.3 | −0.1 | −0.2 | +0.1 |
| DENK | – | – | – | – | – | −0.6 | +0.3 | +0.1 | −0.1 | 0.0 |
| 50PLUS | – | – | – | −0.1 | +0.3 | −0.6 | −0.2 | +0.3 | −0.1 | 0.0 |
| Volt | – | – | – | – | – | −0.4 | +0.6 | +0.4 | +0.2 | −0.1 |
| NSC | – | – | – | – | – | – | +0.1 | 0.0 | 0.0 | 0.0 |
Average of each pollster's final poll minus the result, in points. + means the polls overstated the party, − that they understated it.
If the polls miss like a past election
Today's polls in the Netherlands with each past election's polling error applied, through our seat model. Our forecast: PRO 30 of 150, 46 short of a majority.
| If the polls miss like | Largest party | Seats | Majority? | Leads change |
|---|---|---|---|---|
| 2002 | PRO | 25 | 51 short of a majority | 154 |
| 2006 | PRO | 28 | 48 short of a majority | 50 |
| 2010 | PRO | 30 | 46 short of a majority | 88 |
| 2012 | PRO | 32 | 44 short of a majority | 86 |
| 2017 | PRO | 27 | 49 short of a majority | 107 |
| 2021 | PRO | 27 | 49 short of a majority | 110 |
| 2023 | PRO | 29 | 47 short of a majority | 100 |
| 2025 | PRO | 27 | 49 short of a majority | 44 |
Figures as of . Published by Polling Forecast.


 United Kingdom
 France
 Germany
 Spain
 Italy
 Poland
 Canada
 Australia