The Dutch data: results, maps, statistics, members and polls
Abstract. Where every number on the Dutch pages comes from: the Kiesraad's results (CC0) nationally since 1946 and by gemeente since 2012, CBS and Kadaster boundaries and CBS statistics through PDOK, the Tweede Kamer's open data, and polls from the pollsters' own reports or Wikipedia's tables. How each was changed and checked, the lineage coding, the licences, and why the Tweede Kamer's portraits are not used.
Summary
This paper describes every data source behind the Dutch pages: where each comes from, how it was changed, how it was checked and under what terms it is used. Results come from the Kiesraad, under CC0: national results for every Tweede Kamer election since 1946 and results by gemeente for 2012 to 2025. Boundaries and statistics come from CBS and Kadaster through PDOK; members and fracties from the Tweede Kamer's open data. Polls come from the pollsters' own reports where we could read them (grade A) and otherwise from Wikipedia's poll tables (grade C), marked on the site. We use no poll aggregator's data, the Peilingwijzer included, and no other forecaster's.
Two things could not be done from where the data was collected. CBS's StatLine refused our connections, so the statistics come from the CBS layers published on PDOK. And most of Peil.nl's posts are for subscribers, so most Peil.nl polls rest on Wikipedia's tables.
What has changed since this paper was written
Updated 9 November 2026. The rest of the paper is as first published, except where a sentence below says it was corrected.
- More frequent checks (13 October). After the morning run the poll readers check again every three hours until 11pm.
- Pollster grades rescaled (13 October) (Rating Dutch pollsters: accuracy, the lead and openness).
Principles
- Official data first. Every result, boundary and statistic comes from an official source.
- Every poll is cited, with a link and a source grade.
- No aggregators or other forecasters. The Peilingwijzer, AllePeilingen and similar sites are not used, even as a check.
- Changes are stated. Parties are grouped by lineage, figures aggregated and geometry simplified, and the site says so.
- Photographs only where the terms allow.
Election results
National results, 1946–2025
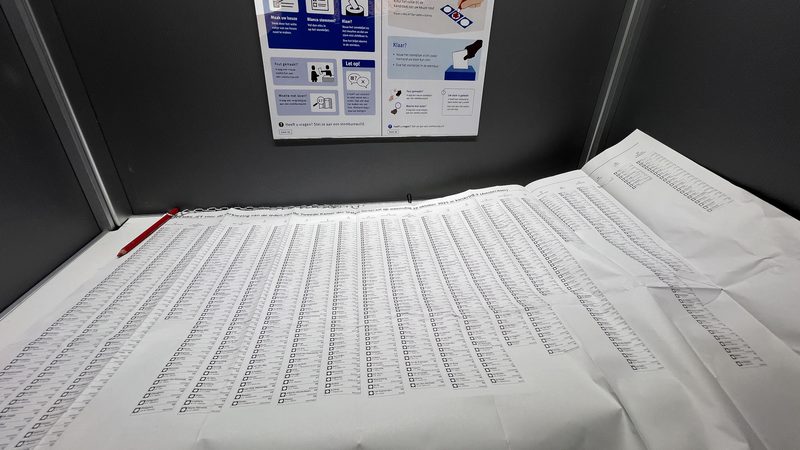
The Kiesraad's Databank Verkiezingsuitslagen gives each Tweede Kamer election's national result, list by list, with seats. In 20 of 25 elections the list votes add up exactly to the Databank's valid vote; in the other five the gap is a few votes, except 1946, where small lists appear to be missing. The Kamer had 100 seats until 1956 and 150 from 1959. These results feed the long view and the lineage of each party.
Results by gemeente, 2012–2025
For each election from 2012 we built each gemeente's result from the Kiesraad's own count files: the count files (EML) of the kieskringen for 2012 and 2021, the gemeente CSV files for 2023 and 2025, and for 2017 a mixture of count files and Databank tables, because the Kiesraad's 2017 files come from several levels and were keyed from paper. The checks:
- For 2012, 2021, 2023 and 2025 the gemeenten add up exactly to the national list votes. For 2017 they are 24 votes over, in two kieskringen.
- For 2023 and 2025 the polling-station files, summed by gemeente, equal the gemeente files (in 2023, two gemeenten differ by one vote each, netting to zero).
- The national totals of 2021, 2023 and 2025 (electorate, votes cast, valid, blank and invalid) equal the Kiesraad's announcements.
The Caribbean Netherlands (Bonaire, Sint Eustatius and Saba) is in the results as three units in 2012, 2023 and 2025, and as one in 2017 and 2021. The postal vote of Dutch voters abroad, counted in The Hague, is a separate unit in 2023 and 2025.
Seats
Seats by party come from the Databank and equal the Kiesraad's announcements. Our own count on the official votes reproduces them for 2021, 2023 and 2025, and, with the list combinations then in force, for 2012 and 2017 (From votes to seats: the Kieswet).
Parties and lineages
Every list is coded to a party. For measuring polling error, parties are grouped by their line to today (Measuring Dutch polling error, 2006–2025): GroenLinks, the PvdA and their joint list as PRO, the party they formed on 1 July 2026; the KVP, ARP and CHU as the CDA; the GPV and RPF as the CU. The Groep Markuszower, seven MPs who left the PVV on 20 January 2026, is coded DNA, after its party, De Nederlandse Alliantie. Mona Keijzer, who left the BBB fractie on 24 February 2026, is a one-member fractie.
Geography and statistics
The map is CBS and Kadaster's division of 2026 (342 gemeenten and 12 provinces, via PDOK, CC BY 4.0), simplified so that neighbours keep identical borders, with the three Caribbean islands as insets from Natural Earth. The hex map gives each gemeente one hexagon, grouped by province. Gemeenten that merged since 2012 keep their old results under their old codes; a gemeente that absorbed another keeps its code, so its earlier rows cover a smaller area.
Statistics. Each gemeente page has population, age, origin, households, income, education and housing from CBS's Kerncijfers wijken en buurten for 2023 to 2025, through PDOK. A few income figures are suppressed by CBS for small gemeenten. The statistics describe a gemeente; they are not used in the forecast.
Members and photographs
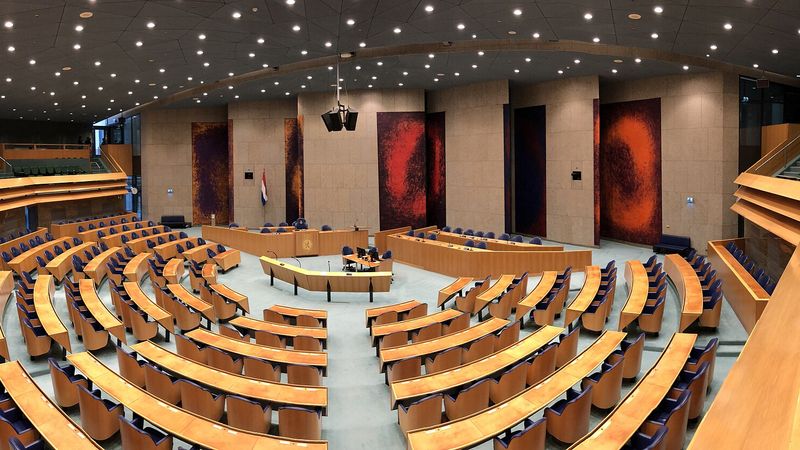
The Tweede Kamer's open data lists every fractie membership since the 2025 election: 150 members today, and the fractie changes since (the PVV split, Keijzer, and GroenLinks-PvdA becoming PRO in June 2026). 148 of the 150 candidates the Kiesraad declared elected match a Tweede Kamer member; the other two, Frans Timmermans and Koen Castelein, never took their seats. Reasons for leaving come from Wikipedia and are marked as such.
Photographs. The Tweede Kamer allows its photographs to be used under CC BY-NC 4.0, which rules out commercial reuse, so we do not use them. Photographs come from Wikimedia Commons, under each file's own licence and credited.
Polls
What is held
| Polls | A | B | C | Total |
|---|---|---|---|---|
| Final polls, Tweede Kamer 2002–2025 | 3 | 0 | 23 | 26 |
| National polls since the 2025 election | 26 | 0 | 20 | 46 |
Final polls at the elections of 2002 to 2025 are the evidence for polling error (Measuring Dutch polling error, 2006–2025). National polls since 2025 make today's average. A further series of every poll in the three years before each election from 2012 feeds the election-day test (From today to polling day in the Netherlands).
Where the figures come from
Wikipedia's Dutch and English poll tables were the finding aid. For every poll we could, the figures were read from the pollster's own report:
- Ipsos I&O: the report PDFs on its site, parsed from the text; for four reports the seats were read from the bar chart.
- Verian: the report PDFs, with seats and vote shares.
- Peil.nl: the seat-table images in its open posts (three posts, one of which also gives an earlier poll).
- Ipsos, 2023: the final poll's seats from the release text.
Every primary figure read matched the Wikipedia row. The rest, most Peil.nl polls and the final polls before 2023, are grade C. Where a report gives a sample size, we store the number with a party preference, which is the base of the seat table, and the total in the notes.
What we leave out
Polls that are not national are left out: OOG's polls of Groningen and Het Opiniehuis's polls of bi-cultural voters. The Peilingwijzer and other averages are not polls.
Conventions worth knowing
- Seats first. Seats are stored as published. Where a poll published no vote shares, the share is seats ÷ 150, and the poll's notes say so (Polls that publish only seats: deriving shares from seat headlines).
- Lineage in polls. Polls since 2025 give GroenLinks-PvdA as PRO and the Groep Markuszower as the DNA.
- Sums. A few older final polls add up to 148 to 151 seats in Wikipedia's tables, because small parties were left out or rounded as published. They are kept as published.
No blackout
The Netherlands has no ban on publishing polls before an election, and the site has no blackout switch for it.
Licences
| Data | Source | Terms | Credit |
|---|---|---|---|
| Results, seats, candidate lists | Kiesraad (data.overheid.nl, verkiezingsuitslagen.nl) | CC0 | "Bron: Kiesraad" |
| Members, fracties | Tweede Kamer, Gegevensmagazijn | CC0 | "Tweede Kamer der Staten-Generaal" |
| Gemeente and province boundaries | CBS and Kadaster, Gebiedsindelingen 2026 (PDOK) | CC BY 4.0 | "Bron: CBS en Kadaster" |
| Statistics | CBS, Kerncijfers wijken en buurten (PDOK) | CC BY 4.0 | "Bron: CBS" |
| Caribbean islands' outlines | Natural Earth | Public domain | – |
| Poll figures from pollsters | each pollster | Published figures, cited | link on each poll |
| Some polls, reasons members left | Wikipedia | CC BY-SA 4.0 (grade C) | per figure |
| Coalition statements | NRC and NOS reporting, November 2025 | Cited | link on each statement |
| Photographs | photographers on Wikimedia Commons | each file's licence; Tweede Kamer portraits (CC BY-NC) excluded | per photo |
Table: Licences.
Known gaps
| Gap | Effect | What would fix it |
|---|---|---|
| Peil.nl's posts mostly for subscribers | Most Peil.nl polls graded C | Peil.nl publishing openly, or a subscription |
| Old releases gone | Final polls before 2023 graded C | An archive of the pollsters' releases |
| No final poll for 2003; one for 2010 | Thinner record | An open compilation of old polls |
| CBS StatLine unreachable | Statistics from PDOK layers, with a few gaps | Reading StatLine from another network |
| Election-day series from Wikipedia only | Not checked against releases | Checking the series against the reports |
Table: Known gaps in the Dutch data.
How to cite
Polling Forecast (2026). The Dutch data: results, maps, statistics, members and polls. Retrieved 21 November 2026 from https://www.pollingforecast.com/research/netherlands-data. Live figures change as new polls arrive; the date above is when the text was last revised.