Forecasting the Tweede Kamer from imperfect polls: an overview
Abstract. The Netherlands section forecasts the next Tweede Kamer election with the rule used for Great Britain: take half the average past miss off today's polls, but only where that would have improved past forecasts made without knowing the result. Dutch final polls, taken the day before the vote, pass that test narrowly, mostly because GroenLinks and the PvdA (now PRO) and the SP have been overstated at six of seven elections, so they are corrected. The seats follow almost directly from the national vote, and our count reproduces 2021, 2023 and 2025 exactly; who governs depends on the 76 line and on what the parties say about each other. This paper maps the other Netherlands papers.
Summary
This paper is the way into the Netherlands section of Polling Forecast. It says what the section forecasts, why Dutch polls are corrected, how the Kieswet turns votes into 150 seats, why the coalition arithmetic needs statements as well as seats, and how the uncertainty is measured. The last section is a guide to the other Netherlands papers.
The short version is this. Dutch final polls are taken the day before the vote and have missed each party by about a point on average at the seven Tweede Kamer elections since 2006. Some parties have been missed the same way time after time: GroenLinks and the PvdA, measured together as PRO, were overstated at six of seven elections, and so was the SP. Taking off half the average past miss, with each election predicted from the others, was closer at four elections, level at one and further out at two, and closer on average, so the forecast corrects. The seats are then almost a straight function of the national vote: one district, a quota of 1/150 of the vote, and the leftover seats by highest averages. Our count reproduces the official seats of 2021, 2023 and 2025 exactly. What the seats do not settle is who governs: no party has had a majority for more than a century, and in 2025 the combinations with 76 seats were blocked by what the parties had said about each other.
What has changed since this paper was written
Updated 9 November 2026. The rest of the paper is as first published, except where a sentence below says it was corrected.
- Only elections from 2000 shape the forecast (28 September). Earlier elections stay in the long view and on the history pages but no longer feed any test, correction or error size. In the Netherlands the gemeente swing is now tested on the eight pairs of elections from 2002; proportional swing was closer at all eight, so it stays.
- Our figures beside the polls (26 October). Our projection differs from the poll average in the Netherlands, so both are shown on the hub, the leader cards and the polls page.
- Pollster grades rescaled (13 October) (Rating Dutch pollsters: accuracy, the lead and openness).
- When the polls missed (2 November): Rutte pulls away, Wilders fades: the left-leaning panels behind the 2017 Dutch polling miss and Wilders' last-minute landslide: how the 2023 Dutch polls missed the PVV by nine seats.
- The map (November). The map can be coloured by any census figure; each census figure also has its own page (census maps). It can also replay a past polling miss ("The polls miss again") or take a vote you set.
What the Netherlands section forecasts
The forecast is for the next election to the Tweede Kamer. The Kiesraad gives 15 May 2030 as the next regular date, and the site uses it. The Kamer can be dissolved earlier, and three of the last four elections came early (2012, 2023 and 2025).
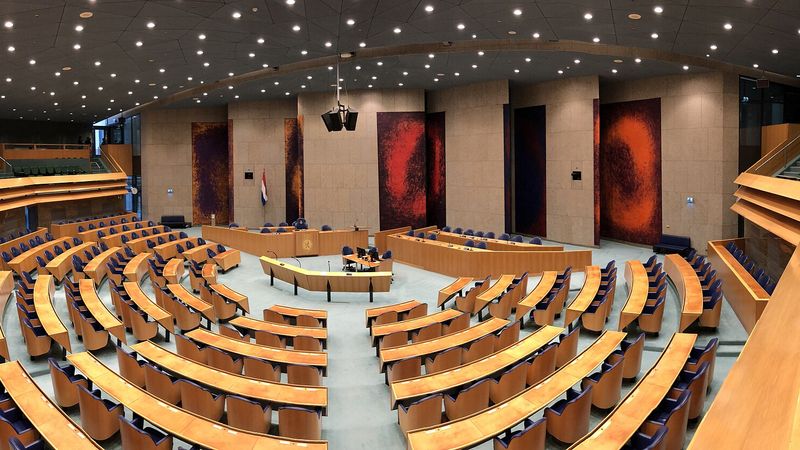
The Kamer has 150 seats, all elected in one national count. A majority is 76. The Eerste Kamer, elected indirectly by the provincial councils, can reject bills but not bring down a cabinet; the site forecasts the Tweede Kamer only.
The section answers five questions, each on its own page:
- How many seats would each party win if the election were held today? (The home page and the seats page.)
- Which party is likely to be largest, and so likely to lead the formation?
- Which combinations reach 76, and which of them has a party ruled out? (The coalitions page.)
- Where is each party strong? (The map, for illustration only: no seat depends on geography.)
- How different could the result be on polling day? (The election-day page.)
The headline, as of 18 November 2026, is below. It is built from the latest poll of each of 2 pollsters.
| Party | Polls | Our bet | Seats | 80% range | 2025 | Largest party | Wins a seat |
|---|---|---|---|---|---|---|---|
| PRO | 20.0 | 19.0 | 30 | 25–34 | 20 | 91% | over 99% |
| PVV | 13.4 | 13.9 | 21 | 16–27 | 26 | 9% | over 99% |
| JA21 | 11.7 | 11.8 | 18 | 16–20 | 9 | 0% | over 99% |
| D66 | 10.0 | 10.4 | 16 | 13–18 | 26 | 0% | over 99% |
| VVD | 9.0 | 9.2 | 14 | 10–18 | 22 | under 1% | over 99% |
| CDA | 8.7 | 8.7 | 13 | 9–18 | 18 | under 1% | over 99% |
| FvD | 7.3 | 7.6 | 11 | 10–13 | 7 | 0% | over 99% |
| 50PLUS | 3.3 | 3.3 | 5 | 4–6 | 2 | 0% | over 99% |
| PvdD | 3.0 | 3.0 | 4 | 3–5 | 3 | 0% | over 99% |
| SP | 3.3 | 2.8 | 4 | 1–7 | 3 | 0% | 91% |
| SGP | 2.7 | 2.8 | 4 | 3–5 | 3 | 0% | over 99% |
| Volt | 2.4 | 2.3 | 3 | 2–4 | 1 | 0% | over 99% |
| CU | 2.4 | 2.1 | 3 | 1–4 | 3 | 0% | 99% |
| DENK | 2.0 | 2.0 | 3 | 2–3 | 3 | 0% | over 99% |
| BBB | 1.0 | 1.2 | 1 | 0–2 | 4 | 0% | 83% |
On these figures the largest party would be PRO, with 30 seats; it comes first in 91% of simulated elections.
One rule for every country
The British forecast starts from a finding: at every general election from 2015 to 2024, England's final polls missed in fairly steady directions, and a correction built from those misses would have brought the forecast closer to the result (see Forecasting a British general election when the polls are wrong: an overview and Correcting the raw answers: the method behind our UK projection). The rule we took from that work is the same in every country.
For each party \(p\) and past election \(t\), let \(e_{p,t}\) be the average of the final polls minus the result, in points. The correction takes off half of the average past miss:
where \(y_p\) is today's poll average, followed by a rescale so the shares keep the same total. A party is corrected only if it has been measured at two or more elections. The rule is kept only if, with each past election predicted from the others alone (Stone, 1974), its average miss per party beats the uncorrected polls by more than 0.01 points. In Germany and Spain it does not. In Italy and the Netherlands it does.
Why Dutch polls are corrected
The table below is the evidence: the average of the final polls minus the result, party by party, at each Tweede Kamer election since 2006. Parties are measured by their line to today: GroenLinks and the PvdA are added together as PRO, the party they merged into in 2026.
| Party | 2002 | 2006 | 2010 | 2012 | 2017 | 2021 | 2023 | 2025 | Average |
|---|---|---|---|---|---|---|---|---|---|
| CDA | −5.9 | +0.4 | +2.4 | −0.3 | +1.2 | +1.3 | −0.2 | +1.0 | 0.0 |
| CU | +1.1 | +0.6 | +0.8 | +0.4 | +0.5 | +0.6 | +0.4 | −0.1 | +0.5 |
| D66 | +0.6 | −0.4 | −0.3 | −0.5 | −0.6 | −2.9 | 0.0 | −1.6 | −0.7 |
| PRO (GL + PvdA) | +3.9 | +1.8 | +1.0 | −0.9 | +3.3 | +2.9 | +1.4 | +2.6 | +2.0 |
| SGP | −0.4 | 0.0 | +0.3 | −0.5 | −0.2 | 0.0 | −0.3 | −0.1 | −0.2 |
| SP | −0.6 | +0.5 | −0.5 | +4.1 | +1.1 | +1.4 | +0.4 | +1.1 | +0.9 |
| VVD | +1.2 | −0.2 | +1.5 | −2.6 | −3.9 | +0.5 | +2.5 | −2.3 | −0.4 |
| PvdD | – | −0.5 | 0.0 | −0.2 | −0.1 | 0.0 | +0.9 | 0.0 | 0.0 |
| PVV | – | −2.4 | −4.1 | +1.5 | +1.4 | +2.1 | −5.4 | −0.4 | −1.1 |
| 50PLUS | – | – | – | −0.1 | +0.3 | −0.6 | −0.2 | +0.3 | −0.1 |
| BBB | – | – | – | – | – | −0.3 | −0.9 | +0.1 | −0.4 |
| DENK | – | – | – | – | – | −0.6 | +0.3 | +0.1 | −0.1 |
| FvD | – | – | – | – | – | −1.5 | +0.4 | −0.4 | −0.5 |
| JA21 | – | – | – | – | – | −0.9 | +0.2 | +0.4 | −0.1 |
| Volt | – | – | – | – | – | −0.4 | +0.6 | +0.4 | +0.2 |
| NSC | – | – | – | – | – | – | +0.1 | 0.0 | 0.0 |
Three patterns stand out. PRO's predecessors were overstated at every election but 2012, by up to 3.3 points. The SP was overstated at every election but 2010. The PVV was missed by more than any other party, but in both directions: understated by 5.4 points in 2023, overstated by 2.1 in 2021.
The test:
| Election | Polls' average miss | Corrected, leave one out | Verdict |
|---|---|---|---|
| 2002 | 1.96 | 2.10 | further out |
| 2006 | 0.75 | 0.53 | closer |
| 2010 | 1.21 | 1.18 | closer |
| 2012 | 1.11 | 1.18 | further out |
| 2017 | 1.26 | 1.16 | closer |
| 2021 | 1.08 | 1.08 | level |
| 2023 | 0.89 | 0.87 | closer |
| 2025 | 0.68 | 0.59 | closer |
| Average | 1.12 | 1.09 |
Correcting was closer at 5 of the seven elections, level at 1 and further out at 2, and closer on average: 1.09 points per party against 1.12. That passes the rule, so the correction is on. The margin is small. The gain comes from the parties missed the same way each time, PRO and the SP above all; the PVV and the VVD, whose misses change sign, are made slightly worse (Reading Dutch polls: the correction and its test).
Today the correction takes these amounts off the polls:
| Party | Elections | Average miss | Typical miss (RMS) | Taken off today |
|---|---|---|---|---|
| PRO (GL + PvdA) | 8 | +2.0 | 2.5 | −1.0 |
| PVV | 7 | −1.1 | 3.0 | +0.5 |
| SP | 8 | +0.9 | 1.7 | −0.5 |
| D66 | 8 | −0.7 | 1.2 | +0.4 |
| CU | 8 | +0.5 | 0.6 | −0.3 |
| FvD | 3 | −0.5 | 0.9 | +0.3 |
| VVD | 8 | −0.4 | 2.2 | +0.2 |
| BBB | 3 | −0.4 | 0.5 | +0.2 |
| Volt | 3 | +0.2 | 0.5 | −0.1 |
| SGP | 8 | −0.2 | 0.3 | +0.1 |
| DENK | 3 | −0.1 | 0.4 | 0.0 |
| JA21 | 3 | −0.1 | 0.6 | 0.0 |
| 50PLUS | 5 | −0.1 | 0.4 | 0.0 |
| NSC | 2 | 0.0 | 0.1 | 0.0 |
| PvdD | 7 | 0.0 | 0.4 | 0.0 |
| CDA | 8 | 0.0 | 2.4 | 0.0 |
The largest is PRO's, −1.0 points, half its average miss of +2.0. The DNA, the party of the seven MPs who left the PVV in January 2026, has no record and is not corrected.
No ban, and final polls the day before
The Netherlands has no ban on publishing polls before an election. The final polls are published on the eve of the vote, with fieldwork ending one or two days before polling day. That makes the Dutch record different from the Italian or Spanish one: what remains of the error cannot be put down to movement the polls were not allowed to show. It is still partly late movement. Dutch voters decide late, and the parties that surged in the last week (D66 in 2021, the PVV in 2023) were understated even by polls taken the day before.
What decides the seats
One district
The 20 kieskringen are for administration only. Every vote counts towards the party's national total, and the 150 seats are shared in one national count. There are no constituencies to project, no regional swing and no seats won locally. The seat step is close to proportional, and the forecast's work is almost all in the vote shares.
The kiesdeler
The kiesdeler is the valid vote divided by 150, about 0.67% of the vote. A party gets one seat for every full kiesdeler, and the seats left over go one at a time to the highest average among parties that reached at least one full kiesdeler (Kieswet, articles P 5 to P 9). There is no other threshold. List combinations, which let two parties pool their remainders, were abolished for elections from 2021. From votes to seats: the Kieswet gives the details, and the check against the last three elections.
Seats as the headline
Dutch pollsters lead with seats, not vote shares. Peil.nl publishes only seats; Ipsos I&O and Verian publish both. Where a poll gives only seats, the forecast takes seats ÷ 150 as the share. Polls that publish only seats: deriving shares from seat headlines explains what that costs.
The largest party and the 76 line
By convention the largest party leads the formation and usually supplies the prime minister, so the forecast gives each party's chance of coming first. In 2025 D66 and the PVV both won 26 seats; D66 was ahead by 29,668 votes. The seats that matter after that are 76. In 2025 D66, the VVD, the CDA and GroenLinks-PvdA had 86 seats together, but the VVD had ruled out governing with GroenLinks-PvdA, and the result was a minority cabinet of D66, the VVD and the CDA with 66 seats. Coalitions: the largest party, the 76 line and who ruled out whom sets out the combinations that reach 76 today and the statements against each.
The forecast, step by step
Step 1: the average. The latest poll of each pollster whose fieldwork ended within 21 days of the newest poll, equally weighted, in vote shares (seats ÷ 150 where only seats were published).
Step 2: our reading. Equation (1), with the correction on because it passes the test.
Step 3: seats. The Kieswet count on the national shares, with the parties not modelled grouped as "others", which win no seats.
Step 4: simulation. 2,000 simulated elections, each party moved by its typical final-poll miss (Simulating Dutch polling error: where the chances come from). From these come the seat ranges, the chance of being largest and the chance of each combination reaching 76.
Step 5: replays. Today's polls replayed with each past election's miss (If we're wrong: replaying past Dutch polling misses on today's polls).
Step 6: polling day. Part of the way back towards the 2025 result, and wider ranges for the time left (From today to polling day in the Netherlands).
The uncertainty
The simulation gives the seat ranges and the chances. The parties with the widest spread are those the polls have missed most: the PVV, whose typical final-poll miss is about three points, the VVD and PRO. The small parties' uncertainty is mostly about the kiesdeler: a party near 0.67% wins one seat or none. On polling day, 1271 days after the latest poll at most, polls this far out have missed each party by about 4.2 points.
What we do not claim
We do not claim to know who will govern. The coalition page shows which combinations reach 76 and what parties said during the last formation; parties can change their minds.
We do not claim that the correction will work next time. It passed a test on seven elections by a small margin, and the Dutch party system changes quickly: GroenLinks and the PvdA merged, the PVV split, and NSC went from 20 seats to none in two years.
We do not claim to see late swings. The Dutch record is dominated by parties that moved in the last days of the campaign, and no correction built from averages can say which party will move next time.
We do not claim local precision. The map moves each gemeente's 2025 result by the national change, for illustration.
A guide to the papers
The Netherlands library has twelve papers. This one, Forecasting the Tweede Kamer from imperfect polls: an overview, is the introduction.
Measuring Dutch polling error, 2006–2025 sets out the evidence: the final polls at the Tweede Kamer elections from 2006 to 2025, the error party by party, the gap between the two largest parties, each pollster's record and the long view.
Reading Dutch polls: the correction and its test is the core methods paper: the correction rule, the leave-one-out test that keeps it, and what it does to today's polls.
From votes to seats: the Kieswet covers the Kieswet: the kiesdeler, the remainder seats, list combinations before 2021, and the check against 2021, 2023 and 2025.
Coalitions: the largest party, the 76 line and who ruled out whom covers the 76 line, the largest-party convention, and the statements parties made about each other in the 2025–26 formation.
Polls that publish only seats: deriving shares from seat headlines explains how shares are derived from polls that publish only seats, and what that costs.
Simulating Dutch polling error: where the chances come from explains where the chances come from.
From today to polling day in the Netherlands asks how far Dutch polls move before polling day, at distances up to three years before the elections of 2012 to 2025.
If we're wrong: replaying past Dutch polling misses on today's polls describes the readings of today's polls: as they stand, corrected, and with each past miss replayed.
Rating Dutch pollsters: accuracy, the lead and openness describes the pollster ratings.
The Dutch data: results, maps, statistics, members and polls documents where every number comes from.
What we don't know yet: limitations of the Dutch forecast collects every known weakness in one place.
References
Jennings, W. and Wlezien, C. (2018). Election polling errors across time and space. Nature Human Behaviour, 2(4), 276–283.
Kieswet, hoofdstuk P (Zetelverdeling).
Stone, M. (1974). Cross-validatory choice and assessment of statistical predictions. Journal of the Royal Statistical Society: Series B, 36(2), 111–147.
How to cite
Polling Forecast (2026). Forecasting the Tweede Kamer from imperfect polls: an overview. Retrieved 21 November 2026 from https://www.pollingforecast.com/research/netherlands-overview. Live figures change as new polls arrive; the date above is when the text was last revised.