Measuring Spanish polling error, 2004–2023
Abstract. We measure the error of the final polls at the eight Spanish general elections from 2004 to 2023, taken under the five-day ban on publishing polls: which polls count, how their sources are graded, the error party by party and on the gap between the two largest parties, each pollster's record and the long view back to 1977. The left of the PSOE is measured as one lineage. The two largest misses, in 2004 and 2016, were shared by every pollster; no party has been missed the same way at every election.
Summary
This paper sets out how we measure polling error in Spain: which polls count as final polls, how the five-day publication ban shapes them, how their sources are graded, how the error is defined, and what the record shows. At the eight general elections from 2004 to 2023 the average of the final polls missed each party by between 0.7 and 2.7 points. The two largest misses came at opposite ends of the period: in 2004, when every final poll had the PP ahead and the PSOE won by more than five points three days after the Madrid train bombings, and in 2016, when every final poll overstated Unidos Podemos and understated the PP. Since then no party has been missed the same way at every election. The PSOE was understated by more than three points in 2023, but overstated in 2011 and April 2019; the PP has been overstated four times and understated four times.
The record has three uses on the site. Its size sets the width of our ranges (Simulating Spanish polling error: where the chances come from). Its lack of a steady direction is the reason we do not correct Spanish polls (Reading Spanish polls: the correction test and the CIS's raw figures). And its pollster-by-pollster detail feeds the ratings (Rating Spanish pollsters: accuracy, the lead and openness). Beside it sit the final polls at earlier elections back to 1977, where we could source them.
What has changed since this paper was written
Updated 9 November 2026. The rest of the paper is as first published, except where a sentence below says it was corrected.
- Only elections from 2000 shape the forecast (28 September). Earlier elections stay in the long view and on the history pages but no longer feed any test, correction or error size. In Spain nothing before 2000 was used, so nothing changed.
- When the polls missed (2 November): The sorpasso that never came: Spain's June 2016 polling miss and The majority that wasn't: Spain's 2023 polling miss and the CIS outlier.
- The track record across countries (28 September). Final polls at 133 elections in nine countries, measured the same way, are at /accuracy/elections.
What is measured, and against what
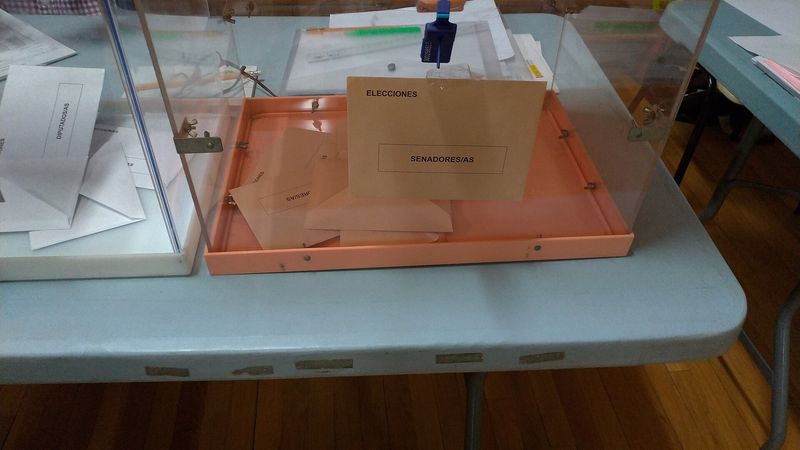
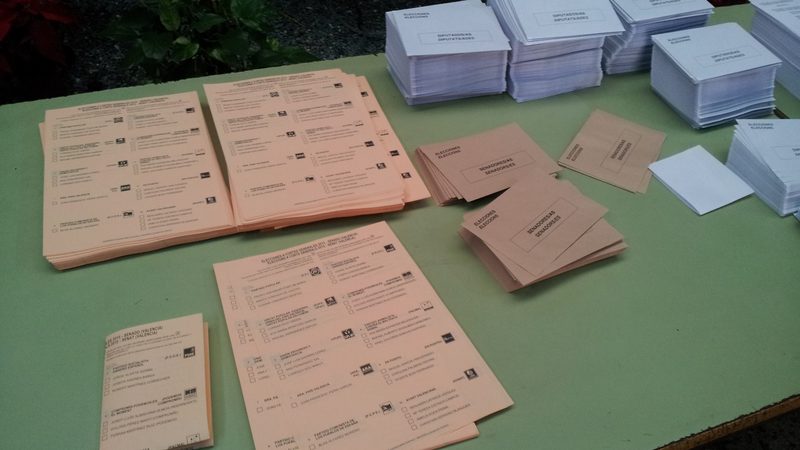
The quantity that decides the Congreso is each party's share of the valid vote in each province, but Spanish voting-intention polls report national shares, and that is what we measure. The base is the valid vote including blank votes, which Spanish law counts as valid (LOREG art. 96.5) and which Spanish pollsters include in the total they publish. Results come from the Junta Electoral Central's official summaries in the Boletín Oficial del Estado (The Spanish data: results, maps, statistics, deputies and polls).
Two complications need a rule.
Parties that merge and split. The space to the left of the PSOE has changed shape at almost every election: Izquierda Unida alone until 2011; Podemos and its regional allies beside IU in 2015; the two together as Unidos Podemos in 2016 and Unidas Podemos in 2019, with Más País standing separately in November 2019; everything inside Sumar in 2023; and Sumar and Podemos apart again since Podemos left Sumar's parliamentary group in December 2023. Measured list by list, this would give a party that changes name every two years and a record of one or two elections. We measure it as one lineage instead, coded Sumar: at each election, the polls' combined figure for IU, Podemos, Unidas Podemos, Más País and Sumar against their combined result. The label on the site is "Sumar (and predecessors)".
Parties that ran jointly in some provinces. UPN and the PP ran together in Navarra from 2004 to 2016, and as part of Navarra Suma in 2019. Pollsters mostly report the PP including these lists, and so does our coding. UPN, which stood alone in 2023, is therefore not measured at earlier elections.
The parties measured at each election are those in the result and in at least half of that election's final polls. The PP, the PSOE, the left lineage, ERC, Junts (and its predecessors CiU, DiL and CDC) and the PNV are measured at most elections; Ciudadanos from 2015 to November 2019; Vox from April 2019; EH Bildu, the BNG and Coalición Canaria where enough pollsters published them. Everything else is "others" and is not scored.
Definitions
Let \(v_{p,t}\) be party \(p\)'s share of the valid vote at election \(t\), and let \(y_{j,p,t}\) be its share in final poll \(j\), one of the \(n_t\) final polls for that election. The error of a single poll is
The sign convention is the same everywhere on the site: error = poll minus result. A positive error means the polls overstated the party.
The industry error at election \(t\) is the error of the simple average of the final polls,
where \(n_{p,t}\) is the number of final polls reporting the party. Each pollster counts once, however large its sample.
To compare elections we use the average miss per party, the mean absolute industry error over the \(P_t\) parties measured at that election:
For each party we summarise its errors across elections by their mean, which measures direction, and their root mean square (RMS), which measures size:
where \(s_p^2\) is the variance of the errors around their mean. The identity on the right splits the size of a party's misses into a steady part and a part that changes from one election to the next.
The gap between the two largest parties decides who is proposed for investiture first, so we score it too. If \(a\) and \(b\) finished first and second, the gap error is
A positive gap error means the polls put the winner too far ahead.
The evidence: final polls under a publication ban
What counts as a final poll
Article 69.7 of the LOREG forbids publishing or broadcasting polls in the five days before polling day. The last day a poll may appear is therefore the Monday before a Sunday election. A pollster's final poll is its last poll whose fieldwork ended on or before that day, published (where the date is known) on or before it, and ending no more than 45 days before polling day. Polls published abroad during the ban, which Spanish newspapers sometimes report, are excluded, and so are exit polls and election-night polls. One poll per pollster per election is kept.
The ban means the average final poll finished fieldwork about ten days before the vote:
| Election | Final polls | Median days before the vote | Closest to the vote | Furthest |
|---|---|---|---|---|
| 2004 | 9 | 11 | 7 | 28 |
| 2008 | 11 | 9 | 7 | 34 |
| 2011 | 17 | 12 | 8 | 41 |
| 2015 | 21 | 10 | 6 | 34 |
| 2016 | 22 | 9 | 6 | 39 |
| April 2019 | 18 | 10 | 6 | 41 |
| November 2019 | 20 | 10 | 7 | 37 |
| 2023 | 22 | 8 | 6 | 19 |
Anything that happened in the last week is invisible to them. That matters most in 2004, and is one reason the Spanish record cannot be read as a pure measure of how well pollsters sample.
The database holds 150 final polls from 2004 to 2023. Ten report fewer than four of the measured parties (seven of them in 2008) and are left out, which leaves 140 final polls from 50 pollsters. Their number grew from 9 in 2004 to 22 in 2016 and in 2023. The CIS has a final poll at all eight elections, and Sigma Dos too; Sondaxe, Celeste-Tel and Simple Lógica at seven.
Grading the source
Every figure carries a source grade, on the same scale as in Britain. Grade A is the pollster's own release or an official study; grade B is the report in the newspaper or broadcaster that commissioned the poll; grade C is a secondary transcription, here Wikipedia's poll tables. The CIS publishes every study on its own site, so its final polls are grade A. For other pollsters we fetched the pages Wikipedia cites and searched them for the figures; where the PP and PSOE figures and at least three shares were found, the poll was upgraded to A (pollster's own page) or B (the commissioning outlet's page). Of the 150 final polls, 9 are grade A, 21 grade B and 120 grade C. Before 2015 almost nothing but the CIS could be checked, because the pages Wikipedia cites have gone or sit behind paywalls.
Grade C is a limitation, and we do not hide it. The Spanish data: results, maps, statistics, deputies and polls describes the checks. The Wikipedia shares and the official results agree within 0.25 points for every coded party from 2004 to 2023, and where a CIS figure could be compared with its Wikipedia row, 770 of 772 figures agreed within 0.15 points.
A worked example: 2023
The 2023 election, called early for 23 July, had 22 final polls. Their figures for the four national parties, and each poll's own average miss over the eight parties measured, were:
| Pollster | Fieldwork end | PP | PSOE | Vox | Sumar | Poll's miss per party |
|---|---|---|---|---|---|---|
| CIS | 12 Jul | 30.8 | 32.2 | 11.8 | 14.9 | 0.83 |
| SocioMétrica | 16 Jul | 33.5 | 28.3 | 13.7 | 13.2 | 0.87 |
| Cluster17 | 14 Jul | 33.6 | 28.9 | 13.7 | 13.5 | 0.87 |
| Ipsos | 6 Jul | 35.3 | 28.2 | 12.6 | 12.9 | 0.89 |
| IMOP Insights | 14 Jul | 32.9 | 28.2 | 14.5 | 12.8 | 0.92 |
| YouGov | 17 Jul | 32 | 28 | 14 | 14 | 1.13 |
| GAD3 | 17 Jul | 36.9 | 28.6 | 11.7 | 11.5 | 1.19 |
| Opinòmetre | 4 Jul | 32.6 | 29 | 12.7 | 15.5 | 1.19 |
| Celeste-Tel | 12 Jul | 36.5 | 28.4 | 11.4 | 11.5 | 1.23 |
| Hamalgama Métrica | 13 Jul | 36.3 | 27.5 | 13.8 | 12.1 | 1.28 |
| Sigma Dos | 17 Jul | 35.4 | 28 | 11.2 | 13.6 | 1.30 |
| Data10 | 17 Jul | 36 | 27.5 | 12.5 | 12.5 | 1.34 |
| 40dB. | 16 Jul | 32.9 | 28.7 | 13.5 | 13.7 | 1.41 |
| NC Report | 16 Jul | 37.2 | 28.3 | 11.1 | 11.3 | 1.41 |
| Sondaxe | 16 Jul | 34.3 | 28.7 | 12.5 | 14 | 1.50 |
| Top Position | 6 Jul | 34.2 | 28.1 | 13.3 | 12.8 | 1.53 |
| Simple Lógica | 16 Jul | 32.2 | 28.6 | 13.9 | 13.8 | 1.73 |
| Target Point | 16 Jul | 36.4 | 28.1 | 12.4 | 12.1 | 1.79 |
| AtlasIntel | 17 Jul | 30.8 | 29.4 | 17 | 16.1 | 1.80 |
| GESOP | 15 Jul | 30.6 | 27.4 | 15 | 14.4 | 1.96 |
| DYM | 13 Jul | 35.5 | 27.1 | 12.3 | 13.1 | 1.97 |
| Invymark | 14 Jul | 33.5 | 26.3 | 13.8 | 13.7 | 2.15 |
| Average | 34.06 | 28.34 | 13.11 | 13.32 | ||
| Result | 33.06 | 31.68 | 12.39 | 12.31 | ||
| Error | +1.0 | −3.3 | +0.7 | +1.0 |
Table: Final polls and result, Congreso 2023, share of the valid vote, points. Rows ordered by each poll's own miss. Some polls also published ERC, Junts, EH Bildu and the PNV, which count in their miss but are not shown.
The average missed by 0.85 points per party over the eight parties measured, by equation (3). One party carried most of it. Every final poll except the CIS's had the PSOE too low, by between 2.3 and 5.4 points, and the shared part of the PSOE's error, the square of the industry error as a share of the average squared poll error, was 91%. No choice of pollster would have avoided it.
The gap tells the political story. The polls had the PP 5.7 points ahead of the PSOE; it finished 1.4 ahead, a gap error of \(+4.3\). On the polls, the PP and Vox looked close to 176 seats. They won 170. The CIS, which had the PSOE ahead, was the closest poll in 2023, four years after its November 2019 final poll had been the second furthest from the result.
The record, 2004–2023
The table below applies the same calculation to all eight elections. It is computed from the database each time the page is built.
| Party | 2004 | 2008 | 2011 | 2015 | 2016 | April 2019 | November 2019 | 2023 | Average |
|---|---|---|---|---|---|---|---|---|---|
| PP | +4.8 | −0.3 | +1.7 | −0.8 | −2.9 | +3.6 | −0.1 | +1.0 | +0.9 |
| PSOE | −5.2 | −1.7 | +2.5 | −1.5 | −1.4 | +0.6 | −0.4 | −3.3 | −1.3 |
| Sumar (and predecessors) | +1.2 | +1.2 | −1.0 | −3.1 | +3.7 | −1.8 | +0.9 | +1.0 | +0.3 |
| ERC | −0.5 | +0.8 | 0.0 | −0.3 | – | −0.7 | +0.2 | +0.2 | 0.0 |
| Junts | +0.1 | −0.2 | −0.9 | −0.2 | – | −0.5 | −0.6 | +0.3 | −0.3 |
| PNV | +0.1 | +0.3 | −0.1 | 0.0 | – | −0.2 | −0.1 | +0.1 | 0.0 |
| EH Bildu | – | – | −0.3 | +0.3 | – | −0.1 | – | −0.1 | −0.1 |
| Cs | – | – | – | +5.5 | +1.2 | −1.1 | +2.5 | – | +2.0 |
| CC | +0.1 | – | 0.0 | – | – | −0.2 | – | – | 0.0 |
| Vox | – | – | – | – | – | +0.6 | −2.6 | +0.7 | −0.4 |
| BNG | +0.4 | – | +0.1 | – | – | – | – | – | +0.2 |
Four points stand out.
2004 was different. Every final poll had the PP ahead, by between 2.2 and 6.7 points; the PSOE won by 5.4. The PSOE's industry error was −5.3 and the PP's +4.8, the largest two figures in the table. The election came three days after the bombings of 11 March in Madrid, and the last legal polls had closed fieldwork before them. Whatever share of that miss was late movement, no poll could have measured it.
2016 was the other industry miss. Every one of 22 final polls had Unidos Podemos too high, by between 2.3 and 5.0 points, and every one had the PP too low, by between 1.5 and 4.3. The shared part of each error was more than 90%. Six months earlier, the polls had understated Podemos and its allies by 3.1 points.
No party has a steady lean. The PSOE's mean is −1.3, but it was overstated in 2011 and April 2019. Without 2004 its mean is −0.7. The PP was overstated in 2004, 2011, April 2019 and 2023 and understated in 2008, 2015, 2016 and November 2019. The left lineage has been overstated five times and understated three. Ciudadanos, the one party overstated at three of its four elections (by 5.5 points in 2015), did not stand in 2023 and is not in today's model. Vox was understated by 2.6 points in November 2019 and slightly overstated either side of it.
The regional parties are polled well. ERC, Junts, the PNV and EH Bildu have been missed by less than a point at every election, and their mean errors are within 0.3 of zero. Their shares are small, so a small error in points is not small in proportion, but there is no sign of a bias.
Using equation (4), the summary for the larger parties is:
| Party | Elections | Mean error | RMS error | Share of RMS² that is bias |
|---|---|---|---|---|
| PSOE | 8 | −1.30 | 2.54 | 26% |
| PP | 8 | +0.88 | 2.48 | 12% |
| Sumar (and predecessors) | 8 | +0.26 | 2.01 | 2% |
| Vox | 3 | −0.43 | 1.59 | 7% |
| Ciudadanos | 4 | +2.02 | 3.13 | 42% |
Table: Summary of industry errors, 2004–2023, points. Computed from the errors in the table above as rounded there. The last column is \(\bar{e}_p^2 / \text{RMS}_p^2\).
For the PP and the left lineage almost all of the error is variation from one election to the next. For the PSOE about a quarter is bias, and most of that is 2004; without it the PSOE's RMS falls from 2.54 to 1.88. This is the pattern that makes correction fail: the steady part of the error is small, and much of it belongs to one election held in exceptional circumstances.
Shared and pollster-specific error
As in Measuring British polling error in England, 2015–2024, the average squared poll error at an election splits exactly into the square of the industry error and the spread of the polls around their average:
The share of the first term is the part of the miss common to the industry. For the largest misses it is high: 97% for the PSOE and 98% for the PP in 2004, 96% for Unidos Podemos and 94% for the PP in 2016, 91% for the PSOE in 2023 and 91% for Ciudadanos in November 2019. Where the industry was close on average the shared part is small: 18% for the PP and 21% for Vox in 2023, where the polls scattered on both sides. The large Spanish misses were shared by almost every pollster; averaging more polls does nothing to reduce them.
The gap between the two largest parties
| Election | Top two | Real gap | Polls' gap error | Worst poll |
|---|---|---|---|---|
| 2004 | PSOE, PP | 5.4 | −10.0 | −12.1 |
| 2008 | PSOE, PP | 4.4 | −1.4 | −7.3 |
| 2011 | PP, PSOE | 15.3 | −0.8 | −4.0 |
| 2015 | PP, left lineage | 3.9 | +2.3 | +6.6 |
| 2016 | PP, PSOE | 9.9 | −1.5 | −3.5 |
| April 2019 | PSOE, PP | 12.0 | −3.1 | −7.7 |
| November 2019 | PSOE, PP | 7.2 | −0.4 | +6.9 |
| 2023 | PP, PSOE | 1.4 | +4.3 | +7.5 |
Table: Gap between the two largest parties, points. In 2015 the second place belongs to the left lineage (Podemos and its allies plus IU); the PSOE, second among single lists, finished 6.3 points behind the PP.
2004 is the one election at which the average put the wrong party first. At every later election it got the order right, but 2023 shows how much the size of the gap matters in a fragmented Congreso: a four-point error in the lead turned a result that looked like a PP–Vox majority into one six seats short.
Pollster by pollster
Each pollster's record is the average miss per party of its own final polls, over the elections it covers. The table lists pollsters with three or more; the track record page lists all of them.
| Pollster | Elections | Average miss per party |
|---|---|---|
| IMOP Insights | 3 | 0.83 |
| Noxa Consulting | 3 | 0.83 |
| SocioMétrica | 3 | 0.89 |
| 40dB. | 3 | 1.04 |
| Ipsos | 5 | 1.12 |
| GAD3 | 6 | 1.15 |
| Sigma Dos | 8 | 1.23 |
| Sondaxe | 7 | 1.30 |
| Celeste-Tel | 7 | 1.31 |
| NC Report | 6 | 1.34 |
| Metroscopia | 5 | 1.42 |
| Hamalgama Métrica | 5 | 1.49 |
| CIS | 8 | 1.54 |
| Demoscopia y Servicios | 3 | 1.57 |
| Simple Lógica | 7 | 1.58 |
| TNS Demoscopia | 3 | 1.84 |
| DYM | 6 | 1.86 |
| GESOP | 6 | 1.96 |
| Invymark | 5 | 2.20 |
Table: Average miss per party of each pollster's final polls, 2004–2023, points, pollsters with three or more elections.
The same two cautions apply as elsewhere. The records cover different elections: a pollster with a 2004 or 2016 final poll carries an industry miss that a newer pollster never faced. And the differences between pollsters are small next to the differences between elections. The CIS's record shows both: the closest final poll in 2023, the second furthest in November 2019 (when it had the PSOE at 32.2% against 28.0% and Vox at 7.9% against 15.1%), and a fieldwork end weeks before most of its rivals at several elections.
The pollster ratings (Rating Spanish pollsters: accuracy, the lead and openness and the ratings page) use these records, pulled towards the record of a poor pollster so that one good election cannot earn a high score, alongside the gap error and how much each pollster publishes.
Why the record is not used to correct
Our rule, the same in every country, takes off half the average miss and keeps the correction only if it would have improved past forecasts, each election predicted without knowing its own result. In Spain it would not: correcting was further out at 5 of eight elections and worse on average, because an error that changes sign cannot be predicted from its own mean. Reading Spanish polls: the correction test and the CIS's raw figures reports the test. The record is used instead to set the size of the uncertainty in the simulation (Simulating Spanish polling error: where the chances come from).
The long view
Eight elections are few. To see whether they are typical, we collected every earlier final poll we could source, back to the first elections of 1977.
| Election | Final polls | Average miss per party | Biggest miss |
|---|---|---|---|
| 1977 | 2 | 2.85 | PSOE −12.0 |
| 1979 | 3 | 1.38 | PSOE +2.7 |
| 1982 | 3 | 1.66 | PP −5.6 |
| 1986 | 11 | 1.03 | PSOE −2.9 |
| 1989 | 7 | 0.95 | PP −2.8 |
| 1993 | 10 | 1.01 | PSOE −5.0 |
| 1996 | 9 | 1.49 | PSOE −4.0 |
| 2000 | 10 | 0.81 | PP −2.4 |
| 2004 | 9 | 1.55 | PSOE −5.2 |
| 2008 | 11 | 0.74 | PSOE −1.7 |
| 2011 | 17 | 0.74 | PSOE +2.5 |
| 2015 | 21 | 1.45 | Cs +5.5 |
| 2016 | 22 | 2.28 | Sumar (and predecessors) +3.7 |
| April 2019 | 18 | 0.95 | PP +3.6 |
| November 2019 | 20 | 0.92 | Vox −2.6 |
| 2023 | 22 | 0.85 | PSOE −3.3 |
Before 2004 every figure is grade C, keyed from Wikipedia's tables, and so are the results for 1977, 1979, 1982 and 1989 (The Spanish data: results, maps, statistics, deputies and polls). With that caution, the long view says two things. Misses of three to five points on one of the two large parties were common before 2004: the PSOE was understated by 5.0 points in 1993 and 4.0 in 1996, and the 1977 figures are rough. And the average miss per party has not grown: apart from 2016, the elections since 2008 sit at the low end of the range. The long view adds no evidence of a steady lean in either direction.
Limits
Eight elections. Every summary here rests on eight numbers per party, three for Vox. A ninth election like 2004 or 2016 would change the RMS sharply.
Secondary sources. Most final polls are transcriptions. They agree with the checks we could make, but agreement with a secondary source is not the same as the pollster's own table.
Lineages. Measuring the left as one lineage makes a long record possible, at the cost of treating Podemos in 2015 and Sumar in 2023 as the same thing. The alternative is no record at all.
The ban. Final polls end about ten days out. Part of each miss is late movement, and in 2004 possibly most of it. The record measures the polls available to a reader on the last legal day, which is what our forecast would face, not the accuracy of polling as a technique.
Final polls only. These errors say nothing directly about a poll taken a year before an election; that is the subject of From today to polling day in Spain.
References
Jennings, W. and Wlezien, C. (2018). Election polling errors across time and space. Nature Human Behaviour, 2(4), 276–283.
Ley Orgánica 5/1985, de 19 de junio, del Régimen Electoral General (LOREG), articles 69.7 and 96.5.
Shirani-Mehr, H., Rothschild, D., Goel, S. and Gelman, A. (2018). Disentangling bias and variance in election polls. Journal of the American Statistical Association, 113(522), 607–614.
How to cite
Polling Forecast (2026). Measuring Spanish polling error, 2004–2023. Retrieved 21 November 2026 from https://www.pollingforecast.com/research/spain-polling-error. Live figures change as new polls arrive; the date above is when the text was last revised.