Forecasting the Congreso from imperfect polls: an overview
Abstract. The Spain section forecasts the next general election with the rule used for Great Britain: take half the average past miss off today's polls, but only where that would have improved past forecasts made without knowing the result. Spanish final polls fail that test and are taken as published. The seats are decided by D'Hondt in 52 provinces, most of them small, and our calculation reproduces all 350 seats of 2023. This paper sets out the evidence, the seat model, the sources of uncertainty and what the forecast does not claim, and maps the other Spain papers.
Summary
This paper is the way into the Spain section of Polling Forecast. It says what the section forecasts, why the rule that corrects British polls leaves Spanish polls as they are, what decides seats in the Congreso de los Diputados, and how the uncertainty is measured. The last section is a guide to the other Spain papers, each of which takes one part of the forecast and treats it in full.
The short version is this. Spanish final polls have missed by about a point per party at the eight general elections since 2004, but not the same way twice, and a correction learned from past misses would have been further from the result at 5 of the eight. Seats depend less on the national average than on arithmetic in 52 provinces. Most of them elect five deputies or fewer, and there the D'Hondt rule gives the largest parties more than their share and leaves small national parties with little or nothing. The forecast therefore takes the polls as published, runs them through the seat law province by province (a calculation that reproduces all 350 seats of 2023 from the official votes), and spends its effort on the uncertainty in the last seat of each province.
What has changed since this paper was written
Updated 9 November 2026. The rest of the paper is as first published, except where a sentence below says it was corrected.
- An early election (5 October). Pedro Sánchez dissolved the Cortes; the general election is on Sunday 29 November 2026. The forecast, the election-day model and the days-to-go figures use that date, and polls may not be published from 00:00 on 24 November (Madrid time) until the polls close.
- Frente Amplio (16 October). Since the left alliance Frente Amplio (Broad Front) registered on 16 October, pollsters publish figures for it. A change in Wikipedia's poll table stopped Spanish polls loading from 11 October; the reader was fixed on 26 October and the missing polls added.
- Only elections from 2000 shape the forecast (28 September). Earlier elections stay in the long view and on the history pages but no longer feed any test, correction or error size. In Spain nothing before 2000 was used, so nothing changed.
- Our figures beside the polls (26 October). The correction is off in Spain, so our projected shares are the poll average, and the pages say so rather than repeating the figures.
- Pollster grades rescaled (13 October) (Rating Spanish pollsters: accuracy, the lead and openness).
- When the polls missed (2 November): The sorpasso that never came: Spain's June 2016 polling miss and The majority that wasn't: Spain's 2023 polling miss and the CIS outlier.
- The map (November). The map can be coloured by any census figure; each census figure also has its own page (census maps). It can also replay a past polling miss ("The polls miss again") or take a vote you set.
What the Spain section forecasts
The forecast is for the next election to the Congreso de los Diputados, the lower house of the Cortes Generales. The current Cortes were elected on 23 July 2023 for four years. The site uses 29 November 2026 as the latest possible polling day. The Prime Minister can dissolve the Cortes earlier, and has done so before: the elections of April 2019 and 2023 were both called early.
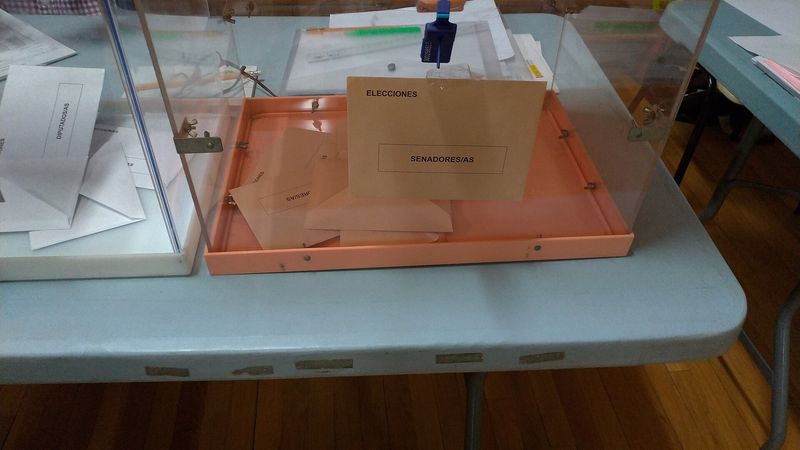
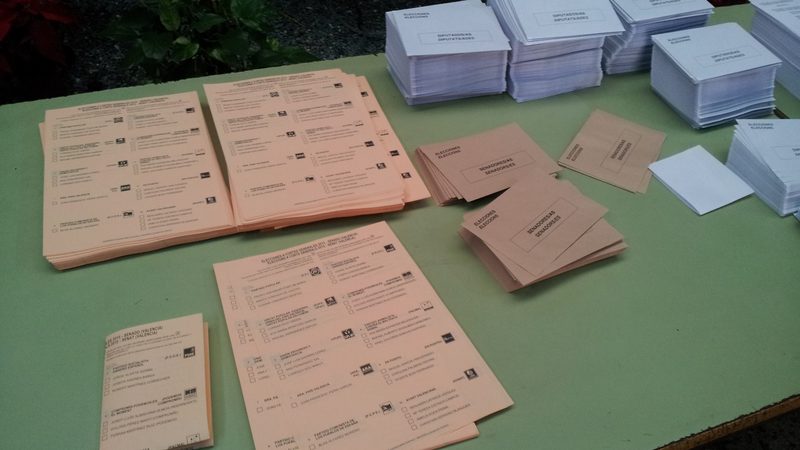
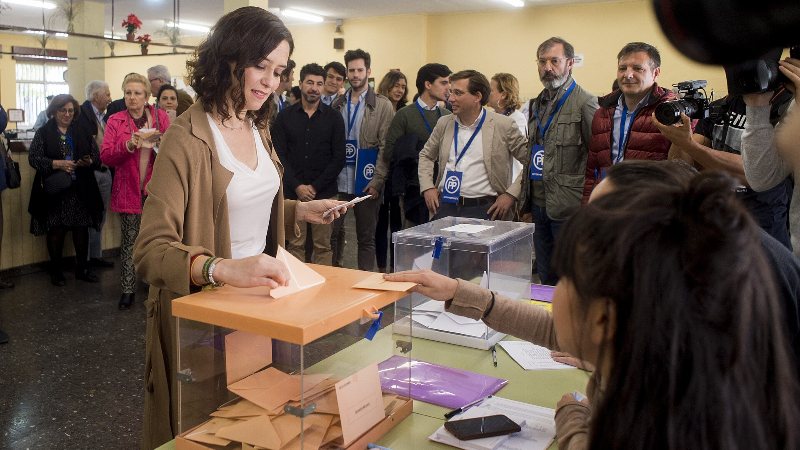
Voters choose one closed list in their province. The Congreso has 350 seats: 348 shared among 50 provinces by D'Hondt, and one each for Ceuta and Melilla, won by the list with the most votes. A majority is 176. That number matters in two ways. A candidate for Prime Minister needs 176 votes at the first investiture ballot, or more yes than no votes at the second, so a government can be formed with fewer than 176 deputies if enough others abstain. And no party has won 176 seats on its own since 2011, so the question after every election is which combination of parties can invest a Prime Minister.
The section answers five questions, each on its own page:
- How many seats would each party win if the election were held today? (The home page, and the provinces and comunidades pages.)
- Which party takes the last seat in each province, and how close is the party next in line?
- What is the chance that each combination of parties reaches 176?
- What changes if the polls miss the way they did at a past election? (The what-if page.)
- How different could the result be on polling day, which may be months away? (The election-day page.)
The headline, as of 19 November 2026, is below. It is built from the latest poll of each of 21 pollsters, and every figure in it is recomputed from the database whenever the page is built.
| Party | Polls | Seats | 80% range | 2023 | Wins a seat |
|---|---|---|---|---|---|
| PP | 30.8 | 130 | 116–142 | 137 | over 99% |
| PSOE | 27.6 | 115 | 101–127 | 121 | over 99% |
| Vox | 19.0 | 67 | 59–78 | 33 | over 99% |
| ERC | 2.5 | 11 | 8–13 | 7 | over 99% |
| EH Bildu | 1.5 | 8 | 6–10 | 6 | over 99% |
| Sumar | 6.1 | 7 | 5–14 | 31 | over 99% |
| Junts | 1.3 | 5 | 1–8 | 7 | 95% |
| PNV | 0.8 | 4 | 2–6 | 5 | over 99% |
| BNG | 1.0 | 2 | 2–5 | 1 | 97% |
| CC | 0.4 | 1 | 0–2 | 1 | 73% |
| SALF | 2.0 | 0 | 0–0 | – | 6% |
| Podemos | 1.5 | 0 | 0–0 | – | 8% |
On these polls the largest party would be the PP, with 130 seats. The "Wins a seat" column is the share of simulated elections in which the party wins at least one seat. For the large parties it is close to certain. For parties that stand in one or two provinces, or that are spread thinly across all of them, it is the most useful number on the page.
One rule for every country
The British forecast starts from a finding: at every general election from 2015 to 2024, England's final polls missed in fairly steady directions, and a correction built from those misses would have brought the forecast closer to the result (see Forecasting a British general election when the polls are wrong: an overview and Correcting the raw answers: the method behind our UK projection). The rule we took from that work is the same in every country, and it is deliberately simple.
For each party \(p\) and past election \(t\), let \(e_{p,t}\) be the average of the final polls minus the result, in points. A positive value means the polls overstated the party. The correction takes off half of the average past miss:
where \(y_p\) is today's poll average, followed by a rescale so the shares keep the same total. A party is corrected only if it has been measured at two or more elections.
The rule is kept only if it passes a test. Each past election is predicted with the correction learned from the other elections alone (leave-one-out cross-validation; Stone, 1974), and the correction stays only if its average miss per party beats the uncorrected polls by more than 0.01 points. In England it passes. In Spain it does not.
Why Spanish polls are not corrected
The table below is the evidence: the average of the final polls minus the result, party by party, at each general election since 2004. The left of the PSOE is measured as one lineage (Izquierda Unida, then Podemos and its regional allies, Unidas Podemos, Más País and Sumar), because the parties in it have merged and split from one election to the next.
| Party | 2004 | 2008 | 2011 | 2015 | 2016 | April 2019 | November 2019 | 2023 | Average |
|---|---|---|---|---|---|---|---|---|---|
| PP | +4.8 | −0.3 | +1.7 | −0.8 | −2.9 | +3.6 | −0.1 | +1.0 | +0.9 |
| PSOE | −5.2 | −1.7 | +2.5 | −1.5 | −1.4 | +0.6 | −0.4 | −3.3 | −1.3 |
| Sumar (and predecessors) | +1.2 | +1.2 | −1.0 | −3.1 | +3.7 | −1.8 | +0.9 | +1.0 | +0.3 |
| ERC | −0.5 | +0.8 | 0.0 | −0.3 | – | −0.7 | +0.2 | +0.2 | 0.0 |
| Junts | +0.1 | −0.2 | −0.9 | −0.2 | – | −0.5 | −0.6 | +0.3 | −0.3 |
| PNV | +0.1 | +0.3 | −0.1 | 0.0 | – | −0.2 | −0.1 | +0.1 | 0.0 |
| EH Bildu | – | – | −0.3 | +0.3 | – | −0.1 | – | −0.1 | −0.1 |
| Cs | – | – | – | +5.5 | +1.2 | −1.1 | +2.5 | – | +2.0 |
| CC | +0.1 | – | 0.0 | – | – | −0.2 | – | – | 0.0 |
| Vox | – | – | – | – | – | +0.6 | −2.6 | +0.7 | −0.4 |
| BNG | +0.4 | – | +0.1 | – | – | – | – | – | +0.2 |
Averaged over the eight elections, the polls seem to understate the PSOE by about a point and overstate the PP by a little less. Neither holds up. The PSOE's average owes most to two elections: 2004, when the vote came three days after the Madrid train bombings of 11 March and every final poll still had the PP ahead, and 2023, when all but one of 22 final polls had the PSOE too low. In between it was overstated in 2011 and April 2019 and understated in 2008, 2015, 2016 and November 2019. The PP was overstated four times and understated four times. The left lineage swung from 3.1 points too low in 2015 to 3.7 points too high in 2016, six months later.
A correction built on errors like these subtracts the noise of the last twenty years from today's polls. The test shows what that does:
| Election | Polls' average miss | Corrected, leave one out | Verdict |
|---|---|---|---|
| 2004 | 1.55 | 1.50 | closer |
| 2008 | 0.74 | 0.75 | level |
| 2011 | 0.74 | 0.78 | further out |
| 2015 | 0.87 | 0.90 | further out |
| 2016 | 2.65 | 2.72 | further out |
| April 2019 | 0.93 | 1.02 | further out |
| November 2019 | 0.69 | 0.76 | further out |
| 2023 | 0.85 | 0.77 | closer |
| Average | 1.13 | 1.15 |
Correcting was closer at 2 of the eight elections and further out at 5, and worse on average: 1.15 points per party against 1.13 for the polls as published. So our projection for Spain is the poll average, uncorrected. This is the same rule reaching a different verdict, not a different rule. Reading Spanish polls: the correction test and the CIS's raw figures sets out the test in full.
The finding matches what Jennings and Wlezien (2018) report across many countries: polling errors are real, but for most parties they do not persist from one election to the next enough to predict.
The raw figures
In Britain the steadiest errors are in what respondents say before the pollster adjusts their answers, which is why our British forecast starts there (Why we start from British pollsters' raw answers rather than the published headline). In Spain one pollster publishes both: the Centro de Investigaciones Sociológicas (CIS), a public body, prints its "voto directo" (the party respondents name) beside its "estimación de voto" (its estimate of the result). We compared both with the result at seven elections.
| Election | Parties | Direct vote | Estimate | Direct vote closer |
|---|---|---|---|---|
| 2004 | 8 | 1.65 | 1.93 | 6/8 |
| 2008 | 8 | 1.75 | 1.01 | 3/8 |
| 2011 | 9 | 0.69 | 0.66 | 2/9 |
| 2015 | 11 | 1.12 | 1.15 | 5/11 |
| 2016 | 9 | 1.68 | 1.28 | 4/9 |
| November 2019 | 12 | 2.03 | 1.77 | 3/12 |
| 2023 | 11 | 0.81 | 0.65 | 3/11 |
| Average | 1.39 | 1.21 |
The estimate was closer on average, and at five of the seven elections. The direct vote cannot simply be used instead, because it is a share of everyone asked, including the undecided and those who will not vote, and even when rescaled to those who name a party it missed by more. Reading Spanish polls: the correction test and the CIS's raw figures and Rating Spanish pollsters: accuracy, the lead and openness give the details.
What decides the seats
If the average is left alone, the forecast has to earn its keep elsewhere. In Spain that is in the arithmetic of the provinces.
Small provinces
Seats are shared within each of the 52 provinces, not nationally. Each province has a minimum of two seats and the rest follow population, so Madrid elects 37 deputies and Soria 2. 29 of the 52 provinces elect five or fewer.
| Seats in the province | Provinces | Seats | Share of the Congreso |
|---|---|---|---|
| 1 (Ceuta, Melilla) | 2 | 2 | 1% |
| 2–3 | 9 | 26 | 7% |
| 4–5 | 18 | 80 | 23% |
| 6–9 | 16 | 112 | 32% |
| 10–19 | 5 | 61 | 17% |
| 20 or more | 2 | 69 | 20% |
In a province with three seats, a party needs roughly a quarter of the vote to be sure of one. A national party polling 6% wins nothing there, and a party polling 30% nationally can take two of the three. D'Hondt is also the divisor rule that most favours large parties. Added up over 52 provinces, these effects give the two largest parties a bonus and leave the third and fourth national parties short. In 2023 the PP won 33.1% of the vote and 39.1% of the seats, and Sumar won 12.3% of the vote and 8.9% of the seats.
| Party | 2023 votes | 2023 seats | Votes today | Seats today |
|---|---|---|---|---|
| PP | 33.1 | 39.1 | 30.8 | 37.1 |
| PSOE | 31.7 | 34.6 | 27.6 | 32.9 |
| Vox | 12.4 | 9.4 | 19.0 | 19.1 |
| Sumar | 12.3 | 8.9 | 6.1 | 2.0 |
| ERC | 1.9 | 2.0 | 2.5 | 3.1 |
| SALF | – | – | 2.0 | 0.0 |
| Podemos | – | – | 1.5 | 0.0 |
| EH Bildu | 1.4 | 1.7 | 1.5 | 2.3 |
| Junts | 1.6 | 2.0 | 1.3 | 1.4 |
| BNG | 0.6 | 0.3 | 1.0 | 0.6 |
| PNV | 1.1 | 1.4 | 0.8 | 1.1 |
| CC | 0.5 | 0.3 | 0.4 | 0.3 |
| UPN | 0.2 | 0.3 | 0.0 | 0.0 |
The last seat
In most provinces the seats are settled well before the last one. The last seat is where the forecast turns. At any moment a handful of provinces have a party less than a point short of taking it from another:
| Province | Seats | Last seat | Next in line | Points short |
|---|---|---|---|---|
| Almería | 6 | PP | PSOE | 0.15 |
| Bizkaia | 8 | PSOE | EH Bildu | 0.20 |
| Barcelona | 32 | PP | Sumar | 0.24 |
| Palencia | 3 | Vox | PP | 0.42 |
| Ceuta | 1 | PP | Vox | 0.42 |
| Madrid | 37 | Vox | PP | 0.46 |
| Pontevedra | 7 | PP | PSOE | 0.47 |
| Alicante/Alacant | 12 | PP | Sumar | 0.53 |
| Zamora | 3 | PP | Vox | 0.56 |
| La Rioja | 4 | PSOE | Vox | 0.56 |
| Araba/Álava | 4 | PNV | PSOE | 0.58 |
| Navarra | 5 | EH Bildu | Vox | 0.67 |
| A Coruña | 8 | PSOE | PP | 0.68 |
| Girona | 6 | ERC | PP | 0.69 |
| Asturias | 7 | PSOE | Vox | 0.79 |
| Lleida | 4 | PSOE | ERC | 0.94 |
A national polling error of a point or two moves several of these at once, which is why the seat ranges on the home page are wider than a point or two of vote share would suggest.
The 3% line
Lists need 3% of the valid vote in a province (blank votes included) to share in its seats. In small provinces this rule never matters, because 3% is far below what any list needs to win a seat there. In practice it can bite only in the two largest, Madrid and Barcelona. The effective threshold everywhere else is the arithmetic of D'Hondt.
Sumar and Podemos
Sumar and Podemos stood as one list in 2023 and won 31 seats between them. They are polled apart now. Split, each needs a larger share of the vote in each province to win a seat on its own, and in most small provinces neither has it. Today's votes as one list would win more seats than the same votes as two:
| If they stand | Sumar | Podemos | Together | PSOE | PP | Vox |
|---|---|---|---|---|---|---|
| apart (our projection) | 7 | 0 | 7 | 115 | 130 | 67 |
| as one list | 11 | 0 | 11 | 114 | 127 | 67 |
On today's polls the split costs the two parties 4 seats between them. How the forecast handles the split, in the history and in the provinces, is set out in From votes to seats: D'Hondt in 52 provinces.
The forecast, step by step
The pipeline has seven steps. Each is stated briefly here and developed in its own paper.
Step 1: the average. Let \(J\) be the set of polls formed by taking the latest poll from each pollster whose fieldwork ended within 30 days of the newest poll in the database. The average for party \(p\) is
where \(J_p\) is the subset of \(J\) that reports the party. Each pollster counts once, so a pollster that publishes every week does not outweigh one that publishes every month. Shares are of the valid vote including blank votes, as Spanish pollsters publish them. The parties modelled are the PP, the PSOE, Vox, Sumar, Podemos, Se Acabó La Fiesta (SALF), ERC, Junts, EH Bildu, the PNV, the BNG, Coalición Canaria and UPN; everything else, blank votes included, is "others".
Step 2: our reading. Equation (1) with the correction switched off, because it fails the test. Our projection is \(\hat{v}_p = y_p\).
Step 3: provinces. Each party's 2023 share in each province is multiplied by the ratio of its national share today to its national share in 2023, and the province's shares are rescaled to 100. This is proportional swing. Sumar's 2023 vote in each province is split between Sumar and Podemos in their national ratio today. SALF, which did not stand in 2023, gets its national share in every province.
Step 4: seats. In each province, D'Hondt among lists with at least 3% of the valid vote, with the 2023 number of seats per province. Given the official 2023 votes, the calculation reproduces the official result in all 52 provinces. From votes to seats: D'Hondt in 52 provinces gives the details.
Step 5: simulation. In each of 2,000 simulated elections, every party's national share is moved by a random error whose size is its typical final-poll miss, each party in each province gets a small random local change, and steps 3 and 4 are run again. Ranges, the chance of winning a seat and the chance of each combination reaching 176 are counted across the runs. Simulating Spanish polling error: where the chances come from describes the design.
Step 6: replays. Today's polls are replayed with each past election's miss and the seats worked out again (If we're wrong: replaying past Spanish polling misses on today's polls).
Step 7: polling day. The election-day forecast adds uncertainty for the time left. In Britain it also pulls the older parties back towards their last result; in Spain that pull-back failed its test, so the shares are taken as they stand and only the ranges widen. From today to polling day in Spain gives the evidence.
The uncertainty
The simulation gives three kinds of answer.
The first is the seat range: the band within which a party's seats fell in the middle 80% of simulated elections.
The second is the chance of each combination reaching 176.
| Combination | Seats | Majority |
|---|---|---|
| PP + Vox | 197 | 99% |
| PP + Vox + UPN + CC | 198 | 99% |
| PSOE + Sumar + Podemos | 122 | 0% |
| Sánchez's 2023 investiture bloc | 153 | 1% |
| PP + PSOE | 245 | over 99% |
The combinations are arithmetic, not predictions. "Sánchez's 2023 investiture bloc" is the set of parties whose deputies voted to invest Pedro Sánchez in November 2023; how each of them would vote at the next investiture is not something seat counts can show. "PP + PSOE" has never governed Spain together and is shown because the two largest parties' combined seats set the scale for everyone else.
The third is the province picture. Beside the simulation, the site replays today's polls with each past election's polling miss and works out every seat again; 37 of the 52 provinces change at least one seat under at least one of those eight replays (If we're wrong: replaying past Spanish polling misses on today's polls).
On polling day the uncertainty is larger. At the latest possible date, 8 days after the most recent poll, polls this far out have missed each party by about 0.4 points by the time votes were cast, and the ranges on the election-day page are correspondingly wider.
What we do not claim
We do not claim that Spanish polls are free of bias. They missed the PSOE by more than three points in 2023 and the left lineage by nearly four in 2016. We claim only that the direction of the next miss has not been predictable from the last eight, so correcting for it would not have helped.
We do not claim province-level precision. Proportional swing from 2023 ignores candidates, regional campaigns and local pacts, and assumes that each party's vote moves by the same proportion in every province.
We do not forecast regional lists that were not on the 2023 ballot. A new provincial or regional party would sit in "others", which never wins seats in the model.
We do not claim that the "today" forecast predicts polling day. It answers a hypothetical question. The election-day forecast answers the real one, with much wider uncertainty.
We do not forecast who will be invested. The site counts seats. An investiture depends on abstentions and on bargains that seat counts cannot show.
Finally, eight elections are few, and one of them, 2004, followed an attack that changed the campaign in its last three days. What we don't know yet: limitations of the Spanish forecast collects these points in one place.
A guide to the papers
The Spain library has ten papers. This one, Forecasting the Congreso from imperfect polls: an overview, is the introduction. The others are listed in roughly the order in which the forecast uses them.
Measuring Spanish polling error, 2004–2023 sets out the evidence on which everything else rests: the final polls at the eight general elections from 2004 to 2023, how they were chosen under the five-day publication ban and how their sources were graded, the error party by party, the error on the gap between the two largest parties, each pollster's record, the Sumar lineage and the long view back to 1977.
Reading Spanish polls: the correction test and the CIS's raw figures is the core methods paper. It applies the correction rule of equation (1), reports the leave-one-out test that rejects it, compares the CIS's direct vote with its estimate, and summarises the rest of the forecast.
From votes to seats: D'Hondt in 52 provinces covers the seat calculation: the LOREG, the apportionment of seats to provinces, D'Hondt and its bias, the 3% line, the check against 2023, and how provincial shares are projected from national polls, including the Sumar and Podemos split.
Simulating Spanish polling error: where the chances come from explains where the chances come from: the 2,000 simulated elections, the error drawn for each party, the provincial noise, the chance of winning a seat, the seat ranges and the combinations.
From today to polling day in Spain asks how far Spanish polls move before polling day, using polls at six fixed distances before five general elections from 2011 to 2023, and explains why the British pull-back failed the same test in Spain.
If we're wrong: replaying past Spanish polling misses on today's polls describes the alternative readings of today's polls: the polls as they stand and each past election's miss replayed, all run through the same seat calculation.
Rating Spanish pollsters: accuracy, the lead and openness describes the pollster ratings out of 100, on the same scale as the British ones, and the CIS's place among them.
The Spanish data: results, maps, statistics, deputies and polls documents where every number comes from: the Junta Electoral Central's results in the Boletín Oficial del Estado, the IGN's boundaries, the INE's statistics, the CIS's studies, pollsters' and newspapers' releases, and Wikipedia's tables where no primary source could be read.
What we don't know yet: limitations of the Spanish forecast collects every known weakness of the Spanish forecast in one place and says what would address it.
References
Constitución Española (1978), articles 68 and 99.
Jennings, W. and Wlezien, C. (2018). Election polling errors across time and space. Nature Human Behaviour, 2(4), 276–283.
Ley Orgánica 5/1985, de 19 de junio, del Régimen Electoral General (LOREG), articles 69.7, 162 and 163.
Real Decreto 400/2023, de 29 de mayo, de disolución del Congreso de los Diputados y del Senado y de convocatoria de elecciones.
Stone, M. (1974). Cross-validatory choice and assessment of statistical predictions. Journal of the Royal Statistical Society: Series B, 36(2), 111–147.
How to cite
Polling Forecast (2026). Forecasting the Congreso from imperfect polls: an overview. Retrieved 21 November 2026 from https://www.pollingforecast.com/research/spain-overview. Live figures change as new polls arrive; the date above is when the text was last revised.