
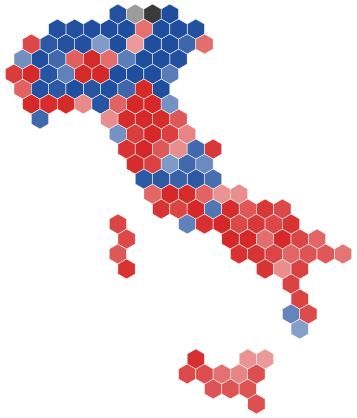
New electoral law Our forecast now uses Italy's new electoral law, approved on 8 October 2026: no single-member seats, and 70 extra deputies and 35 extra senators for a coalition that comes first with 42% of the vote. The maps show which coalition leads in each former collegio; those are no longer seats. What changed →
Your polling error
Loading…
Loading…
Former collegi where the leader changes (not seats under the new law)
Loading…
How big is a realistic polling error?
The biggest miss here: the polls had M5S 10.4 points too low (2013). On average they have put M5S 5.7 points too low, and our forecast allows for that.
| Party | 2001 5 polls | 2006 6 polls | 2008 15 polls | 2013 18 polls | 2018 17 polls | 2022 21 polls | Average | We adjust |
|---|---|---|---|---|---|---|---|---|
| FdI | – | – | – | −0.1 | +0.4 | −1.2 | −0.3 | +0.1 |
| PD | −1.4 | +1.0 | −0.2 | +4.7 | +3.9 | +2.4 | +1.7 | −0.9 |
| M5S | – | – | – | −10.4 | −4.8 | −2.0 | −5.7 | +2.9 |
| Lega | +0.5 | −0.4 | −3.0 | +1.1 | −3.8 | +3.3 | −0.4 | +0.2 |
| FI | −1.7 | −2.2 | +1.5 | −1.8 | +2.4 | −0.4 | −0.4 | +0.2 |
| AVS | – | – | – | +0.9 | +2.3 | 0.0 | +1.0 | −0.5 |
Average of each pollster's final poll minus the result, in points. + means the polls overstated the party, − that they understated it.
If the polls miss like a past election
Today's polls in Italy with each past election's polling error applied, through our seat model. Our forecast: Centre-left 224 of 400, a majority of 48.
| If the polls miss like | Largest party | Seats | Majority? | Leads change |
|---|---|---|---|---|
| 2001 | Centre-left | 223 | a majority of 46 | 5 |
| 2006 | Centre-right | 222 | a majority of 44 | 13 |
| 2008 | Centre-left | 220 | a majority of 40 | 8 |
| 2013 | Centre-left | 224 | a majority of 48 | 2 |
| 2018 | Centre-right | 220 | a majority of 40 | 12 |
| 2022 | Centre-left | 224 | a majority of 48 | 1 |
Figures as of . Published by Polling Forecast.



 United Kingdom
 France
 Germany
 Spain
 Netherlands
 Poland
 Canada
 Australia