
How we read Polish polls
How we turn Poland's polls into a forecast for the Sejm (460 seats, 231 for a majority): the 12 polls of the last 30 days, corrected for how Poland's final polls have missed before. Today's average: KO 32.6, PiS 22.0, Konfederacja 14.0, KKP 8.8.
Our rule everywhere: measure how far final polls missed at past elections, take off half the average miss, and keep the correction only if it would have made past forecasts better when each election is predicted without knowing its result. Then run the shares through the country's own electoral law.
Why we don't correct
Averaged over 2001–2023 the final polls missed by: PiS +0.8, KO +0.7, TD −1.4, Lewica +0.5, Konfederacja +0.3 points (positive = too high; parties by the list they led to in 2023). Predicting each election with the correction learned from the others was closer at only 3 of 7 elections (average miss per party 1.77 against 1.70 for the plain polls), so our projection takes the polls as they are. The test →
What decides the seats
- The national threshold. 5% of the national vote for a party list, 8% for a coalition list. A list under it wins nothing in any okręg, and its votes are wasted, which pushes everyone else's seats up.
- Who runs with whom. PSL and Polska 2050 poll 3.4% and 1.8%, against 5% each on their own or 8% together. Whether they join KO or stand alone can change the government's seats more than a typical polling error.
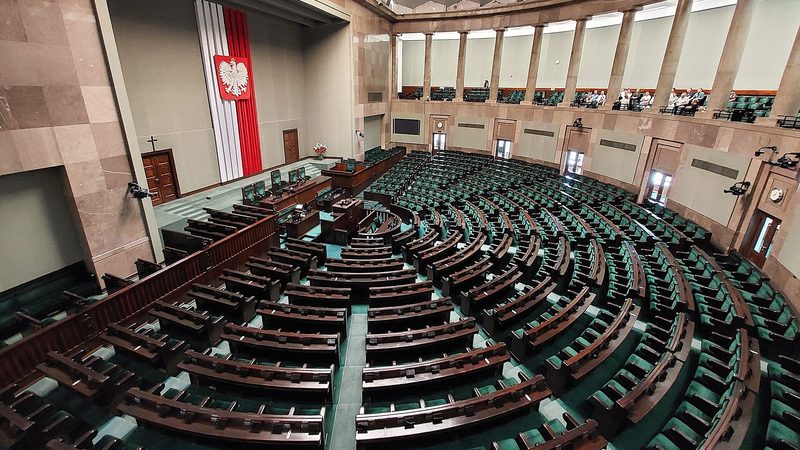
- D'Hondt in 41 okręgi. With 7 to 20 seats per okręg, the largest lists win a little more than their share.
- 231 and 276. 231 is a majority. A President hostile to the government can veto its laws, and 276 votes (three fifths) are needed to override him.
The votes since 2024
The test above learns only from Sejm elections. Since the 2023 Sejm election Poland has voted nationwide 4 times, and the final polls had PiS (or its candidate) too low every time, by 2.9 points on average. In Sejm elections PiS was on average 0.8 points too high.
| Vote | Final polls | PiS | KO | TD | Lewica | Konfederacja |
|---|---|---|---|---|---|---|
| The 2024 regional assemblies (sejmiki) | 6 | −4.7 | −1.2 | −2.1 | +1.6 | +2.8 |
| The 2024 European Parliament election | 8 | −3.0 | −1.9 | +3.5 | +1.8 | −0.9 |
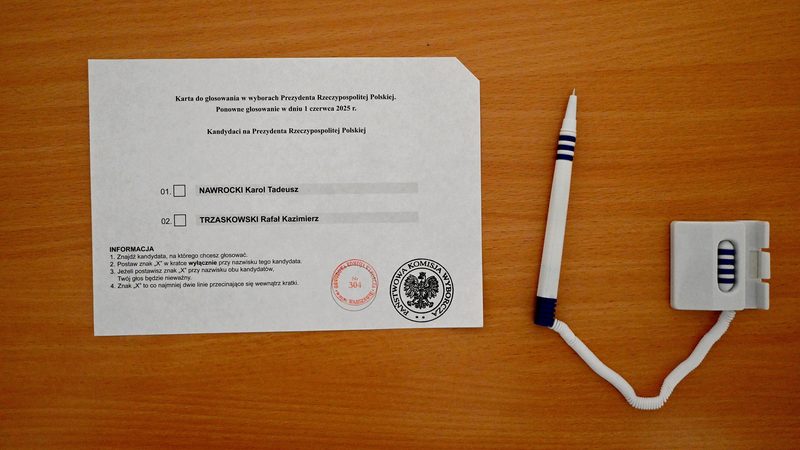
| Round one of the 2025 presidential election | 8 | −2.7 | +1.0 | +1.7 | +1.9 | −3.9 |
| The 2025 presidential run-off | 10 | −1.0 | +1.0 | – | – | – |
| Average | −2.9 | −0.3 | +1.0 | +1.7 | −0.7 |
Final poll average minus the result, points; minus means the polls had the party too low. Parties by the list they led to in 2023: Trzecia Droga is Polska 2050 in round one (PSL had no candidate), Lewica includes Razem, Konfederacja includes Braun's KKP. The run-off measures only the two candidates.
We do not add these votes to the Sejm test. A sejmik list vote or a presidential round is a different contest from a Sejm election: turnout differs, presidential polls ask about candidates rather than lists, and a sejmik vote turns partly on local candidates. Instead we show what they would mean, the way we treat other elections in every country: our rule (take off half the average miss) learned from these four votes in place of the Sejm elections, and each vote's miss replayed on today's polls. On that reading: KO 188, PiS 140, Konfederacja 71 seats, against KO 191, PiS 131, Konfederacja 73 in our projection. Every final poll at these votes →
- 50 final polls at seven Sejm elections (2001–2023). No final polls survive for 1991–1997 in the sources we checked.
- Official results by okręg for every election since 2001, from the Państwowa Komisja Wyborcza's files; presidential results for 2020 and 2025 by okręg, built from the powiat results.
- 190 poll averages at set distances before polling day (2011–2023), for the election-day test.
- GUS local data (Bank Danych Lokalnych) summed from powiaty to okręgi.
- Average: each pollster's latest poll within 21 days of the newest, equal weight per pollster. Most Polish pollsters publish a don't-know share inside the headline; we remove it and rescale the parties to 100 first.
- Correction: none: tested on past elections, the polls as published did at least as well without one. The history measures the 2023 lists, so today's splinters share their parent's correction in proportion: PiS with Rozwój Plus, Konfederacja with KKP, Lewica with Razem, PSL with Polska 2050 and Centrum.
- Okręgi: each 2023 list's okręg share scaled by the national change of the parties that came from it (proportional swing), then shared among them in their national ratio. The German minority keeps its 2023 vote, which only matters in Opole.
- Seats: the Kodeks wyborczy: lists with 5% of the national valid vote (8% for coalition committees; national-minority committees exempt, art. 196–197) share each okręg's seats by D'Hondt (art. 232), with the seats per okręg in force since 2011 (annex 1).
- Chances: 5,000 simulations; each party moves by its typical final-poll miss nationally (scaled to its size now) and a little more in each okręg, and the thresholds are checked on each simulated national result.
- Polling day: the same, with extra drift for the days left: rmse(days) = 2.27 + 0.75 × ln(days / 30).
Nobody knows yet who will run with whom; the lists are registered a few weeks before the vote. Our projection, the map and the tools use "Every party on its own list". The table counts the same shares under each line-up.
Every party on its own list (used)
No joint list has been agreed. PSL and Polska 2050 each need 5% on their own; so do Razem, Rozwój Plus and Braun's KKP. KO now registers as a party (Platforma took the name Koalicja Obywatelska in 2025), so 5% applies to it too.
| List | Share | Threshold | Seats |
|---|---|---|---|
| KO | 32.6 | 5% | 191 |
| PiS | 22.0 | 5% | 131 |
| Konfederacja | 14.0 | 5% | 73 |
| KKP | 8.8 | 5% | 41 |
| Lewica | 7.4 | 5% | 24 |
| Rozwój Plus | 4.7 | 5% | 0 |
| Razem | 4.3 | 5% | 0 |
| PSL | 3.4 | 5% | 0 |
| Polska 2050 | 1.8 | 5% | 0 |
Governing coalition: 215 seats.
PSL and Polska 2050 together again as Trzecia Droga
As in 2023: a coalition committee, so the pair needs 8% between them. Kosiniak-Kamysz has not ruled out renewing the pact with Polska 2050 (rp.pl, July 2026).
| List | Share | Threshold | Seats |
|---|---|---|---|
| KO | 32.6 | 5% | 191 |
| PiS | 22.0 | 5% | 131 |
| Konfederacja | 14.0 | 5% | 73 |
| KKP | 8.8 | 5% | 41 |
| Lewica | 7.4 | 5% | 24 |
| TD | 5.2 | 8% | 0 |
| Rozwój Plus | 4.7 | 5% | 0 |
| Razem | 4.3 | 5% | 0 |
Governing coalition: 215 seats.
Two government lists: KO with PSL and Polska 2050; Lewica alone
Nowa Lewica's plan reported in February 2026 (Gazeta Prawna/PAP): KO, PSL and Polska 2050 on one list, Lewica on another. Razem runs alone.
| List | Share | Threshold | Seats |
|---|---|---|---|
| KO + PSL + Polska 2050 + Centrum | 37.8 | 8% | 211 |
| PiS | 22.0 | 5% | 123 |
| Konfederacja | 14.0 | 5% | 66 |
| KKP | 8.8 | 5% | 39 |
| Lewica | 7.4 | 5% | 21 |
| Rozwój Plus | 4.7 | 5% | 0 |
| Razem | 4.3 | 5% | 0 |
Governing coalition: 232 seats.
One joint list of the governing coalition
The single list Tusk reportedly argued for in August 2026 (rp.pl): KO, PSL, Polska 2050, Centrum and Lewica together, as a coalition committee (8%). Razem runs alone.
| List | Share | Threshold | Seats |
|---|---|---|---|
| KO + Lewica + PSL + Polska 2050 + Centrum | 45.1 | 8% | 244 |
| PiS | 22.0 | 5% | 116 |
| Konfederacja | 14.0 | 5% | 63 |
| KKP | 8.8 | 5% | 37 |
| Rozwój Plus | 4.7 | 5% | 0 |
| Razem | 4.3 | 5% | 0 |
Governing coalition: 244 seats.
A joint list is given the sum of its parties' poll shares. In 2023 KO and Trzecia Droga both ran as coalition committees; in 2019 PSL and Kukiz'15 ran as one party list. Sources: context notes in our research files (rp.pl, Gazeta Prawna/PAP, 2026).
The seat rules applied to each election's official okręg votes, against the seats the PKW declared. Our count matches every seat at 6 of 6 elections. 2001 used a modified Sainte-Laguë count and is left out.
2023 ✓
| List | Vote | Threshold | PKW | Ours |
|---|---|---|---|---|
| PiS | 35.4 | 5% | 194 | 194 |
| KO | 30.7 | 8% | 157 | 157 |
| TD | 14.4 | 8% | 65 | 65 |
| Lewica | 8.6 | 5% | 26 | 26 |
| Konfederacja | 7.2 | 5% | 18 | 18 |
2019 ✓
| List | Vote | Threshold | PKW | Ours |
|---|---|---|---|---|
| PiS | 43.6 | 5% | 235 | 235 |
| KO | 27.4 | 8% | 134 | 134 |
| Lewica | 12.6 | 5% | 49 | 49 |
| PSL | 8.5 | 5% | 30 | 30 |
| Konfederacja | 6.8 | 5% | 11 | 11 |
| MN | 0.2 | exempt | 1 | 1 |
2015 ✓
| List | Vote | Threshold | PKW | Ours |
|---|---|---|---|---|
| PiS | 37.6 | 5% | 235 | 235 |
| PO | 24.1 | 5% | 138 | 138 |
| Kukiz'15 | 8.8 | 5% | 42 | 42 |
| .N | 7.6 | 5% | 28 | 28 |
| ZL | 7.5 | 8% | 0 | 0 |
| PSL | 5.1 | 5% | 16 | 16 |
| KORWiN | 4.8 | 5% | 0 | 0 |
| Razem | 3.6 | 5% | 0 | 0 |
| MN | 0.2 | exempt | 1 | 1 |
2011 ✓
| List | Vote | Threshold | PKW | Ours |
|---|---|---|---|---|
| PO | 39.2 | 5% | 207 | 207 |
| PiS | 29.9 | 5% | 157 | 157 |
| RP | 10.0 | 5% | 40 | 40 |
| PSL | 8.4 | 5% | 28 | 28 |
| SLD | 8.2 | 5% | 27 | 27 |
| MN | 0.2 | exempt | 1 | 1 |
2007 ✓
| List | Vote | Threshold | PKW | Ours |
|---|---|---|---|---|
| PO | 41.5 | 5% | 209 | 209 |
| PiS | 32.1 | 5% | 166 | 166 |
| LiD | 13.2 | 8% | 53 | 53 |
| PSL | 8.9 | 5% | 31 | 31 |
| MN | 0.2 | exempt | 1 | 1 |
2005 ✓
| List | Vote | Threshold | PKW | Ours |
|---|---|---|---|---|
| PiS | 27.0 | 5% | 155 | 155 |
| PO | 24.1 | 5% | 133 | 133 |
| Samoobrona | 11.4 | 5% | 56 | 56 |
| SLD | 11.3 | 5% | 55 | 55 |
| LPR | 8.0 | 5% | 34 | 34 |
| PSL | 7.0 | 5% | 25 | 25 |
| SDPL | 3.9 | 5% | 0 | 0 |
| MN | 0.3 | exempt | 2 | 2 |
2015 shows the 8% rule at work: Zjednoczona Lewica took 7.55% as a coalition and won nothing. 2023 Opole: the German minority, exempt from the threshold, had 25,778 votes, short of the 31,150 the last seat needed.
How the local model did
Our seats come from moving each list's last result in every okręg by its national change (proportional swing), then D'Hondt in each okręg among the lists over the national threshold. To test that step on its own, we took each past election, mapped every committee to the one it became (PO and Nowoczesna into KO, PSL and Kukiz'15 into PSL's Koalicja Polska of 2019 and then Trzecia Droga, Zjednoczona Lewica and Razem into Lewica, KORWiN and Braun into Konfederacja), moved each by its true national change since the election before, and gave out that election's real seats per okręg. As in the forecast, the German minority keeps its earlier vote. No polls are involved: this is the error the okręg step adds even when the national vote is known exactly.
| Projected from → to | Okręgi with every seat right | Seats given to the wrong list | Share error per list, points |
|---|---|---|---|
| 1993 → 1997 not used by the model | 6 / 52 | 63 / 391 | 3.0 |
| 2015 → 2019 | 19 / 41 | 23 / 460 | 1.5 |
| 2019 → 2023 | 14 / 41 | 30 / 460 | 1.8 |
Share error: the average gap between projected and real vote share for each list with 1% or more in an okręg, others left out.
2019 → 2023: 30 of 460 seats with the wrong list
| List | Projected | Actual | +/− |
|---|---|---|---|
| PiS | 194 | 194 | = |
| KO | 151 | 157 | −6 |
| TD | 68 | 65 | +3 |
| Lewica | 28 | 26 | +2 |
| Konfederacja | 18 | 18 | = |
| MN | 1 | 0 | +1 |
| The 27 okręgi that came out differently | Seats | Projected minus actual |
|---|---|---|
| Legnica (1) | 12 | Konfederacja +1, KO −1 |
| Wrocław (3) | 14 | PiS +1, TD −1 |
| Bydgoszcz (4) | 12 | Konfederacja +1, KO −1 |
| Lublin (6) | 15 | KO +1, Lewica −1 |
| Chełm (7) | 12 | TD +1, Konfederacja −1 |
| Zielona Góra (8) | 12 | Konfederacja +1, PiS −1 |
| Piotrków Trybunalski (10) | 9 | TD +1, PiS −1 |
| Nowy Sącz (14) | 10 | PiS +1, Konfederacja −1 |
| Tarnów (15) | 9 | PiS +1, KO −1 |
| Płock (16) | 10 | TD +1, KO −1 |
| Radom (17) | 9 | TD +1, PiS −1 |
| Warszawa (19) | 20 | KO +2, PiS +1, Lewica −1, TD −2 |
| Opole (21) | 12 | MN +1, TD +1, KO −1, Konfederacja −1 |
| Białystok (24) | 14 | Lewica +1, TD −1 |
| Gdańsk (25) | 12 | Konfederacja +1, TD −1 |
| Bielsko-Biała (27) | 9 | Lewica +1, Konfederacja −1 |
| Częstochowa (28) | 7 | Lewica +1, KO −1 |
| Bielsko-Biała (30) | 9 | PiS +1, Konfederacja −1 |
| Katowice (32) | 9 | KO +1, Lewica −1 |
| Kielce (33) | 16 | TD +1, KO −1 |
| Elbląg (34) | 8 | TD +1, PiS −1 |
| Olsztyn (35) | 10 | TD +1, KO −1 |
| Kalisz (36) | 12 | TD +1, PiS −1 |
| Piła (38) | 9 | Lewica +1, KO −1 |
| Poznań (39) | 10 | KO +1, TD −1 |
| Koszalin (40) | 8 | Lewica +1, KO −1 |
| Szczecin (41) | 12 | Konfederacja +1, KO −1 |
Largest share errors: Płock (16) 3.4, Katowice (32) 3.2, Poznań (39) 3.2, Katowice (31) 3.0, Warszawa (19) 2.8
2015 → 2019: 23 of 460 seats with the wrong list
| List | Projected | Actual | +/− |
|---|---|---|---|
| PiS | 230 | 235 | −5 |
| KO | 135 | 134 | +1 |
| Lewica | 51 | 49 | +2 |
| PSL (Koalicja Polska) | 31 | 30 | +1 |
| Konfederacja | 12 | 11 | +1 |
| MN | 1 | 1 | = |
| The 22 okręgi that came out differently | Seats | Projected minus actual |
|---|---|---|
| Legnica (1) | 12 | KO +1, PiS −1 |
| Wrocław (3) | 14 | PiS +1, Lewica −1 |
| Piotrków Trybunalski (10) | 9 | KO +1, PiS −1 |
| Kraków (12) | 8 | Lewica +1, PiS −1 |
| Kraków (13) | 14 | PiS +1, Lewica −1 |
| Nowy Sącz (14) | 10 | PiS +1, PSL (Koalicja Polska) −1 |
| Siedlce (18) | 12 | Lewica +1, PiS −1 |
| Warszawa (19) | 20 | PiS +1, KO −1 |
| Krosno (22) | 11 | Lewica +1, KO −1 |
| Gdańsk (25) | 12 | PiS +1, KO −1 |
| Słupsk (26) | 14 | PiS +1, Lewica −1 |
| Katowice (29) | 9 | PSL (Koalicja Polska) +1, KO −1 |
| Katowice (31) | 12 | PSL (Koalicja Polska) +1, KO −1 |
| Kielce (33) | 16 | PSL (Koalicja Polska) +1, Lewica +1, PiS −2 |
| Elbląg (34) | 8 | KO +1, PiS −1 |
| Olsztyn (35) | 10 | KO +1, PiS −1 |
| Kalisz (36) | 12 | KO +1, PiS −1 |
| Konin (37) | 9 | Lewica +1, PiS −1 |
| Piła (38) | 9 | KO +1, PiS −1 |
| Poznań (39) | 10 | KO +1, Lewica −1 |
| Koszalin (40) | 8 | Lewica +1, PSL (Koalicja Polska) −1 |
| Szczecin (41) | 12 | Konfederacja +1, KO −1 |
Largest share errors: Warszawa (19) 3.6, Piła (38) 2.5, Kielce (33) 2.4, Płock (16) 2.3, Elbląg (34) 2.2
1993 → 1997: 63 of 391 seats with the wrong list · not used by the model
| List | Projected | Actual | +/− |
|---|---|---|---|
| PiS | 148 | 172 | −24 |
| Lewica | 141 | 141 | = |
| KO | 40 | 49 | −9 |
| TD | 15 | 21 | −6 |
| Others | 45 | 6 | +39 |
| MN | 2 | 2 | = |
| The 46 okręgi that came out differently | Seats | Projected minus actual |
|---|---|---|
| Warszawa (1, 1993–1997) | 17 | PiS +2, Others −1, KO −1 |
| Białystok (4, 1993–1997) | 7 | Others +1, Lewica +1, PiS −2 |
| Bielsko-Biała (5, 1993–1997) | 9 | Others +1, Lewica +1, PiS −2 |
| Bydgoszcz (6, 1993–1997) | 11 | Others +1, PiS +1, Lewica −1, TD −1 |
| Ciechanów (8, 1993–1997) | 4 | PiS +1, TD −1 |
| Częstochowa (9, 1993–1997) | 8 | Others +1, PiS +1, Lewica −1, KO −1 |
| Elbląg (10, 1993–1997) | 5 | PiS +1, KO −1 |
| Gdańsk (11, 1993–1997) | 15 | Others +2, KO +1, Lewica −1, PiS −2 |
| Jelenia Góra (13, 1993–1997) | 5 | Lewica +1, PiS −1 |
| Kalisz (14, 1993–1997) | 7 | Others +1, TD −1 |
| Sosnowiec (15, 1993–1997) | 10 | Others +1, Lewica −1 |
| Katowice (16, 1993–1997) | 16 | Others +2, Lewica +1, KO −1, PiS −2 |
| Gliwice (17, 1993–1997) | 14 | Others +1, PiS −1 |
| Kielce (18, 1993–1997) | 12 | Others +1, PiS −1 |
| Konin (19, 1993–1997) | 5 | Others +1, PiS −1 |
| Koszalin (20, 1993–1997) | 5 | Others +1, PiS +1, Lewica −1, KO −1 |
| Kraków (21, 1993–1997) | 13 | Others +2, PiS −2 |
| Krosno (22, 1993–1997) | 5 | Others +1, PiS −1 |
| Leszno (24, 1993–1997) | 4 | Others +1, PiS −1 |
| Lublin (25, 1993–1997) | 10 | PiS +1, KO −1 |
| Łomża (26, 1993–1997) | 4 | Others +1, TD +1, PiS −2 |
| Łódź (27, 1993–1997) | 11 | Others +1, PiS −1 |
| Nowy Sącz (28, 1993–1997) | 7 | Others +1, PiS −1 |
| Olsztyn (29, 1993–1997) | 8 | Others +1, Lewica −1 |
| Opole (30, 1993–1997) | 10 | Others +1, KO −1 |
| Ostrołęka (31, 1993–1997) | 4 | Others +1, TD −1 |
| Piła (32, 1993–1997) | 5 | PiS +1, KO −1 |
| Piotrków Trybunalski (33, 1993–1997) | 7 | Others +1, KO −1 |
| Poznań (35, 1993–1997) | 14 | Others +1, KO +1, PiS −2 |
| Przemyśl (36, 1993–1997) | 4 | Others +1, PiS −1 |
| Radom (37, 1993–1997) | 8 | Lewica +1, KO −1 |
| Rzeszów (38, 1993–1997) | 8 | Others +2, Lewica +1, PiS −3 |
| Siedlce (39, 1993–1997) | 7 | Others +1, TD −1 |
| Sieradz (40, 1993–1997) | 4 | PiS +1, TD −1 |
| Skierniewice (41, 1993–1997) | 4 | Lewica +1, PiS −1 |
| Słupsk (42, 1993–1997) | 4 | Others +1, PiS −1 |
| Suwałki (43, 1993–1997) | 5 | Others +1, PiS −1 |
| Szczecin (44, 1993–1997) | 10 | Others +1, KO −1 |
| Tarnobrzeg (45, 1993–1997) | 6 | Others +1, PiS −1 |
| Tarnów (46, 1993–1997) | 7 | Others +1, KO +1, Lewica +1, PiS −3 |
| Toruń (47, 1993–1997) | 7 | Others +1, PiS −1 |
| Wałbrzych (48, 1993–1997) | 8 | Others +1, Lewica −1 |
| Włocławek (49, 1993–1997) | 4 | PiS +1, Lewica −1 |
| Wrocław (50, 1993–1997) | 12 | Others +1, KO −1 |
| Zamość (51, 1993–1997) | 5 | Others +1, TD −1 |
| Zielona Góra (52, 1993–1997) | 7 | Others +1, PiS −1 |
Largest share errors: Łomża (26, 1993–1997) 9.9, Tarnów (46, 1993–1997) 9.5, Rzeszów (38, 1993–1997) 6.6, Bydgoszcz (6, 1993–1997) 6.4, Warszawa (1, 1993–1997) 6.3
Where proportional swing needs care
- Merged lists whose parts live in different places. Trzecia Droga (PSL with Polska 2050) grew from PSL's 8.5% to 14.4%, a factor of 1.7. But in the third of okręgi where PSL had been weakest, mostly cities, it grew 2.3 times; in the third where PSL was strongest, only 1.3 times, because Polska 2050's voters were urban and PSL's rural. Proportional swing gives Trzecia Droga seats it did not win in rural okręgi (Chełm, Radom, Piotrków, Kalisz, Kielce, Płock) and misses them in Warszawa, Wrocław, Poznań, Gdańsk and Białystok.
- Uneven swings. In 2023 KO grew most where it had been weakest (by about a fifth, against a tenth where it was strongest), and in 2019 Konfederacja did the same. Proportional swing assumes the same fraction everywhere.
- The German minority. The forecast keeps its last vote, as there are no polls for it. In 2023 it fell from 0.17% to 0.12% nationally and lost its Opole seat, which the test still gives it.
- Small margins. Of the okręgi that came out differently in the pairs the model counts (from 2000 on), 46 of 49 are a single seat going to the next list in line. National totals stay close (no list off by more than 6 seats), but a given okręg is often off by one.
For this reason the simulations also move each party's share in every okręg at random (by about 8% of itself), so the 80% ranges allow for errors of this kind.
Correcting final polls
Each election is predicted with the correction worked out from the other elections only, so it never sees the result it is tested on. Correcting Polish polls was closer at 3 of 7 and further out at 4 (average miss per party 1.77 against 1.70 for the polls as published). So our projection leaves these polls as they are.
| Election | Polls' average miss | Corrected | Verdict |
|---|---|---|---|
| 2001 | 2.37 | 2.69 | Correction further out |
| 2005 | 4.27 | 4.31 | Correction further out |
| 2007 | 0.53 | 0.47 | Correction closer |
| 2011 | 0.81 | 0.70 | Correction closer |
| 2015 | 0.43 | 0.73 | Correction further out |
| 2019 | 1.63 | 1.65 | Correction further out |
| 2023 | 1.86 | 1.81 | Correction closer |
Pulling back towards the last result
Closer than the polls as they stand, so used on the election-day page. Details →
- Proportional swing ignores local candidates and new splits: Rozwój Plus is assumed to be strongest where PiS was strongest, and KKP where Konfederacja was.
- Seats per okręg: we use the 2011 apportionment, still in force. The Sejm and Senate passed a bill in September 2026 under which the PKW would reset the seats every year (by its January 2026 count, 13 okręgi would lose a seat and 8 gain, okręg 20 going from 12 to 15). It awaits the President's signature or veto; if it becomes law, the seats per okręg and the hex map change.
- The line-ups are assumptions until the lists are registered.
- Election silence: no poll may be published from midnight at the start of the day before polling day until voting ends (Kodeks wyborczy art. 115).
Figures as of . Published by Polling Forecast.
 United Kingdom
 France
 Germany
 Spain
 Italy
 Netherlands
 Canada
 Australia