
France's presidential election, round one, 18 April 2027: how far the polls can still move by polling day, and what our forecast would look like after a typical miss.
| Candidate | Round one today | Polling day | Round two: polling day | Wins: polling day |
|---|---|---|---|---|
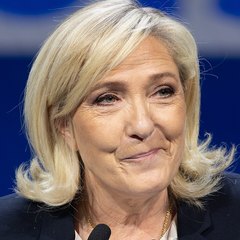 Marine Le Pen National Rally |
32.8 | 32.8 | over 99% | 91% |
 Jean-Luc Mélenchon France Unbowed |
18.3 | 18.3 | 67% | under 1% |
 Édouard Philippe Ensemble (Macron camp) |
12.2 | 12.2 | 15% | 5% |
 Raphaël Glucksmann Socialists |
11.6 | 11.6 | 14% | 2% |
 Bruno Retailleau Republicans |
6.0 | 6.0 | 2% | under 1% |
 Éric Zemmour Reconquête |
3.5 | 3.5 | 1% | under 1% |
 Marine Tondelier Greens |
2.6 | 2.6 | under 1% | under 1% |
 Fabien Roussel Communist Party |
2.1 | 2.1 | under 1% | under 1% |
 Nicolas Dupont-Aignan Sovereigntists |
2.1 | 2.1 | under 1% | under 1% |
 Nathalie Arthaud Far left |
0.8 | 0.8 | under 1% | under 1% |
Polling-day chances from 10,000 simulated elections, each candidate's share drawn with the final-poll error and the drift for 148 days (4.9 points).
National Assembly
No legislative election is scheduled, so there is no polling day to forecast. If the Assembly is dissolved, the campaign lasts 20 to 40 days, and legislative polls have moved by about as much as presidential ones over that distance. Our seat projection already carries the final-poll uncertainty.
Why polls move, and by how much
For each presidential election since 2002, we took every round-one poll at set distances before polling day (each pollster's polls in the 60 days before that point, averaged, then averaged across pollsters) and compared it with the result and with the party's previous result. Months out, a British party's final share has often been closer to its previous result than its polls; we fitted the same curve in France:
w(days) = floor + (1 − floor) × exp(−days / τ)
The best fit is floor = 0.63 and τ = 600 days. But each election predicted with the curve fitted on the others is not closer than the polls as they stand, so we don't use it:
| Days before polling day | Elections | Polls' miss | Previous result's miss | Pull-back's miss | Typical miss (RMSE) |
|---|---|---|---|---|---|
| 30 | 5 | 1.93 | 5.76 | 1.96 | 2.72 |
| 61 | 5 | 2.79 | 5.76 | 2.82 | 4.05 |
| 91 | 5 | 3.24 | 5.76 | 3.28 | 4.51 |
| 182 | 5 | 3.81 | 5.76 | 3.81 | 4.98 |
| 273 | 5 | 4.46 | 5.76 | 4.43 | 5.95 |
| 365 | 5 | 4.36 | 5.76 | 4.30 | 5.50 |
Average absolute miss per candidate family, in points. Previous result: each family's 2017 or 2022 share taken as the forecast.
How much uncertainty to add
The typical miss grows with distance. We fit it as rmse(days) = r30 + k × ln(days / 30): r30 = 3.01, k = 1.16. So: 30 days out 3.0 points, 90 days out 4.3 points, 180 days out 5.1 points, 365 days out 5.9 points.
How it did, election by election
Polls' average miss per family at each distance, for each past election.
| Days out | 2002 | 2007 | 2012 | 2017 | 2022 |
|---|---|---|---|---|---|
| 30 | 2.47 | 1.17 | 0.91 | 2.55 | 2.55 |
| 61 | 3.60 | 0.79 | 1.24 | 4.07 | 4.25 |
| 91 | 4.26 | 1.73 | 1.30 | 3.80 | 5.08 |
| 182 | 4.86 | 2.97 | 1.66 | 4.58 | 4.99 |
| 273 | 5.81 | 3.55 | 1.99 | 6.30 | 4.67 |
| 365 | 5.67 | 3.59 | 2.63 | 5.22 | 4.68 |
What this can't tell you
- Who will stand. Candidacies close in March 2027; a withdrawal or a new candidate changes everything, and we follow only the line-ups pollsters test.
- Events. The evidence covers five campaigns; 2017's collapse of the Fillon campaign is in it, but the next shock may be bigger.
- Round two far out. Runoff polls a year ahead are rare; we use the same drift for them as for round one.
Figures as of . Published by Polling Forecast.
 United Kingdom
 Germany
 Spain
 Italy
 Netherlands
 Poland
 Canada
 Australia